Climate for Station: Sotchi, Krasnodar Krai, Russia
Loading live weather...
Climate Analysis & Overview
The climate profile of Sochi reveals a warming trend in maximum temperatures, yet a cooling trend in minimum temperatures over the past decade. This duality in temperature trends, alongside a more even distribution of precipitation, paints a complex picture of Sochi's evolving climate dynamics.
Subtropical Coastal Influence
Sochi, located at 43.58°N, 39.77°E, enjoys a humid subtropical climate, classified as Cfa under the Köppen system. Nestled between the Black Sea coast and the Caucasus Mountains, Sochi's climate is heavily influenced by its geographical setting. The mountains act as a barrier, moderating cold air masses from the north, while the sea provides a source of moisture and warmth. This unique combination results in mild winters and hot, humid summers.
Temperature Trends: A Tale of Two Extremes
Over the past decade, Sochi has experienced contrasting temperature trends. The maximum temperatures have shown a warming trend of 0.22°C (0.40°F), suggesting hotter days. However, minimum temperatures have exhibited a cooling trend of -0.72°C (-1.30°F), indicating colder nights. When considering the all-time trends, both maximum and minimum temperatures show a warming pattern, albeit more modestly, with increases of 0.10°C (0.18°F) and 0.05°C (0.09°F) respectively. These trends highlight the complex thermal oscillations affecting the region.
Precipitation Patterns: Towards Even Distribution
The Precipitation Concentration Index (PCI) for Sochi has decreased from a baseline of 11.6 to a current value of 9.9. This change signifies a more evenly distributed precipitation pattern, reducing the likelihood of intense, concentrated rainfall events. Such a shift could have implications for local agriculture and water management strategies, as more consistent rainfall may benefit crop growth and reduce flood risks.
Record Extremes: A Climate of Contrasts
Sochi's temperature records underscore its climatic variability. The highest recorded temperature stands at 38.5°C (101.3°F), while the lowest plummeted to -13.4°C (7.9°F). These extremes highlight the potential for significant temperature fluctuations, a characteristic feature of coastal climates influenced by both maritime and continental air masses.
Regional Climate Goals and Implications
Russia's commitment to reducing greenhouse gas emissions and enhancing climate resilience is particularly relevant for Sochi. As the city prepares to host international events, understanding and adapting to these climatic changes is crucial. Recent weather events, such as unseasonal storms and temperature anomalies, further underscore the need for robust climate adaptation strategies.
Station Statistics
10-Year Trend
High: +0.38 °C/decade
Low: -0.57 °C/decade
Rain: -0.33 mm/decade
25-Year Trend
High: +0.50 °C/decade
Low: +0.24 °C/decade
Rain: -0.33 mm/decade
50-Year Trend
High: +0.39 °C/decade
Low: +0.28 °C/decade
Rain: -0.01 mm/decade
All-Time Trend
High: +0.10 °C/decade
Low: +0.05 °C/decade
Rain: -0.04 mm/decade
Percentage Above-Average Days
Last 12 Months: 54.2%
This Year: 50.0%
Precipitation Concentration Index (PCI) ℹ️
Last 12 Months: 9.9
Historical Average: 12.2
Percentile Rank of Last 12 Months ℹ️
High: 83rd percentile
Low: 60th percentile
Rain: 18th percentile
Change in Variance ℹ️
High: +6.2%
Low: +9.3%
Intraday: +25.7%
Data Coverage
89.6%
First Year of Data
1912
Station Location
Historical Weather Records
| Max High | Avg High | Min High | Max Avg | Avg Avg | Min Avg | Max Low | Avg Low | Min Low | Max Precipitation | Avg Precipitation | Max Snow | Avg Snow | |
|---|---|---|---|---|---|---|---|---|---|---|---|---|---|
| Record | 38.5 °C | — | -4.4 °C | 33.1 °C | — | -9.4 °C | 26.8 °C | — | -13.4 °C | 245.2 mm | — | — | — |
| January | 24.0 °C | 9.7 °C | -4.4 °C | 17.9 °C | 6.0 °C | -9.4 °C | 14.6 °C | 3.3 °C | -13.4 °C | 182.0 mm | 5.8 mm | — | — |
| February | 23.5 °C | 10.1 °C | -3.9 °C | 20.2 °C | 6.2 °C | -9.0 °C | 15.3 °C | 3.4 °C | -12.6 °C | 176.0 mm | 5.0 mm | — | — |
| March | 30.0 °C | 12.2 °C | -0.2 °C | 25.7 °C | 8.2 °C | -5.1 °C | 22.0 °C | 5.1 °C | -7.0 °C | 84.5 mm | 4.4 mm | — | — |
| April | 33.7 °C | 16.3 °C | 3.9 °C | 26.8 °C | 11.9 °C | 0.0 °C | 21.0 °C | 8.6 °C | -5.0 °C | 123.0 mm | 3.8 mm | — | — |
| May | 34.7 °C | 20.6 °C | 9.1 °C | 28.1 °C | 16.3 °C | 6.9 °C | 23.4 °C | 12.8 °C | 3.0 °C | 118.0 mm | 2.9 mm | — | — |
| June | 35.2 °C | 24.4 °C | 13.8 °C | 29.4 °C | 20.4 °C | 11.8 °C | 24.4 °C | 16.7 °C | 7.1 °C | 125.5 mm | 3.2 mm | — | — |
| July | 38.4 °C | 27.0 °C | 18.7 °C | 30.8 °C | 23.2 °C | 16.0 °C | 26.8 °C | 19.4 °C | 12.6 °C | 185.0 mm | 3.5 mm | — | — |
| August | 38.5 °C | 27.6 °C | 18.4 °C | 33.1 °C | 23.4 °C | 14.8 °C | 26.7 °C | 19.7 °C | 10.4 °C | 245.2 mm | 3.6 mm | — | — |
| September | 36.0 °C | 24.5 °C | 10.8 °C | 29.1 °C | 19.9 °C | 5.6 °C | 25.1 °C | 16.3 °C | 2.7 °C | 176.8 mm | 4.7 mm | — | — |
| October | 32.1 °C | 20.2 °C | 6.7 °C | 28.0 °C | 15.7 °C | -0.5 °C | 23.1 °C | 12.3 °C | -3.2 °C | 175.0 mm | 4.9 mm | — | — |
| November | 29.1 °C | 15.8 °C | 2.0 °C | 23.7 °C | 11.6 °C | -1.6 °C | 20.8 °C | 8.5 °C | -5.4 °C | 154.4 mm | 5.7 mm | — | — |
| December | 23.5 °C | 11.9 °C | -1.1 °C | 21.4 °C | 8.2 °C | -5.3 °C | 17.5 °C | 5.4 °C | -8.3 °C | 139.0 mm | 6.1 mm | — | — |
Data Visualisations
Remove WatermarksCurrent Year Climate Trends vs Historical


Max Temperature this Year | 1 of 6
Climate 12-Month Moving Averages


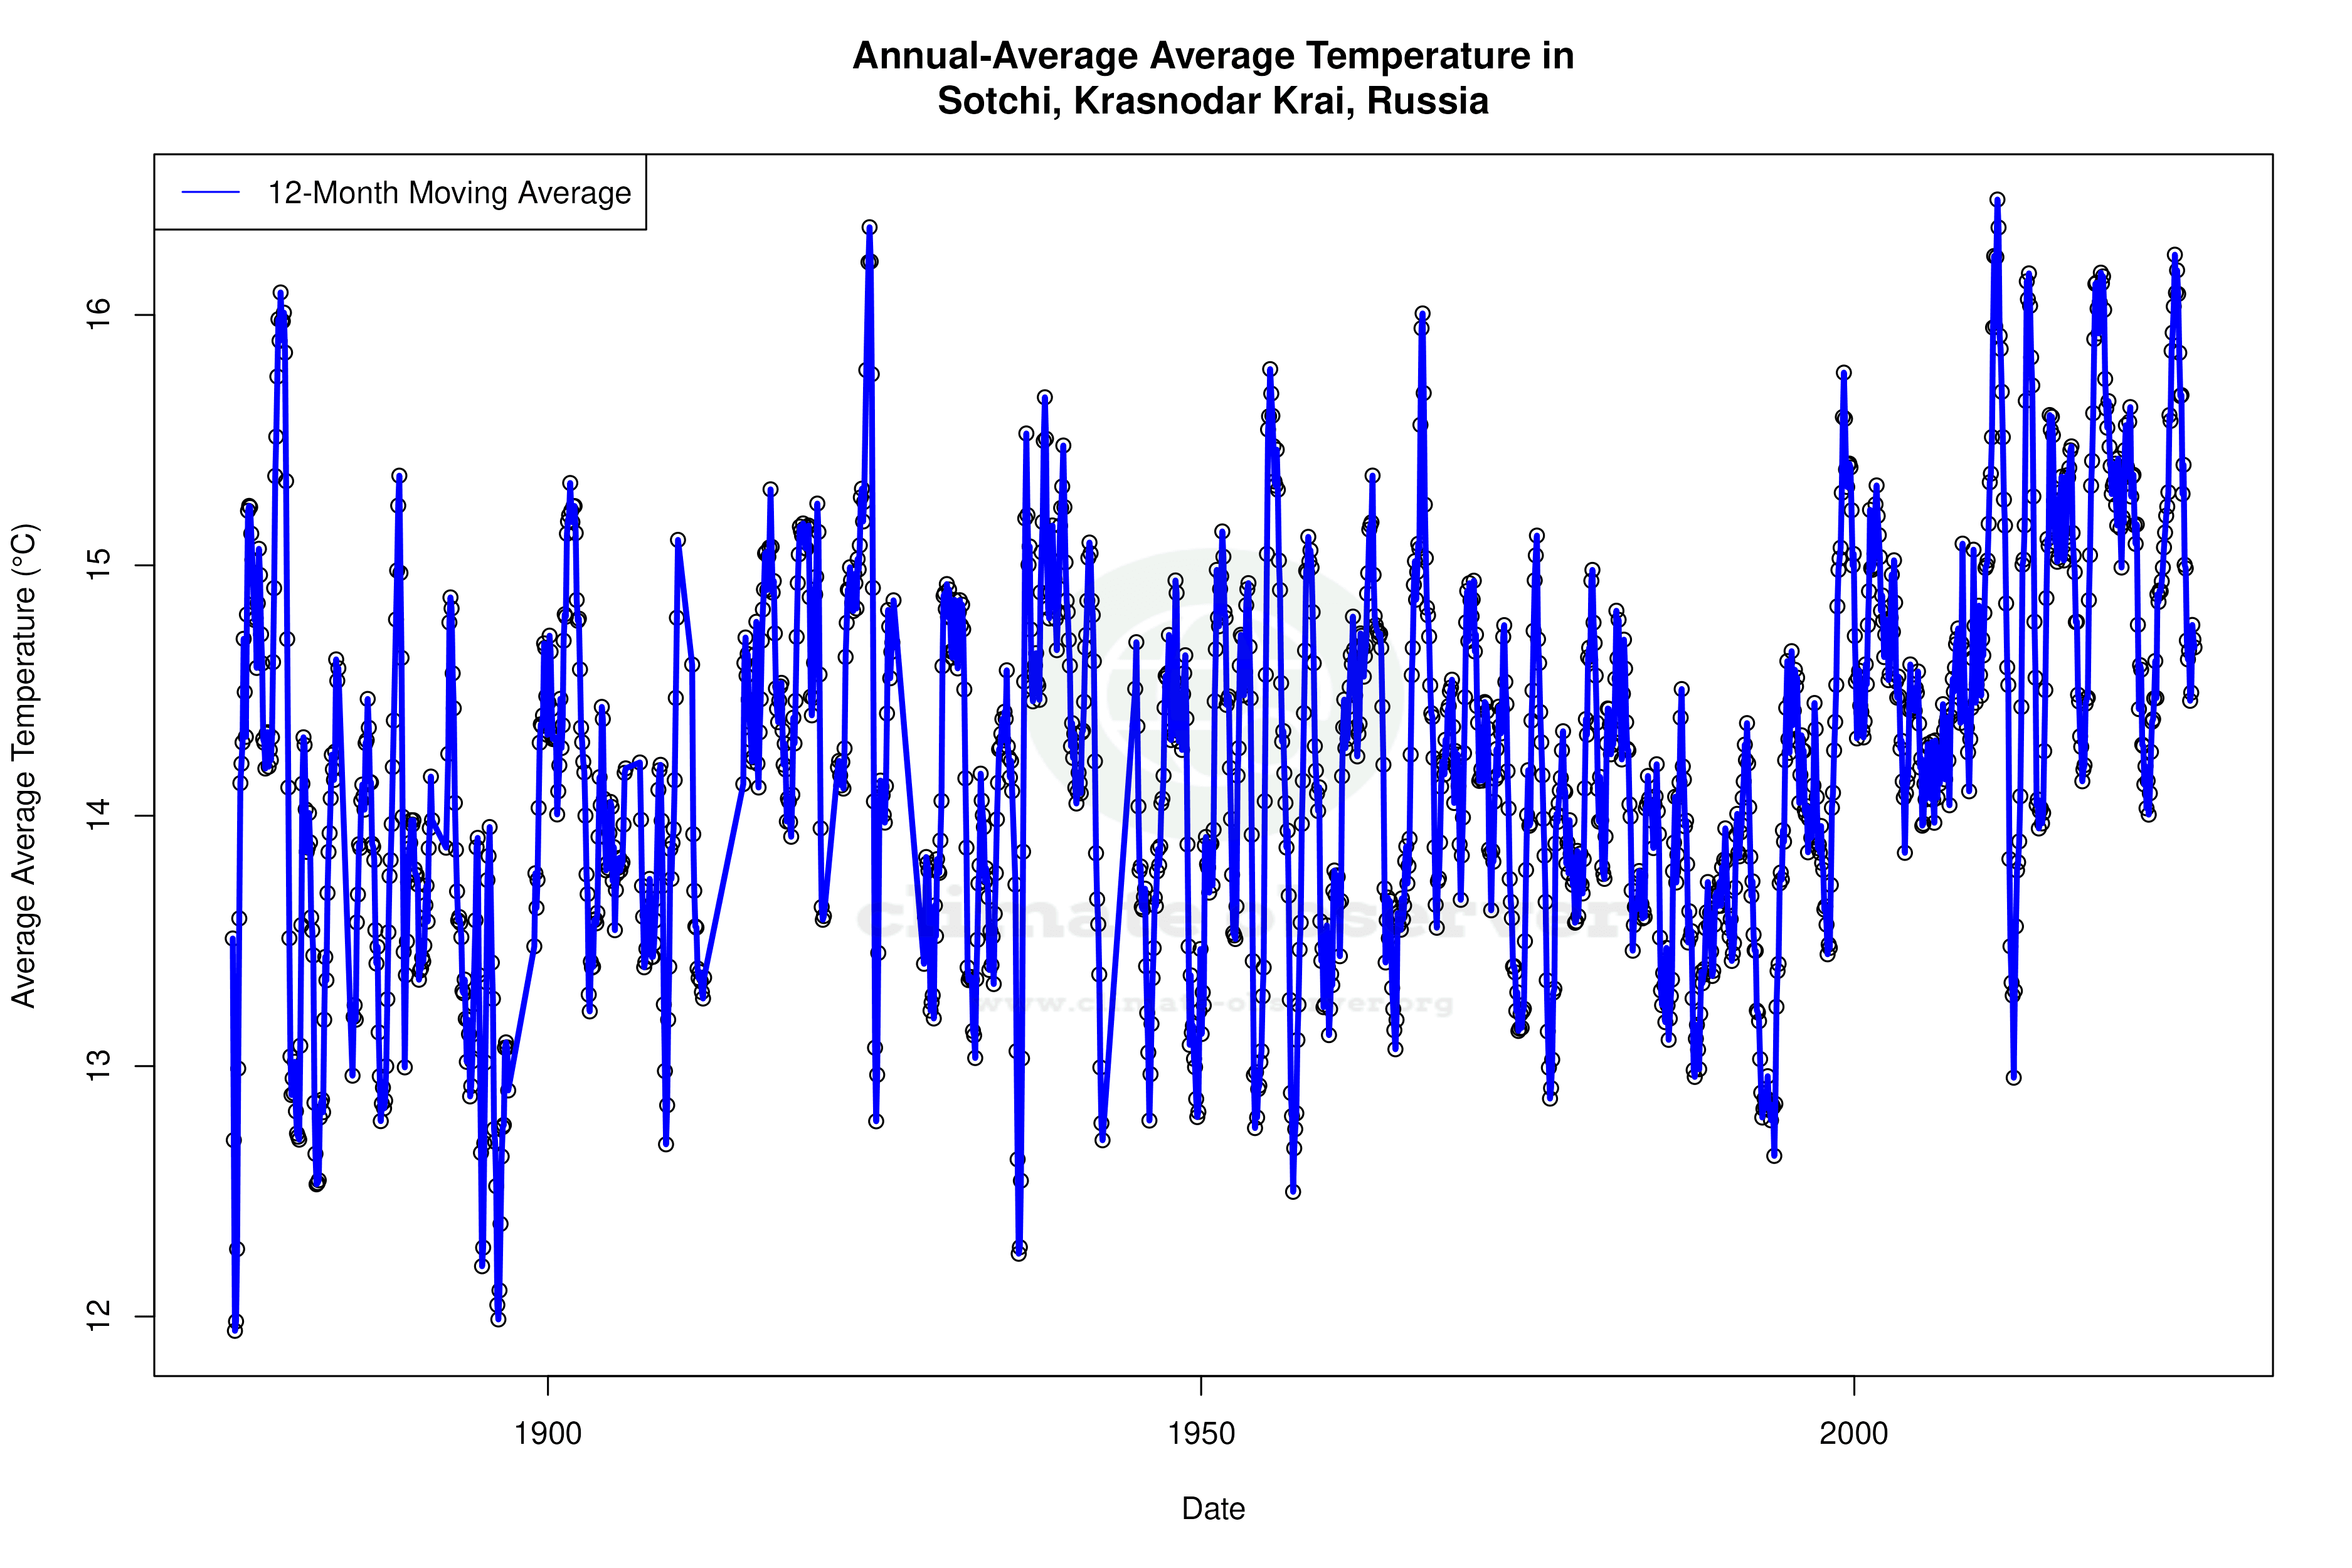


Max Temperature 12-Month MA | 1 of 6
Daily Data Points and Averages Throughout the Year


Average Max Temperature Throughout Year | 1 of 5
