Climate for Station: Mahackala, Dagestan, Russia
Loading live weather...
Climate Analysis & Overview
Mahackala's climate is experiencing a notable warming trend, with high temperatures rising by 0.14°C (0.25°F) over the long term. Recent years have seen an accelerated increase in highs by 1.66°C (2.99°F) over the past decade. Precipitation is becoming slightly more concentrated, indicating potential shifts in weather patterns.
A Warming Landscape
Mahackala, located in the North Caucasus region of Russia, is characterised by a semi-arid climate (Köppen classification BSk). This classification indicates dry conditions with some seasonal temperature variation. The city's proximity to the Caspian Sea moderates its climate, providing a buffer against extreme temperature fluctuations. However, the region is witnessing a warming trend, where the all-time high temperatures have risen by 0.14°C (0.25°F). This gradual increase suggests a long-term warming pattern, which aligns with broader regional climate goals to monitor and adapt to climate change.
Recent Temperature Surges
While the all-time trends indicate a modest warming, the past decade has seen a more pronounced rise in high temperatures, with an increase of 1.66°C (2.99°F). This surge is significant and suggests that recent years have been notably warmer, possibly due to increased greenhouse gas emissions or localised climatic changes. In contrast, low temperatures have risen by 0.55°C (0.99°F) over the same period, indicating that both day and night temperatures are on the rise. These changes may impact local agriculture and water resources, necessitating adaptive strategies.
Precipitation Patterns Shifting
The Precipitation Concentration Index (PCI), a measure of how rainfall is distributed throughout the year, has seen a slight increase from a baseline of 13.97 to 14.78. This suggests that precipitation is becoming more concentrated in fewer events, which could lead to more intense rainfall periods interspersed with longer dry spells. While the change is not drastic, it highlights a shift that could affect water management and flood risk in the region.
Temperature Extremes and Records
Mahackala has experienced temperature extremes, with record highs reaching 40.2°C (104.4°F) and lows plummeting to -25.1°C (-13.2°F). These records illustrate the potential for significant temperature variability, despite the overall warming trend. Such extremes can have profound effects on infrastructure and human health, particularly during heatwaves or cold snaps.
Implications for the Future
The climatic trends observed in Mahackala are crucial for understanding regional climate dynamics and planning for future challenges. The warming trends, especially the recent acceleration, suggest that the city may need to implement strategies to mitigate heat stress and manage water resources effectively. As precipitation becomes more concentrated, it will be essential to enhance flood defences and ensure sustainable water supply systems.
Station Statistics
10-Year Trend
High: +1.77 °C/decade
Low: +0.66 °C/decade
Rain: +0.36 mm/decade
25-Year Trend
High: +0.69 °C/decade
Low: +0.55 °C/decade
Rain: +0.07 mm/decade
50-Year Trend
High: +0.54 °C/decade
Low: +0.17 °C/decade
Rain: +0.06 mm/decade
All-Time Trend
High: +0.14 °C/decade
Low: +0.10 °C/decade
Rain: -0.02 mm/decade
Percentage Above-Average Days
Last 12 Months: 57.3%
This Year: 60.5%
Precipitation Concentration Index (PCI) ℹ️
Last 12 Months: 15.5
Historical Average: 14.8
Percentile Rank of Last 12 Months ℹ️
High: 92nd percentile
Low: 79th percentile
Rain: 84th percentile
Change in Variance ℹ️
High: -7.7%
Low: -13.0%
Intraday: +19.0%
Data Coverage
93.3%
First Year of Data
1906
Station Location
Historical Weather Records
| Max High | Avg High | Min High | Max Avg | Avg Avg | Min Avg | Max Low | Avg Low | Min Low | Max Precipitation | Avg Precipitation | Max Snow | Avg Snow | |
|---|---|---|---|---|---|---|---|---|---|---|---|---|---|
| Record | 40.2 °C | — | -17.6 °C | 32.0 °C | — | -20.7 °C | 29.0 °C | — | -25.1 °C | 103.5 mm | — | — | — |
| January | 19.0 °C | 3.6 °C | -17.6 °C | 11.2 °C | 0.2 °C | -20.7 °C | 7.2 °C | -2.5 °C | -25.1 °C | 43.9 mm | 1.0 mm | — | — |
| February | 20.9 °C | 3.6 °C | -15.4 °C | 15.1 °C | 0.7 °C | -19.7 °C | 9.4 °C | -1.9 °C | -22.1 °C | 48.2 mm | 1.0 mm | — | — |
| March | 28.8 °C | 7.5 °C | -7.0 °C | 18.6 °C | 4.1 °C | -9.4 °C | 12.1 °C | 1.3 °C | -13.5 °C | 24.5 mm | 0.8 mm | — | — |
| April | 33.5 °C | 14.1 °C | 1.0 °C | 22.2 °C | 9.9 °C | -2.3 °C | 17.7 °C | 6.5 °C | -5.1 °C | 48.3 mm | 0.8 mm | — | — |
| May | 35.1 °C | 20.7 °C | 7.4 °C | 26.7 °C | 16.6 °C | 3.3 °C | 23.2 °C | 12.6 °C | 0.0 °C | 54.0 mm | 0.9 mm | — | — |
| June | 36.8 °C | 26.1 °C | 14.7 °C | 30.8 °C | 21.9 °C | 11.0 °C | 27.7 °C | 17.8 °C | 5.8 °C | 69.5 mm | 1.0 mm | — | — |
| July | 39.5 °C | 28.9 °C | 18.5 °C | 32.0 °C | 24.9 °C | 15.5 °C | 29.0 °C | 20.8 °C | 9.7 °C | 39.4 mm | 0.8 mm | — | — |
| August | 40.2 °C | 28.4 °C | 16.8 °C | 32.0 °C | 24.4 °C | 14.0 °C | 27.6 °C | 20.5 °C | 9.0 °C | 93.7 mm | 0.9 mm | — | — |
| September | 36.3 °C | 23.6 °C | 7.8 °C | 29.1 °C | 19.8 °C | 5.3 °C | 26.5 °C | 16.2 °C | 0.0 °C | 103.5 mm | 1.6 mm | — | — |
| October | 28.9 °C | 17.1 °C | 0.5 °C | 23.0 °C | 13.7 °C | -2.3 °C | 19.9 °C | 10.4 °C | -6.6 °C | 50.8 mm | 1.4 mm | — | — |
| November | 24.2 °C | 10.6 °C | -10.8 °C | 17.5 °C | 7.5 °C | -14.0 °C | 16.3 °C | 4.6 °C | -16.0 °C | 74.5 mm | 1.5 mm | — | — |
| December | 20.1 °C | 5.8 °C | -14.0 °C | 13.9 °C | 2.9 °C | -18.4 °C | 11.8 °C | 0.2 °C | -22.3 °C | 48.7 mm | 1.2 mm | — | — |
Data Visualisations
Remove WatermarksCurrent Year Climate Trends vs Historical


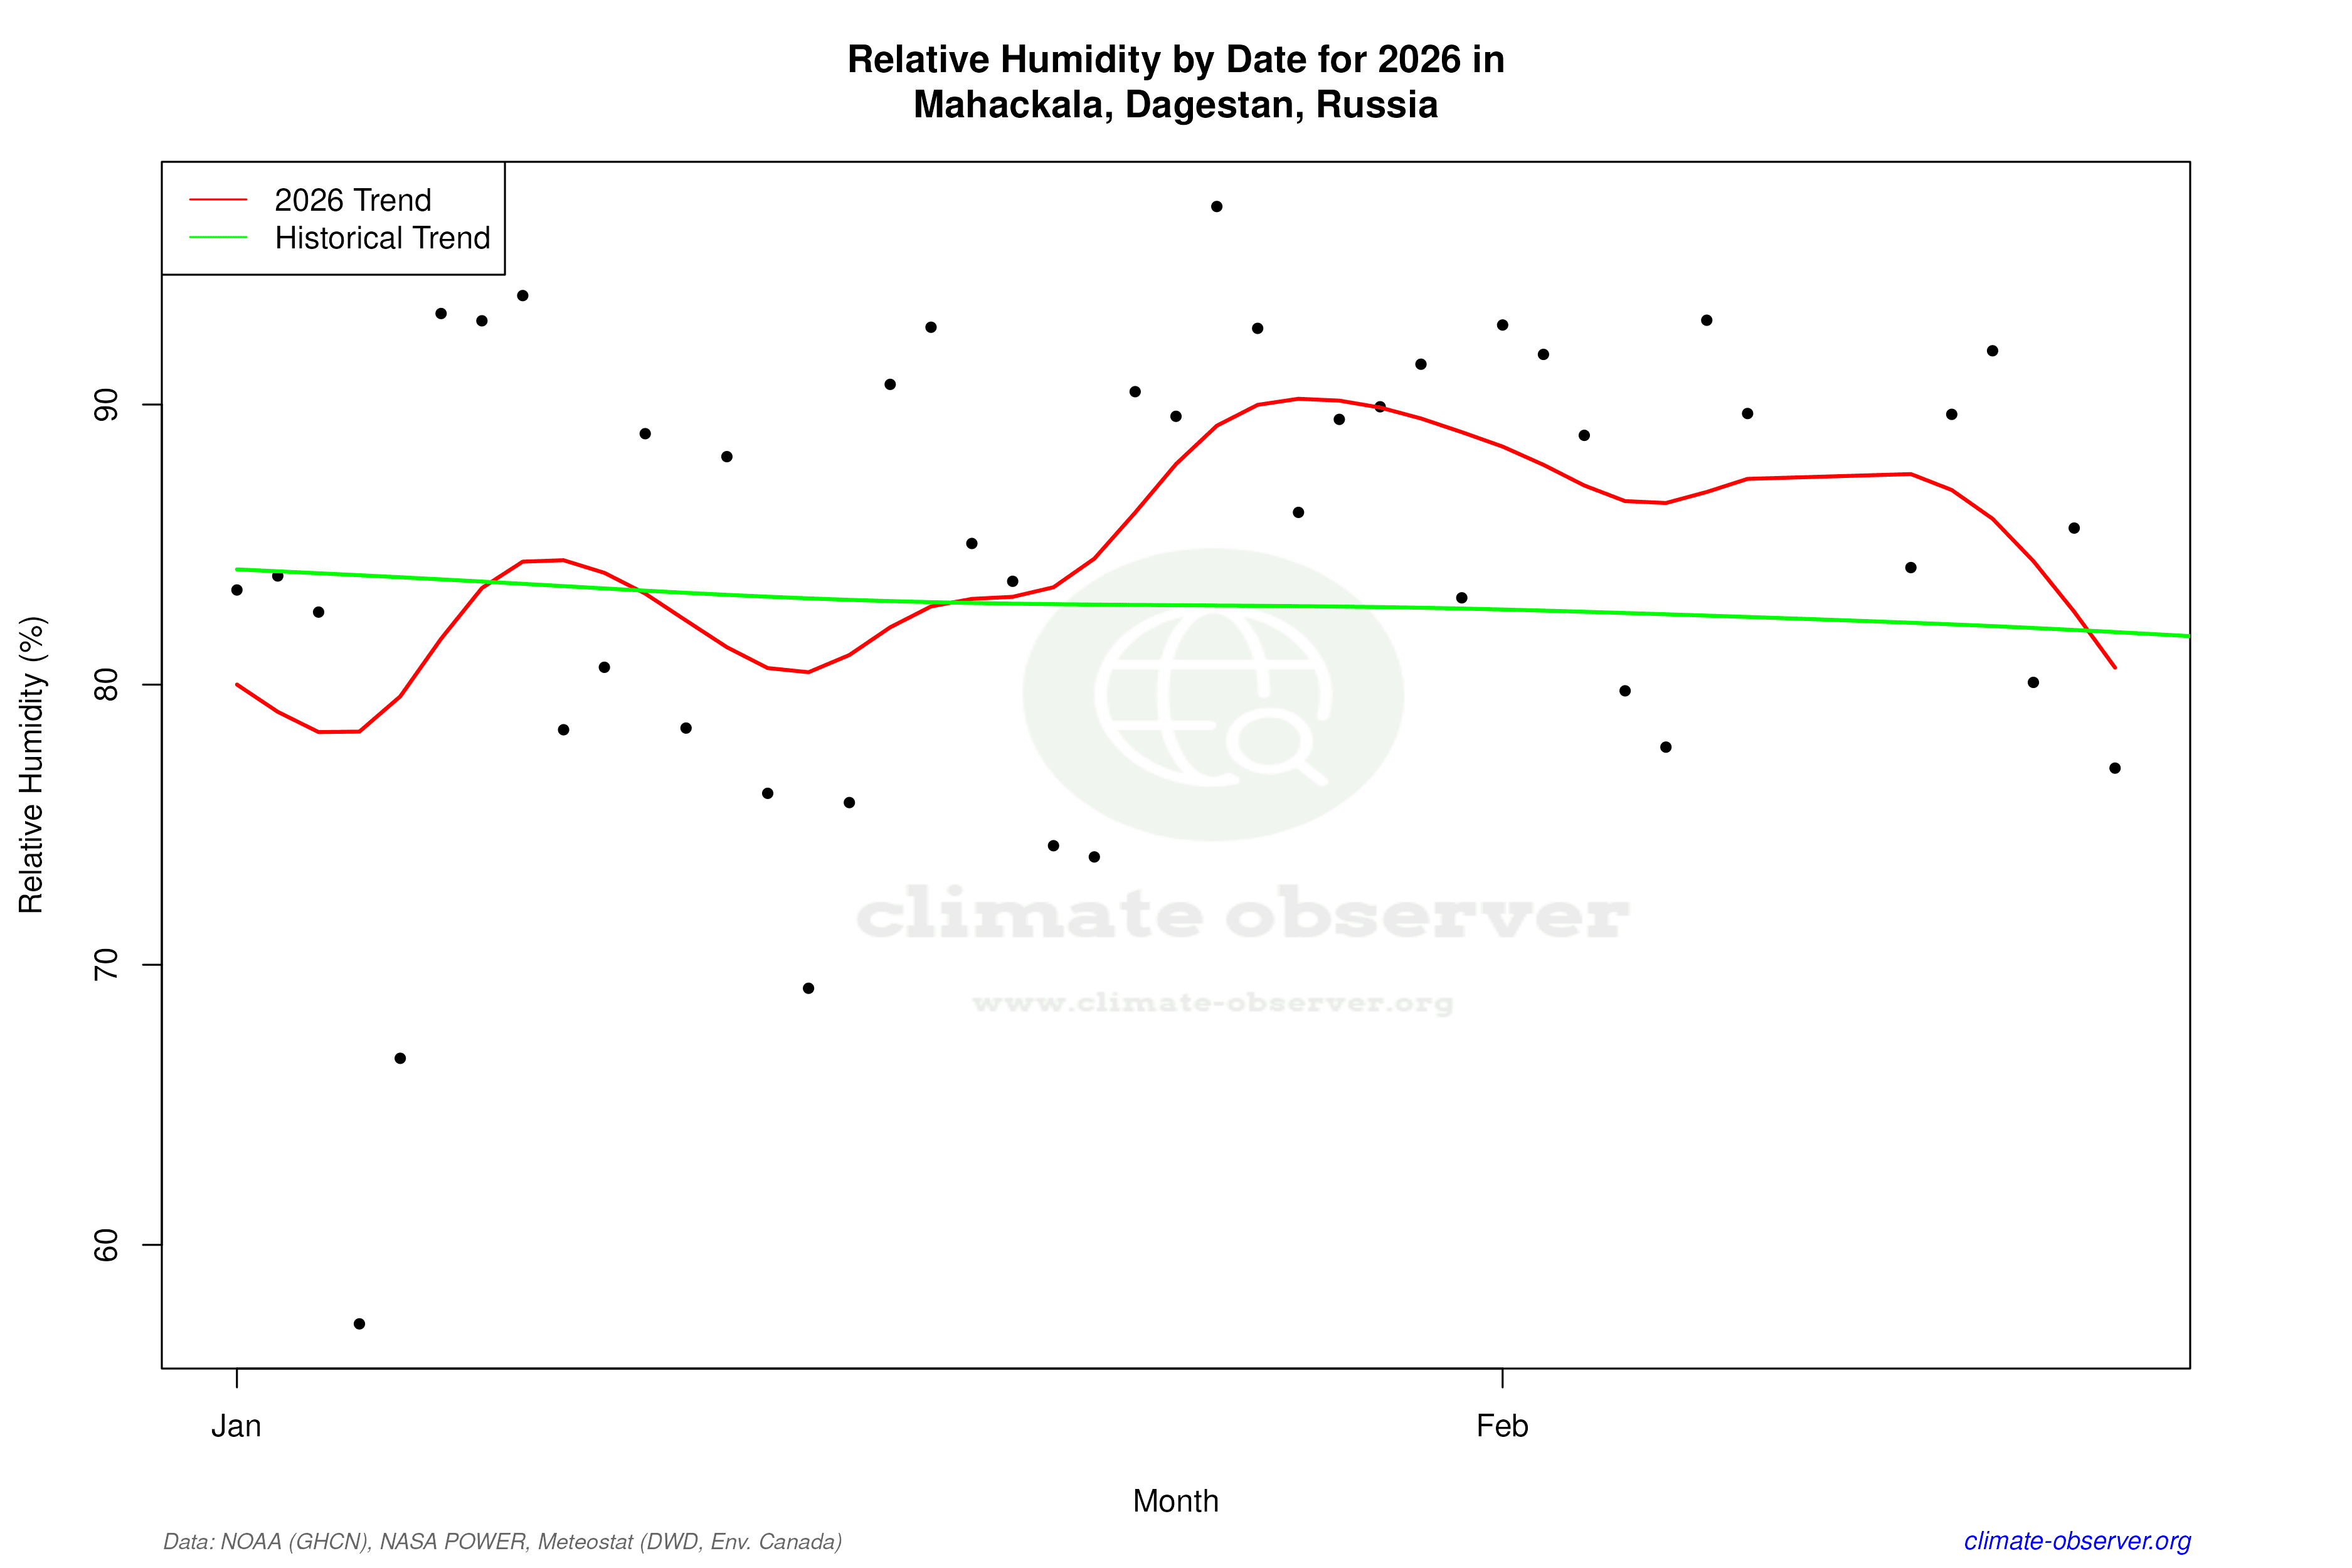

Max Temperature this Year | 1 of 6
Climate 12-Month Moving Averages


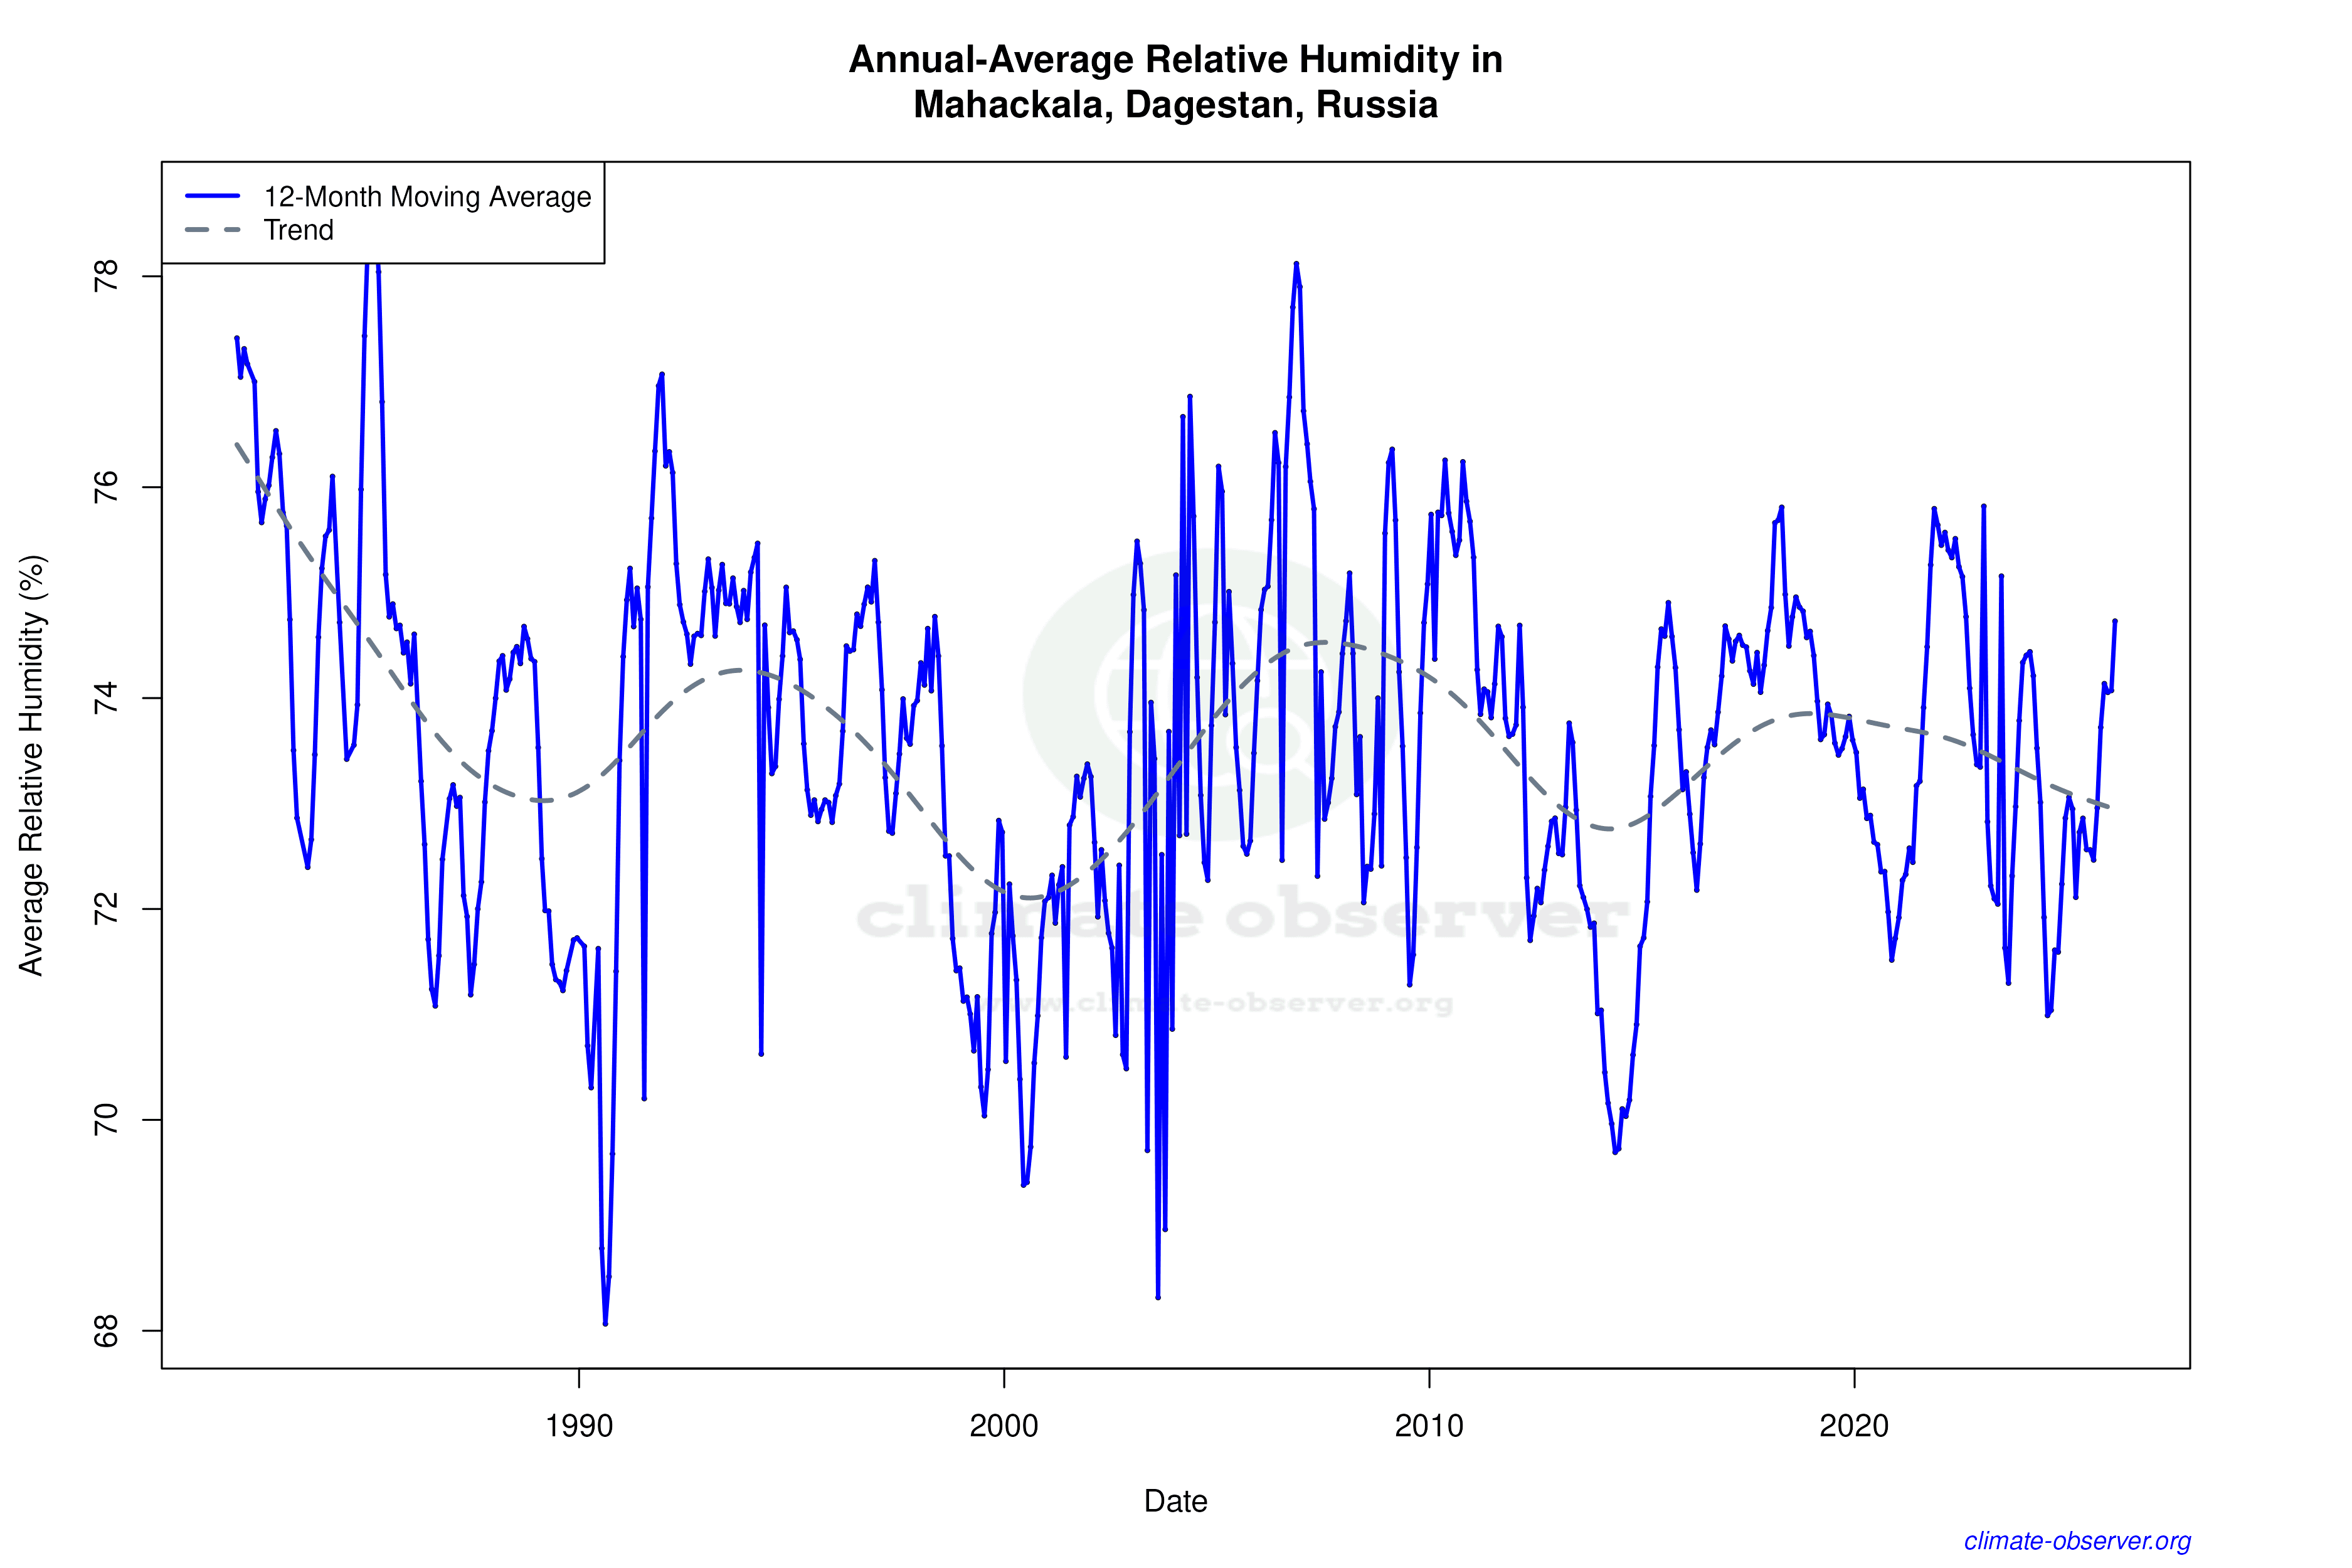

Max Temperature 12-Month MA | 1 of 6
Daily Data Points and Averages Throughout the Year


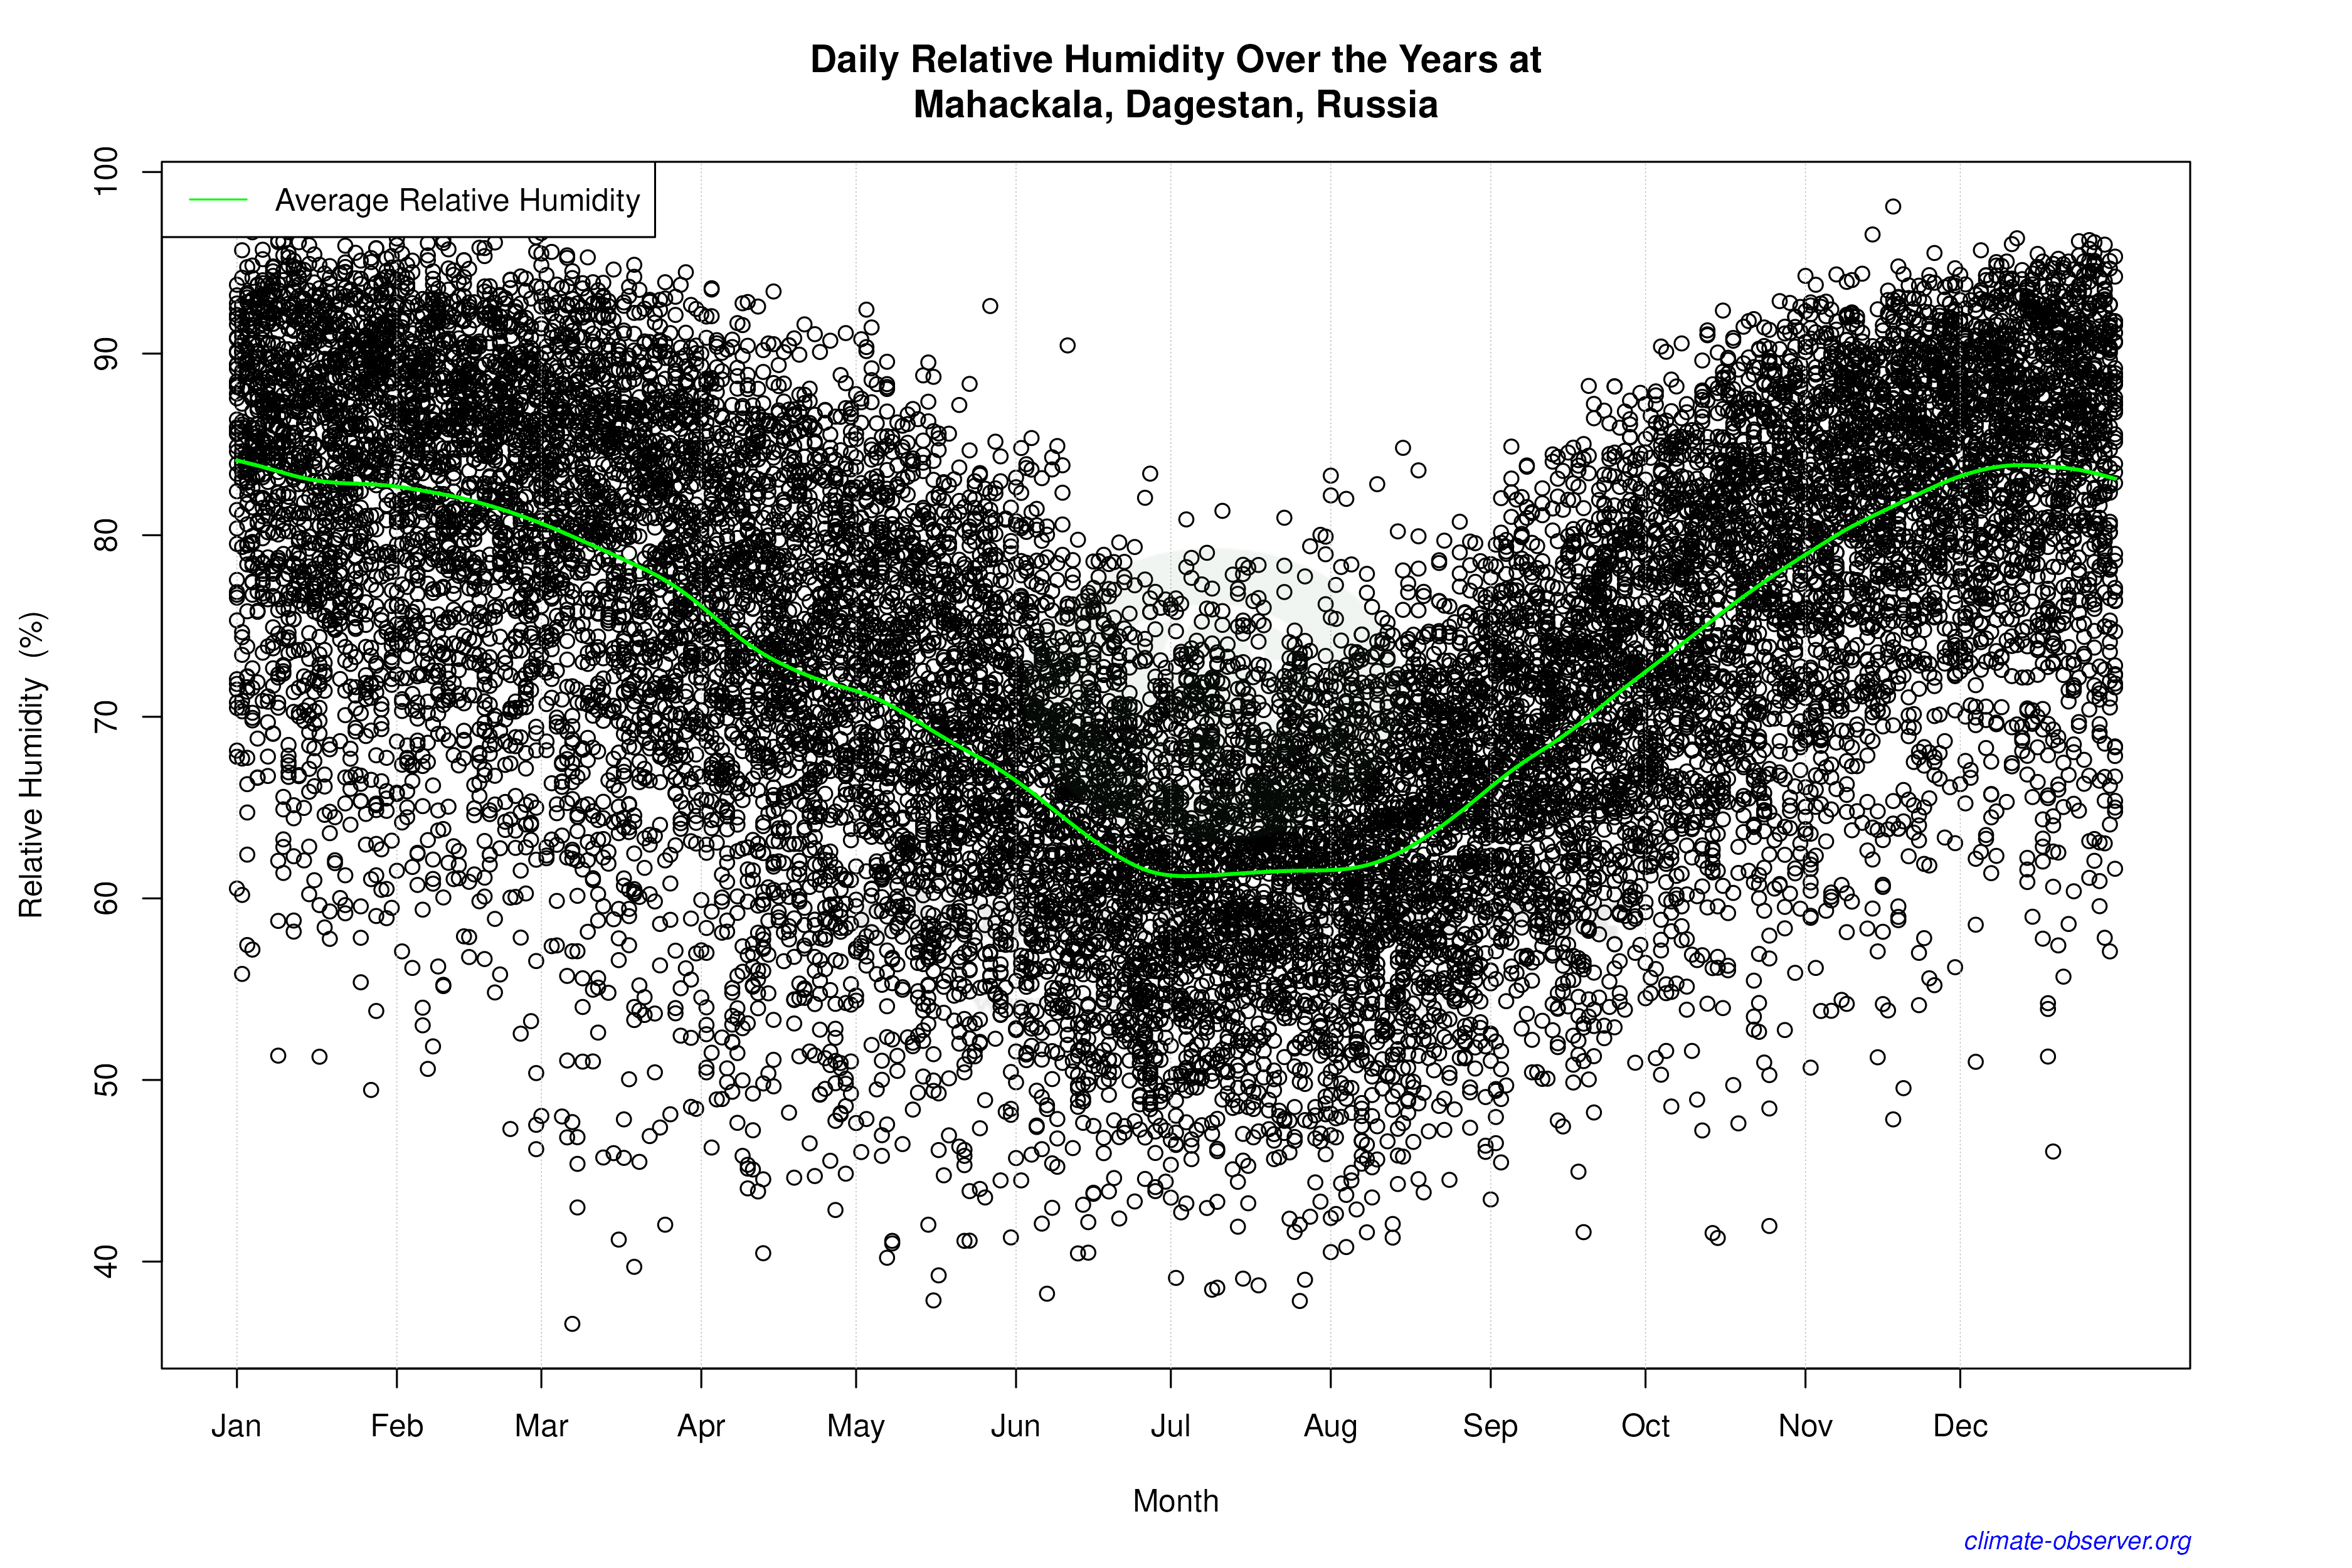

Average Max Temperature Throughout Year | 1 of 5
