Climate for Station: Wejh, Tabuk Region, Saudi Arabia
Loading live weather...
Climate Analysis & Overview
Wejh, a coastal town in Saudi Arabia's Tabuk region, experiences a nuanced climate story marked by a long-term warming trend, juxtaposed with a recent cooling in the last decade. The precipitation pattern has shifted towards more even distribution, reflecting significant changes in the local climate dynamics.
Coastal Climate Dynamics
Wejh is situated along the Red Sea coast, influenced by its maritime proximity and classified under the hot desert climate (BWh) according to the Köppen classification. This location contributes to its typically high temperatures and low precipitation. The all-time temperature trends reveal a warming pattern, with highs increasing by 0.39°C (0.70°F) and lows by 0.41°C (0.74°F). However, the past decade has seen a cooling trend, with highs dropping by 1.28°C (2.30°F) and lows by 0.29°C (0.53°F), indicating a recent shift in thermal dynamics.
Temperature Extremes and Records
The climate of Wejh is characterised by significant temperature extremes. The recorded maximum temperature reaches 44.0°C (111.2°F), while the minimum drops to 4.0°C (39.2°F). These extremes are typical of desert climates, where daytime heating and nighttime cooling are pronounced due to the lack of moisture in the air, which would otherwise moderate temperature fluctuations.
Precipitation Patterns and Changes
The Precipitation Concentration Index (PCI) is a measure of how precipitation is distributed over time. Wejh's PCI has decreased from a baseline of 51.9 to 44.1, suggesting a shift towards more evenly distributed rainfall events. This change may be indicative of broader climatic shifts, possibly influenced by regional climate initiatives aimed at managing water resources more effectively.
Regional Thermal Oscillations
The contrasting temperature trends over different time scales highlight the complex thermal oscillations in Wejh. While the all-time data points to a gradual warming, the last decade's cooling trend is noteworthy and could be reflective of regional climate variability or interventions. These oscillations are critical for understanding the broader impacts of climate change on local ecosystems and human activities.
Implications for Climate Goals
Saudi Arabia's regional climate goals, which include reducing carbon emissions and enhancing sustainability, provide a backdrop to these climatic changes. The observed trends in Wejh underscore the importance of adaptive strategies in response to both warming and cooling phases, ensuring resilience against potential climate impacts.
Station Statistics
10-Year Trend
High: -1.42 °C/decade
Low: -0.01 °C/decade
Rain: +0.02 mm/decade
25-Year Trend
High: +0.16 °C/decade
Low: +0.77 °C/decade
Rain: +0.01 mm/decade
50-Year Trend
High: +0.37 °C/decade
Low: +0.42 °C/decade
Rain: -0.00 mm/decade
All-Time Trend
High: +0.37 °C/decade
Low: +0.42 °C/decade
Rain: -0.00 mm/decade
Percentage Above-Average Days
Last 12 Months: 45.2%
This Year: 21.4%
Precipitation Concentration Index (PCI) ℹ️
Last 12 Months: 27.4
Historical Average: 52.4
Percentile Rank of Last 12 Months ℹ️
High: 48th percentile
Low: 86th percentile
Rain: 66th percentile
Change in Variance ℹ️
High: +1.6%
Low: +7.9%
Intraday: -3.0%
Data Coverage
91.4%
First Year of Data
1973
Station Location
Historical Weather Records
| Max High | Avg High | Min High | Max Avg | Avg Avg | Min Avg | Max Low | Avg Low | Min Low | Max Precipitation | Avg Precipitation | Max Snow | Avg Snow | |
|---|---|---|---|---|---|---|---|---|---|---|---|---|---|
| Record | 44.0 °C | — | 15.2 °C | 36.2 °C | — | 11.0 °C | 34.0 °C | — | 4.0 °C | 53.9 mm | — | — | — |
| January | 34.2 °C | 24.6 °C | 17.0 °C | 26.3 °C | 19.4 °C | 11.0 °C | 24.3 °C | 14.4 °C | 5.0 °C | 53.9 mm | 0.2 mm | — | — |
| February | 36.0 °C | 25.1 °C | 15.2 °C | 28.3 °C | 20.0 °C | 11.3 °C | 23.4 °C | 14.8 °C | 4.0 °C | 22.9 mm | 0.1 mm | — | — |
| March | 38.2 °C | 27.0 °C | 18.2 °C | 30.6 °C | 22.1 °C | 14.6 °C | 26.6 °C | 17.0 °C | 9.0 °C | 11.3 mm | 0.1 mm | — | — |
| April | 41.8 °C | 29.6 °C | 23.0 °C | 32.6 °C | 24.9 °C | 18.6 °C | 28.2 °C | 20.0 °C | 9.3 °C | 4.1 mm | 0.0 mm | — | — |
| May | 44.0 °C | 31.9 °C | 24.7 °C | 34.9 °C | 27.5 °C | 22.2 °C | 30.8 °C | 22.8 °C | 12.1 °C | 1.9 mm | 0.0 mm | — | — |
| June | 43.3 °C | 32.9 °C | 27.4 °C | 36.2 °C | 28.8 °C | 22.0 °C | 31.0 °C | 24.2 °C | 19.0 °C | 0.3 mm | 0.0 mm | — | — |
| July | 42.0 °C | 34.0 °C | 29.2 °C | 34.9 °C | 30.1 °C | 25.9 °C | 30.8 °C | 25.5 °C | 21.0 °C | 0.0 mm | 0.0 mm | — | — |
| August | 41.0 °C | 34.3 °C | 29.5 °C | 35.7 °C | 30.5 °C | 26.7 °C | 34.0 °C | 26.2 °C | 21.0 °C | 0.2 mm | 0.0 mm | — | — |
| September | 41.0 °C | 33.1 °C | 28.6 °C | 35.3 °C | 29.1 °C | 23.6 °C | 31.2 °C | 24.7 °C | 17.5 °C | 7.3 mm | 0.0 mm | — | — |
| October | 40.0 °C | 32.0 °C | 25.4 °C | 33.6 °C | 27.5 °C | 22.3 °C | 29.2 °C | 22.7 °C | 11.4 °C | 4.2 mm | 0.0 mm | — | — |
| November | 40.0 °C | 29.6 °C | 22.0 °C | 29.9 °C | 24.4 °C | 17.6 °C | 27.4 °C | 19.3 °C | 10.0 °C | 39.2 mm | 0.2 mm | — | — |
| December | 36.0 °C | 26.4 °C | 17.0 °C | 27.1 °C | 21.1 °C | 14.5 °C | 25.8 °C | 16.1 °C | 5.5 °C | 43.3 mm | 0.2 mm | — | — |
Data Visualisations
Remove WatermarksCurrent Year Climate Trends vs Historical


Max Temperature this Year | 1 of 6
Climate 12-Month Moving Averages
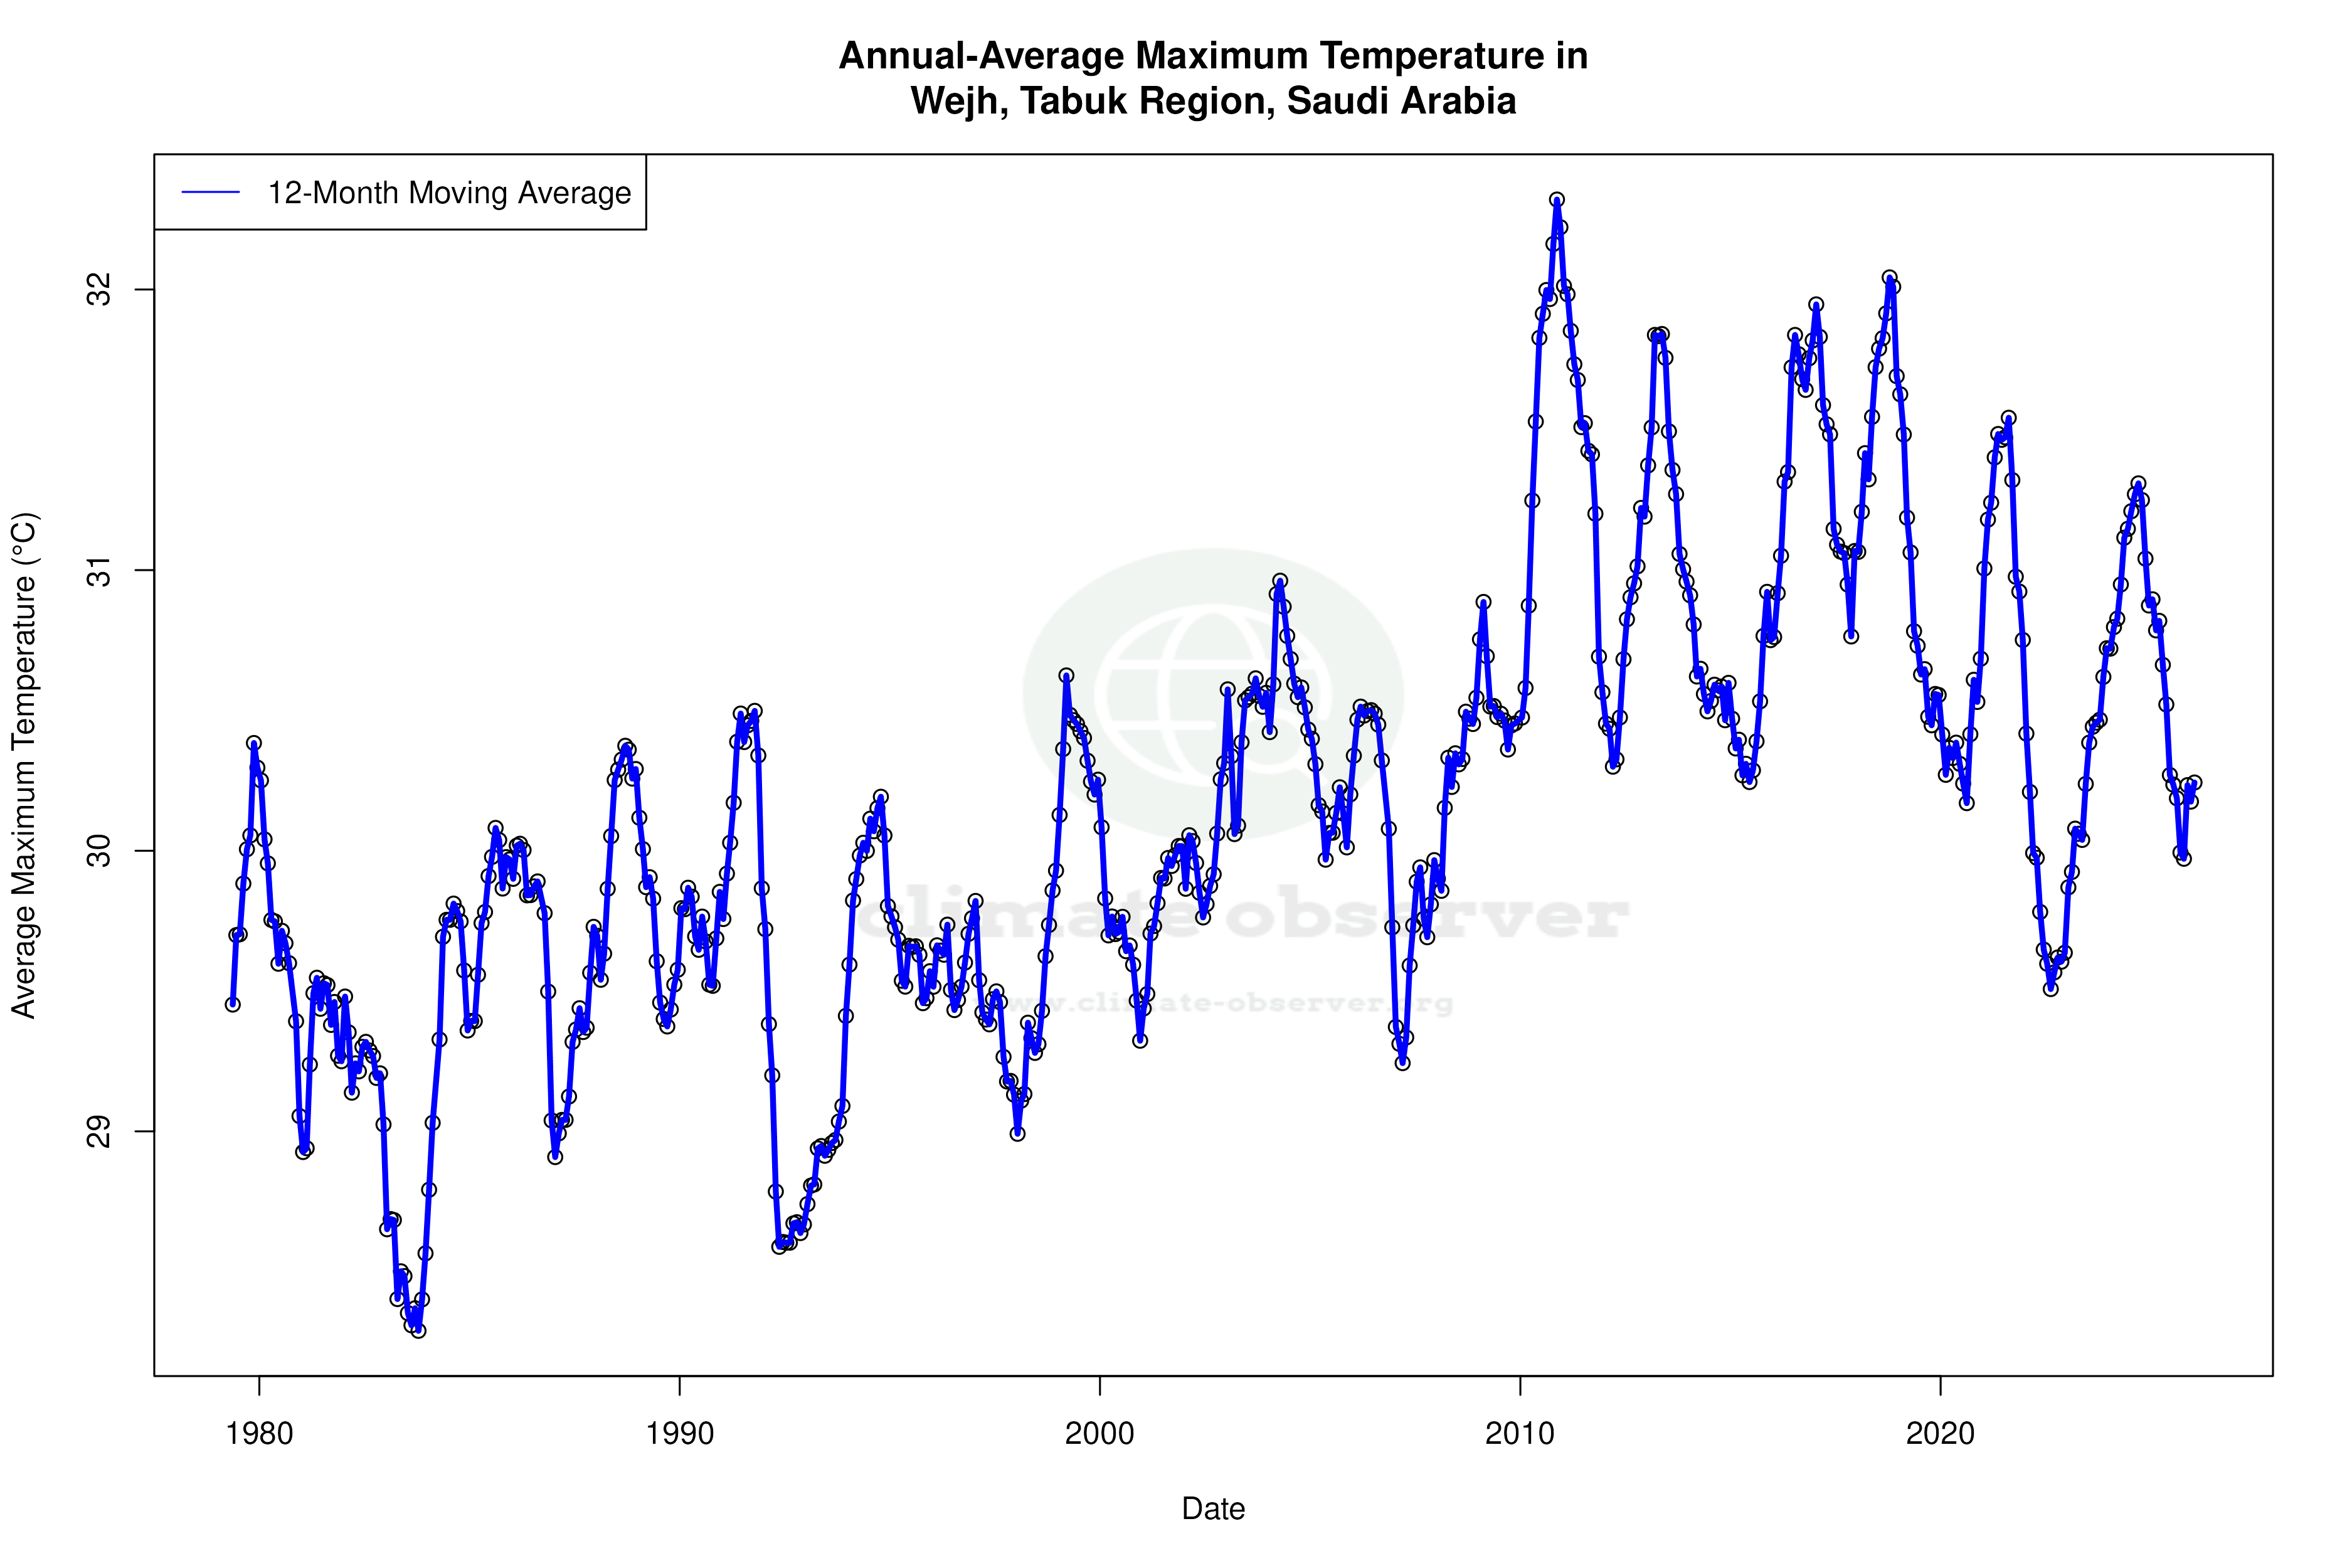


Max Temperature 12-Month MA | 1 of 6
Daily Data Points and Averages Throughout the Year


Average Max Temperature Throughout Year | 1 of 5
