Climate for Station: Al Baha, Al Baha Region, Saudi Arabia
Loading live weather...
Climate Analysis & Overview
Al Baha's climate is experiencing a warming trend, with significant increases in both high and low temperatures over the past decade. Precipitation patterns have become more evenly distributed, indicating a shift in local weather dynamics. These changes align with Saudi Arabia's broader climate goals of understanding and adapting to regional climate variability.
Warming Trends in Al Baha
Al Baha, located in the mountainous region of southwestern Saudi Arabia, is characterised by a semi-arid climate according to the Köppen classification. The local geography, with its elevated terrain, influences temperature and precipitation patterns. Over the past decade, Al Baha has experienced a noticeable warming trend. The 10-year data reveals an increase in high temperatures by 0.54°C (0.97°F) and low temperatures by 1.29°C (2.33°F). These trends are more pronounced than the all-time increases of 0.09°C (0.16°F) for highs and 0.53°C (0.95°F) for lows, suggesting an acceleration in temperature changes in recent years. This warming aligns with Saudi Arabia's climate goals of monitoring and understanding regional climate shifts.
Temperature Extremes and Records
Al Baha's climate extremes are marked by a record high of 43.2°C (109.8°F) and a record low of -2.4°C (27.7°F). These absolute values highlight the region's potential for both intense heat and rare cold snaps, influenced by its unique topography. The warming trends observed in the data may lead to more frequent occurrences of such extreme temperatures, posing challenges for local agriculture and water resources management.
Shifts in Precipitation Patterns
The Precipitation Concentration Index (PCI) provides insight into how rainfall is distributed throughout the year. Al Baha's PCI has decreased from a baseline of 34.7 to a current value of 20.6, indicating a significant shift towards more evenly distributed precipitation events. This change suggests that rainfall is becoming less concentrated in intense, short-lived events and more spread out over time. Such a trend could mitigate the risk of flash flooding and improve water availability for agriculture, aligning with regional efforts to adapt to changing climatic conditions.
Regional Climate Dynamics and Adaptation
The observed climatic changes in Al Baha are part of broader regional dynamics, influenced by both natural variability and anthropogenic factors. Saudi Arabia's commitment to understanding these shifts is crucial for developing adaptive strategies. Recent weather events, such as unusual rainfall patterns and temperature fluctuations, underscore the importance of ongoing climate monitoring. As Al Baha continues to experience warming and changes in precipitation distribution, local adaptation measures will be essential to ensure sustainable development and resilience against climate impacts.
Station Statistics
10-Year Trend
High: +0.21 °C/decade
Low: +0.86 °C/decade
Rain: +0.09 mm/decade
25-Year Trend
High: +0.15 °C/decade
Low: +0.90 °C/decade
Rain: +0.02 mm/decade
50-Year Trend
High: +0.12 °C/decade
Low: +0.54 °C/decade
Rain: -0.01 mm/decade
All-Time Trend
High: +0.12 °C/decade
Low: +0.54 °C/decade
Rain: -0.01 mm/decade
Percentage Above-Average Days
Last 12 Months: 53.7%
This Year: 73.7%
Precipitation Concentration Index (PCI) ℹ️
Last 12 Months: 20.4
Historical Average: 34.6
Percentile Rank of Last 12 Months ℹ️
High: 82nd percentile
Low: 94th percentile
Rain: 60th percentile
Change in Variance ℹ️
High: -8.5%
Low: -0.8%
Intraday: -38.0%
Data Coverage
100.0%
First Year of Data
1981
Station Location
Historical Weather Records
| Max High | Avg High | Min High | Max Avg | Avg Avg | Min Avg | Max Low | Avg Low | Min Low | Max Precipitation | Avg Precipitation | Max Snow | Avg Snow | |
|---|---|---|---|---|---|---|---|---|---|---|---|---|---|
| Record | 43.2 °C | — | 11.0 °C | 35.7 °C | — | 3.7 °C | 30.0 °C | — | -2.4 °C | 60.0 mm | — | — | — |
| January | 30.8 °C | 23.3 °C | 11.0 °C | 23.7 °C | 16.4 °C | 3.7 °C | 17.9 °C | 10.0 °C | -2.4 °C | 39.5 mm | 0.2 mm | — | — |
| February | 32.5 °C | 25.1 °C | 12.7 °C | 25.1 °C | 18.1 °C | 7.6 °C | 19.0 °C | 11.6 °C | 0.2 °C | 16.3 mm | 0.1 mm | — | — |
| March | 37.5 °C | 27.4 °C | 15.2 °C | 26.7 °C | 20.6 °C | 11.5 °C | 21.0 °C | 14.2 °C | 4.0 °C | 17.9 mm | 0.2 mm | — | — |
| April | 37.3 °C | 29.8 °C | 16.0 °C | 31.2 °C | 23.1 °C | 12.1 °C | 23.0 °C | 16.9 °C | 8.0 °C | 28.4 mm | 0.5 mm | — | — |
| May | 39.5 °C | 33.1 °C | 22.3 °C | 34.0 °C | 26.5 °C | 17.3 °C | 25.4 °C | 20.1 °C | 9.2 °C | 26.9 mm | 0.4 mm | — | — |
| June | 41.1 °C | 35.7 °C | 28.8 °C | 35.4 °C | 29.5 °C | 23.0 °C | 27.7 °C | 22.7 °C | 15.8 °C | 21.2 mm | 0.1 mm | — | — |
| July | 43.2 °C | 35.8 °C | 28.7 °C | 35.7 °C | 29.6 °C | 22.8 °C | 30.0 °C | 23.1 °C | 15.8 °C | 14.8 mm | 0.1 mm | — | — |
| August | 40.5 °C | 35.8 °C | 26.9 °C | 34.8 °C | 29.5 °C | 23.7 °C | 27.8 °C | 23.0 °C | 16.2 °C | 17.9 mm | 0.2 mm | — | — |
| September | 39.1 °C | 34.0 °C | 29.0 °C | 33.9 °C | 28.0 °C | 22.3 °C | 27.7 °C | 21.5 °C | 15.3 °C | 7.0 mm | 0.0 mm | — | — |
| October | 35.0 °C | 29.7 °C | 21.3 °C | 30.1 °C | 23.6 °C | 16.1 °C | 24.0 °C | 16.9 °C | 8.5 °C | 19.3 mm | 0.1 mm | — | — |
| November | 34.0 °C | 26.3 °C | 17.0 °C | 26.2 °C | 19.8 °C | 10.5 °C | 18.8 °C | 13.2 °C | 5.0 °C | 9.5 mm | 0.1 mm | — | — |
| December | 29.6 °C | 24.0 °C | 12.2 °C | 24.1 °C | 17.2 °C | 7.3 °C | 17.0 °C | 10.6 °C | 2.0 °C | 60.0 mm | 0.1 mm | — | — |
Data Visualisations
Remove WatermarksCurrent Year Climate Trends vs Historical
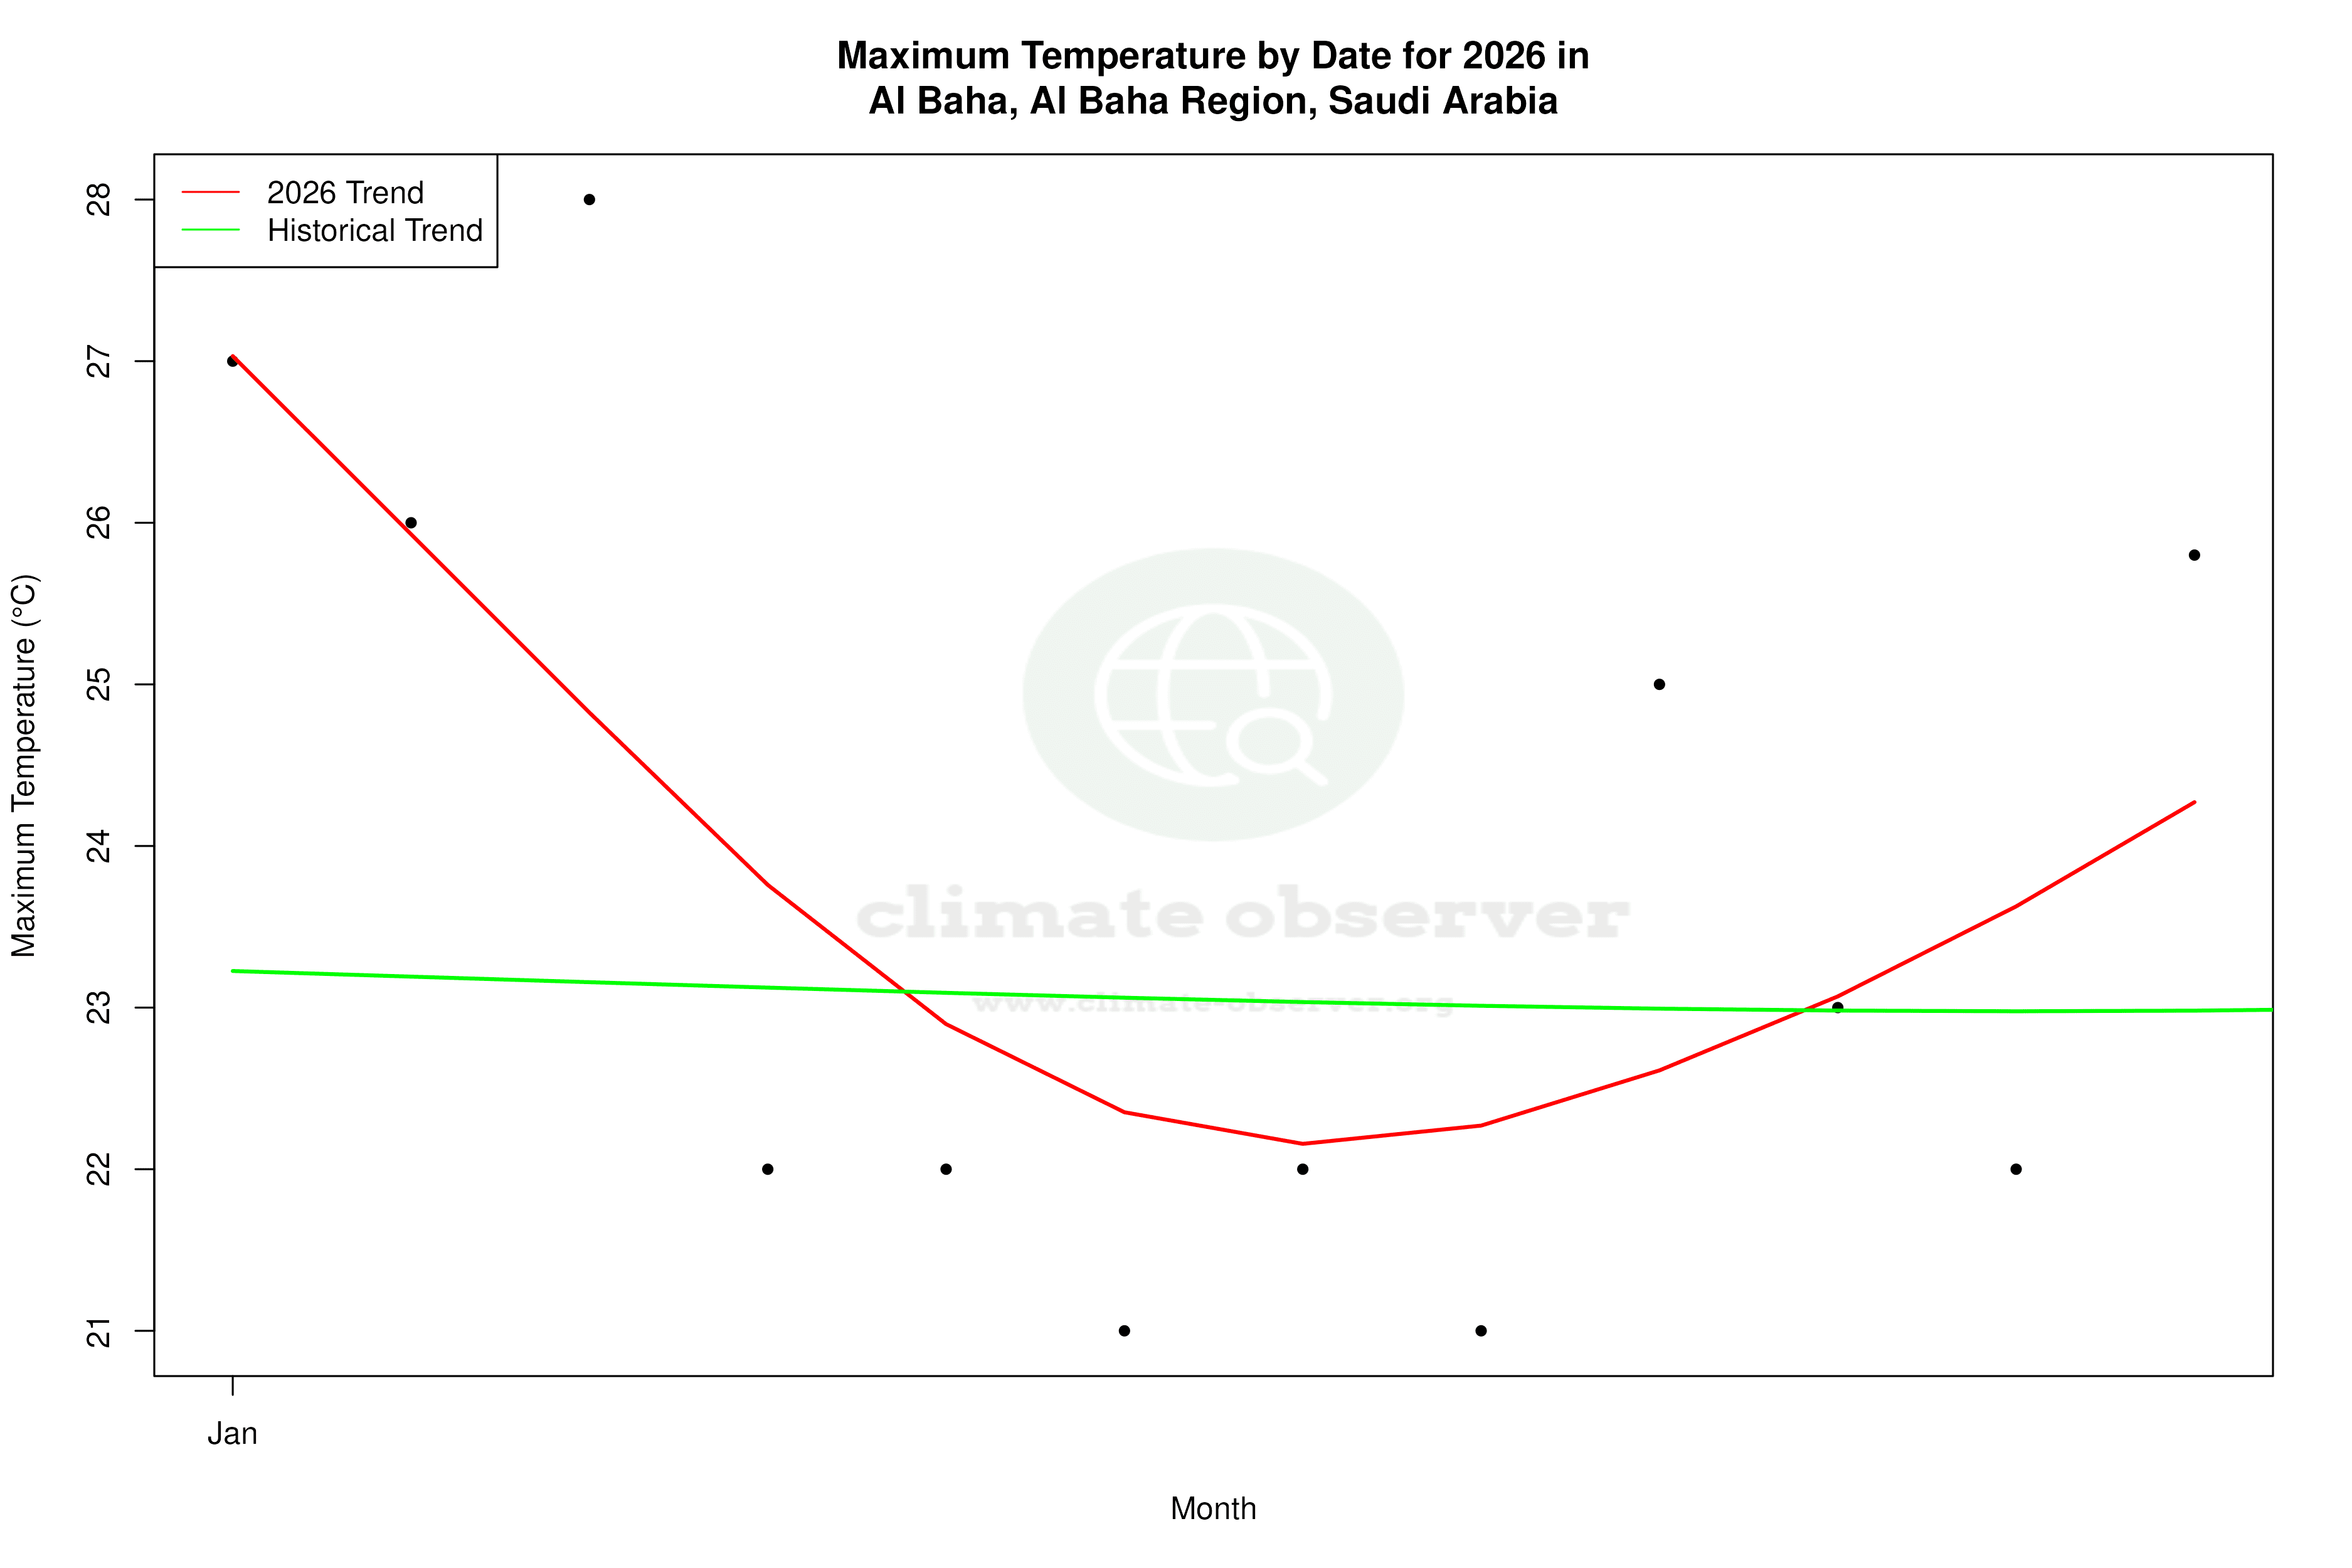


Max Temperature this Year | 1 of 6
Climate 12-Month Moving Averages


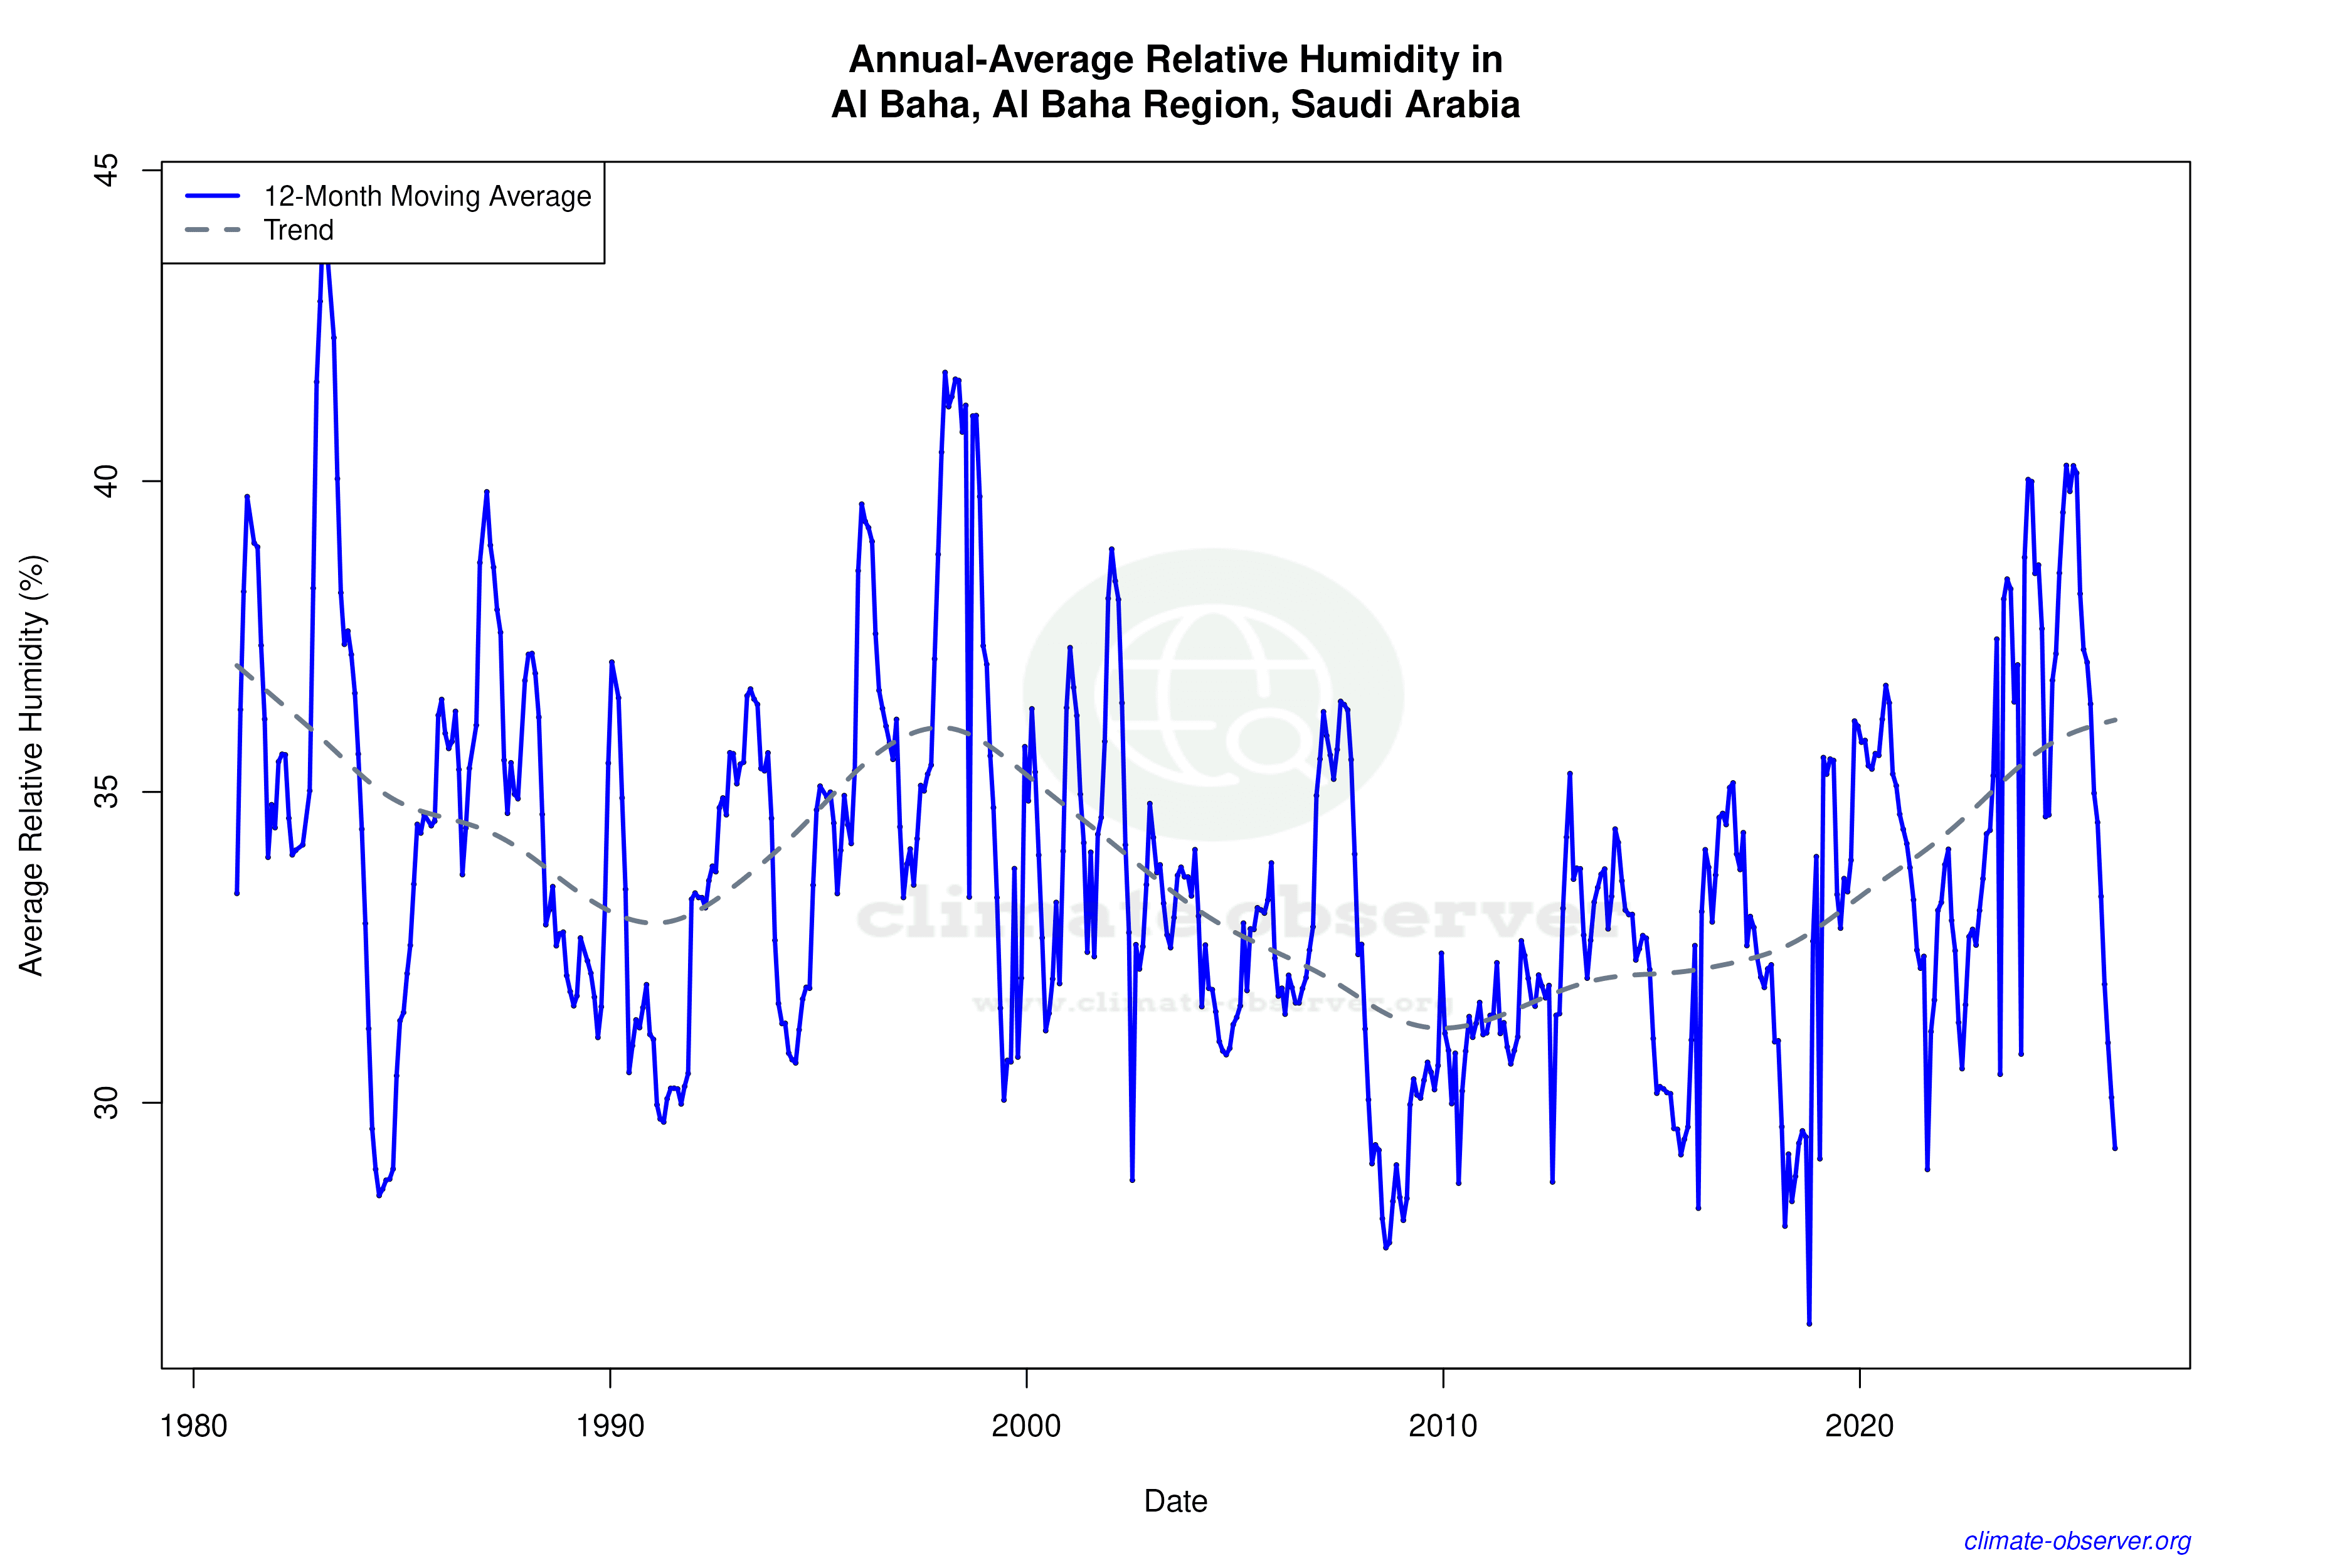

Max Temperature 12-Month MA | 1 of 6
Daily Data Points and Averages Throughout the Year


Average Max Temperature Throughout Year | 1 of 5
