Climate for Station: Abha, Asir Region, Saudi Arabia
Loading live weather...
Climate Analysis & Overview
Abha's climate is characterised by a juxtaposition of cooling trends in the short term against a backdrop of long-term warming, with increasingly concentrated precipitation events. This complex climate narrative is influenced by the unique geography of the Asir region and aligns with broader regional climate goals.
Geographical Influence and Climate Classification
Abha, located at 18.24°N, 42.657°E, is nestled in the Asir region of Saudi Arabia, known for its mountainous terrain. This geography contributes to its Köppen climate classification as a hot desert climate (BWh), albeit with cooler temperatures than typical desert regions due to elevation. The local topography plays a crucial role in moderating temperatures and influencing precipitation patterns, making Abha a unique case study in the broader context of Saudi Arabia's climate.
Temperature Trends: A Tale of Two Directions
In the past decade, Abha has experienced a cooling trend with high temperatures decreasing by 1.12°C (2.02°F) and low temperatures by 0.09°C (0.16°F). However, when examining the all-time data, a different narrative emerges. The long-term trend indicates a warming with highs increasing by 0.11°C (0.20°F) and lows by 0.27°C (0.49°F). This divergence in short-term and long-term trends highlights the complexity of Abha's climate, where recent cooling contrasts with an overall warming trend over a longer period.
Precipitation Patterns: Increasing Concentration
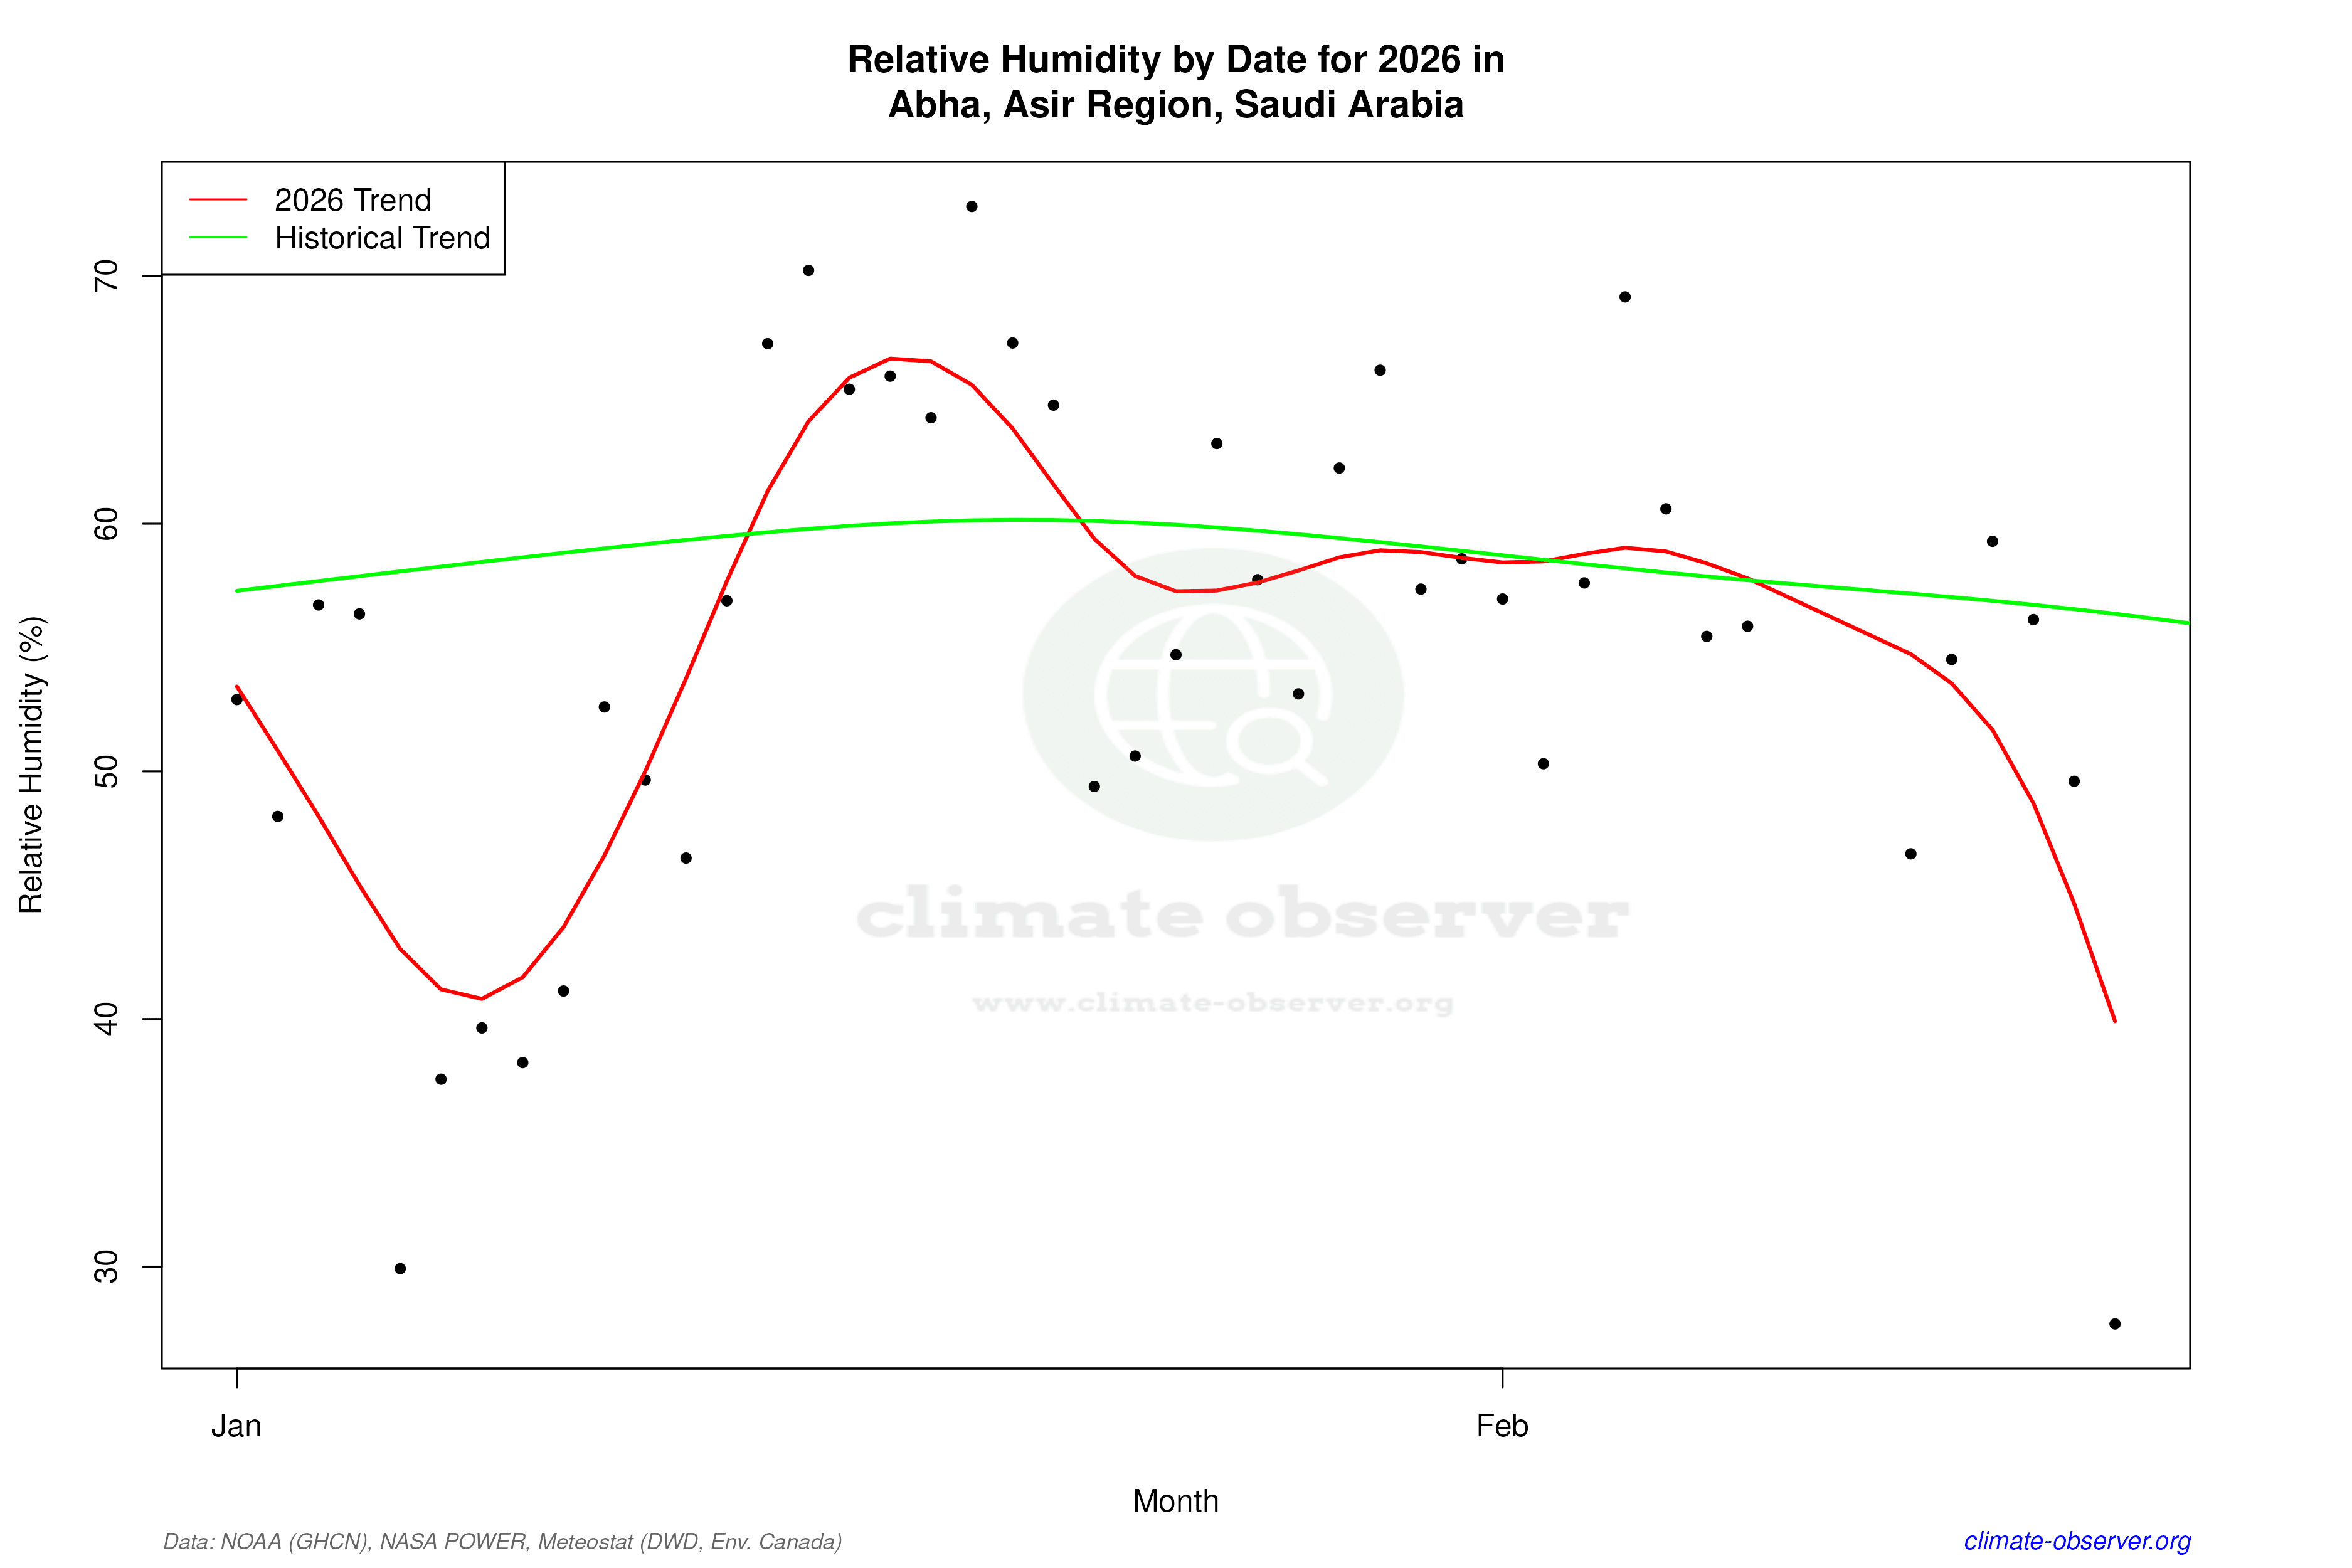
The Precipitation Concentration Index (PCI) for Abha has shown a significant increase from a baseline of 30.0 to a current value of 43.4. PCI measures how precipitation is distributed over time, and a higher PCI indicates that rainfall is becoming more concentrated in fewer, more intense events. This shift suggests a trend towards less frequent but more intense rainfall, which can have implications for water management and agricultural practices in the region.
Record Extremes: A Snapshot of Variability
Abha's climate extremes further illustrate its variability. The record high temperature stands at 39.23°C (102.61°F), while the record low is -1.6°C (29.12°F). These extremes underscore the range of conditions that can occur in this region, influenced by its elevation and desert climate.
Regional Climate Goals and Implications
Saudi Arabia's climate goals aim to address the challenges of desertification and water scarcity, with Abha serving as a microcosm of these broader issues. The trends observed in Abha, particularly the increasing concentration of precipitation, align with regional efforts to adapt to changing climate patterns. The data from Abha not only informs local strategies but also contributes to the national dialogue on sustainable development and climate resilience.
Station Statistics
10-Year Trend
High: -0.72 °C/decade
Low: +0.39 °C/decade
Rain: +0.20 mm/decade
25-Year Trend
High: +0.11 °C/decade
Low: +0.74 °C/decade
Rain: +0.23 mm/decade
50-Year Trend
High: +0.12 °C/decade
Low: +0.30 °C/decade
Rain: +0.04 mm/decade
All-Time Trend
High: +0.12 °C/decade
Low: +0.30 °C/decade
Rain: +0.04 mm/decade
Percentage Above-Average Days
Last 12 Months: 60.3%
This Year: 84.5%
Precipitation Concentration Index (PCI) ℹ️
Last 12 Months: 24.1
Historical Average: 30.5
Percentile Rank of Last 12 Months ℹ️
High: 86th percentile
Low: 95th percentile
Rain: 89th percentile
Change in Variance ℹ️
High: +7.7%
Low: -4.1%
Intraday: -24.9%
Data Coverage
100.0%
First Year of Data
1981
Station Location
Historical Weather Records
| Max High | Avg High | Min High | Max Avg | Avg Avg | Min Avg | Max Low | Avg Low | Min Low | Max Precipitation | Avg Precipitation | Max Snow | Avg Snow | |
|---|---|---|---|---|---|---|---|---|---|---|---|---|---|
| Record | 39.9 °C | — | 10.2 °C | 32.3 °C | — | 6.8 °C | 26.3 °C | — | -1.6 °C | 80.1 mm | — | — | — |
| January | 29.6 °C | 20.4 °C | 10.2 °C | 22.5 °C | 13.9 °C | 7.9 °C | 18.0 °C | 8.5 °C | 0.0 °C | 24.4 mm | 0.2 mm | — | — |
| February | 33.0 °C | 21.8 °C | 11.8 °C | 24.2 °C | 15.4 °C | 6.8 °C | 19.2 °C | 10.1 °C | -0.8 °C | 44.6 mm | 0.3 mm | — | — |
| March | 34.3 °C | 23.6 °C | 12.0 °C | 25.9 °C | 17.4 °C | 9.6 °C | 21.0 °C | 12.1 °C | 1.0 °C | 80.1 mm | 0.5 mm | — | — |
| April | 35.0 °C | 26.0 °C | 13.0 °C | 27.9 °C | 19.4 °C | 11.0 °C | 23.3 °C | 13.8 °C | 6.5 °C | 63.3 mm | 0.7 mm | — | — |
| May | 39.9 °C | 29.2 °C | 19.2 °C | 32.3 °C | 22.0 °C | 14.3 °C | 25.8 °C | 15.9 °C | 9.3 °C | 39.7 mm | 0.4 mm | — | — |
| June | 39.3 °C | 31.7 °C | 24.3 °C | 31.5 °C | 24.3 °C | 18.0 °C | 26.3 °C | 17.7 °C | 10.1 °C | 7.8 mm | 0.1 mm | — | — |
| July | 38.3 °C | 31.3 °C | 23.2 °C | 31.2 °C | 24.0 °C | 17.7 °C | 26.3 °C | 18.2 °C | 9.3 °C | 30.0 mm | 0.4 mm | — | — |
| August | 37.7 °C | 30.8 °C | 22.5 °C | 29.9 °C | 23.2 °C | 17.1 °C | 25.4 °C | 17.5 °C | 10.0 °C | 51.1 mm | 0.7 mm | — | — |
| September | 37.4 °C | 30.1 °C | 24.8 °C | 29.6 °C | 22.7 °C | 16.8 °C | 24.9 °C | 15.9 °C | 9.0 °C | 13.7 mm | 0.1 mm | — | — |
| October | 35.8 °C | 26.5 °C | 17.0 °C | 27.4 °C | 19.2 °C | 13.1 °C | 21.3 °C | 12.6 °C | 3.8 °C | 8.3 mm | 0.1 mm | — | — |
| November | 30.8 °C | 23.4 °C | 14.5 °C | 23.2 °C | 16.3 °C | 9.9 °C | 19.6 °C | 10.0 °C | 2.4 °C | 14.5 mm | 0.1 mm | — | — |
| December | 29.4 °C | 21.3 °C | 13.2 °C | 21.6 °C | 14.4 °C | 8.9 °C | 17.4 °C | 8.1 °C | -1.6 °C | 13.4 mm | 0.1 mm | — | — |
Data Visualisations
Remove WatermarksCurrent Year Climate Trends vs Historical


Max Temperature this Year | 1 of 6
Climate 12-Month Moving Averages


Max Temperature 12-Month MA | 1 of 6
Daily Data Points and Averages Throughout the Year


Average Max Temperature Throughout Year | 1 of 5
