Climate for Station: Dhahran, Eastern Province, Saudi Arabia
Loading live weather...
Climate Analysis & Overview
Dhahran's climate is characterised by a long-term warming trend, particularly in high temperatures, while recent years show a cooling of highs. This is coupled with a more concentrated pattern of precipitation, posing challenges and opportunities for regional climate adaptation strategies.
Desert Climate Dynamics
Dhahran, situated at coordinates 26.2833, 50.15, is entrenched in a desert climate, classified under the Köppen system as BWh. This classification is typical for regions with extremely hot summers and minimal precipitation. The city's proximity to the Arabian Gulf influences its climate, though the vast desert landscape dominates, leading to high temperature variability and low humidity levels.
Temperature Trends: A Dual Narrative
Over the long term, Dhahran has experienced a warming trend, with all-time high temperatures rising by 0.32°C (0.58°F). However, the past decade presents a contrasting narrative, with a slight cooling trend in high temperatures, decreasing by 0.01°C (0.02°F). In contrast, low temperatures have risen significantly by 0.37°C (0.67°F) over the same period, indicating an increase in nighttime warmth. This dual narrative suggests a complex climate system influenced by both regional and global factors.
Precipitation Patterns: Concentration Over Distribution
The Precipitation Concentration Index (PCI) for Dhahran has shown a marginal increase from a baseline of 44.8 to a current value of 45.8. The PCI measures how rainfall is distributed throughout the year, with higher values indicating more concentrated rainfall events. This increase suggests that precipitation is becoming more concentrated in fewer, potentially more intense events, which could impact water management and flood risk strategies in the region.
Extremes and Records: The Heat of Dhahran
Dhahran has recorded extreme temperatures, with an all-time high of 51.0°C (123.8°F) and a low of 1.0°C (33.8°F). These extremes highlight the city's capacity for both intense heat and rare cold spells, underscoring the need for robust infrastructure and adaptive strategies to mitigate the impacts of such temperature fluctuations.
Regional Climate Goals and Adaptation
Saudi Arabia's climate goals focus on sustainable development and resilience against climate change impacts. Dhahran's warming trends, particularly in low temperatures, align with broader regional patterns that necessitate adaptive measures. Recent weather events, such as intense heatwaves and sporadic heavy rainfall, further emphasize the importance of integrating climate data into urban planning and policy-making to enhance resilience and sustainability in the face of evolving climatic conditions.
Station Statistics
10-Year Trend
High: -0.03 °C/decade
Low: +0.22 °C/decade
Rain: +0.11 mm/decade
25-Year Trend
High: -0.13 °C/decade
Low: +0.85 °C/decade
Rain: +0.04 mm/decade
50-Year Trend
High: +0.44 °C/decade
Low: +0.54 °C/decade
Rain: -0.01 mm/decade
All-Time Trend
High: +0.32 °C/decade
Low: +0.10 °C/decade
Rain: -0.01 mm/decade
Percentage Above-Average Days
Last 12 Months: 49.0%
This Year: 40.1%
Precipitation Concentration Index (PCI) ℹ️
Last 12 Months: 33.2
Historical Average: 43.6
Percentile Rank of Last 12 Months ℹ️
High: 73rd percentile
Low: 87th percentile
Rain: 65th percentile
Change in Variance ℹ️
High: -1.3%
Low: +3.5%
Intraday: -9.0%
Data Coverage
84.5%
First Year of Data
1946
Station Location
Historical Weather Records
| Max High | Avg High | Min High | Max Avg | Avg Avg | Min Avg | Max Low | Avg Low | Min Low | Max Precipitation | Avg Precipitation | Max Snow | Avg Snow | |
|---|---|---|---|---|---|---|---|---|---|---|---|---|---|
| Record | 51.0 °C | — | 10.0 °C | 42.1 °C | — | 6.3 °C | 36.0 °C | — | 1.0 °C | 46.4 mm | — | 0.0 mm | — |
| January | 35.6 °C | 21.2 °C | 10.0 °C | 25.4 °C | 15.8 °C | 6.3 °C | 20.0 °C | 10.9 °C | 1.0 °C | 45.5 mm | 0.5 mm | 0.0 mm | 0.0 mm |
| February | 35.0 °C | 22.8 °C | 12.2 °C | 27.1 °C | 17.3 °C | 7.4 °C | 21.0 °C | 12.2 °C | 1.2 °C | 44.8 mm | 0.4 mm | 0.0 mm | 0.0 mm |
| March | 42.0 °C | 26.9 °C | 14.6 °C | 30.9 °C | 21.0 °C | 11.6 °C | 24.0 °C | 15.6 °C | 5.0 °C | 36.3 mm | 0.4 mm | 0.0 mm | 0.0 mm |
| April | 45.5 °C | 32.7 °C | 19.4 °C | 35.5 °C | 26.1 °C | 15.7 °C | 31.0 °C | 20.2 °C | 10.0 °C | 46.4 mm | 0.1 mm | 0.0 mm | 0.0 mm |
| May | 51.0 °C | 38.6 °C | 26.7 °C | 39.9 °C | 31.7 °C | 21.8 °C | 34.0 °C | 25.1 °C | 16.0 °C | 14.2 mm | 0.0 mm | 0.0 mm | 0.0 mm |
| June | 50.0 °C | 42.0 °C | 33.7 °C | 41.4 °C | 35.0 °C | 27.0 °C | 36.0 °C | 28.0 °C | 19.0 °C | 0.4 mm | 0.0 mm | 0.0 mm | 0.0 mm |
| July | 51.0 °C | 43.3 °C | 34.0 °C | 42.1 °C | 36.1 °C | 30.6 °C | 36.0 °C | 29.5 °C | 20.0 °C | 7.1 mm | 0.0 mm | 0.0 mm | 0.0 mm |
| August | 51.0 °C | 42.8 °C | 35.6 °C | 40.8 °C | 35.5 °C | 30.7 °C | 36.0 °C | 29.2 °C | 20.2 °C | 6.5 mm | 0.0 mm | 0.0 mm | 0.0 mm |
| September | 49.0 °C | 40.4 °C | 32.8 °C | 39.9 °C | 32.8 °C | 27.7 °C | 34.0 °C | 26.3 °C | 18.0 °C | 1.0 mm | 0.0 mm | 0.0 mm | 0.0 mm |
| October | 44.5 °C | 35.9 °C | 25.9 °C | 34.7 °C | 28.7 °C | 20.4 °C | 31.0 °C | 22.5 °C | 11.0 °C | 9.0 mm | 0.0 mm | 0.0 mm | 0.0 mm |
| November | 40.0 °C | 29.0 °C | 16.0 °C | 31.1 °C | 23.0 °C | 11.8 °C | 27.0 °C | 17.8 °C | 7.0 °C | 39.1 mm | 0.3 mm | 0.0 mm | 0.0 mm |
| December | 32.0 °C | 23.4 °C | 11.0 °C | 25.3 °C | 17.8 °C | 7.1 °C | 23.3 °C | 12.9 °C | 1.2 °C | 43.2 mm | 0.4 mm | 0.0 mm | 0.0 mm |
Data Visualisations
Remove WatermarksCurrent Year Climate Trends vs Historical


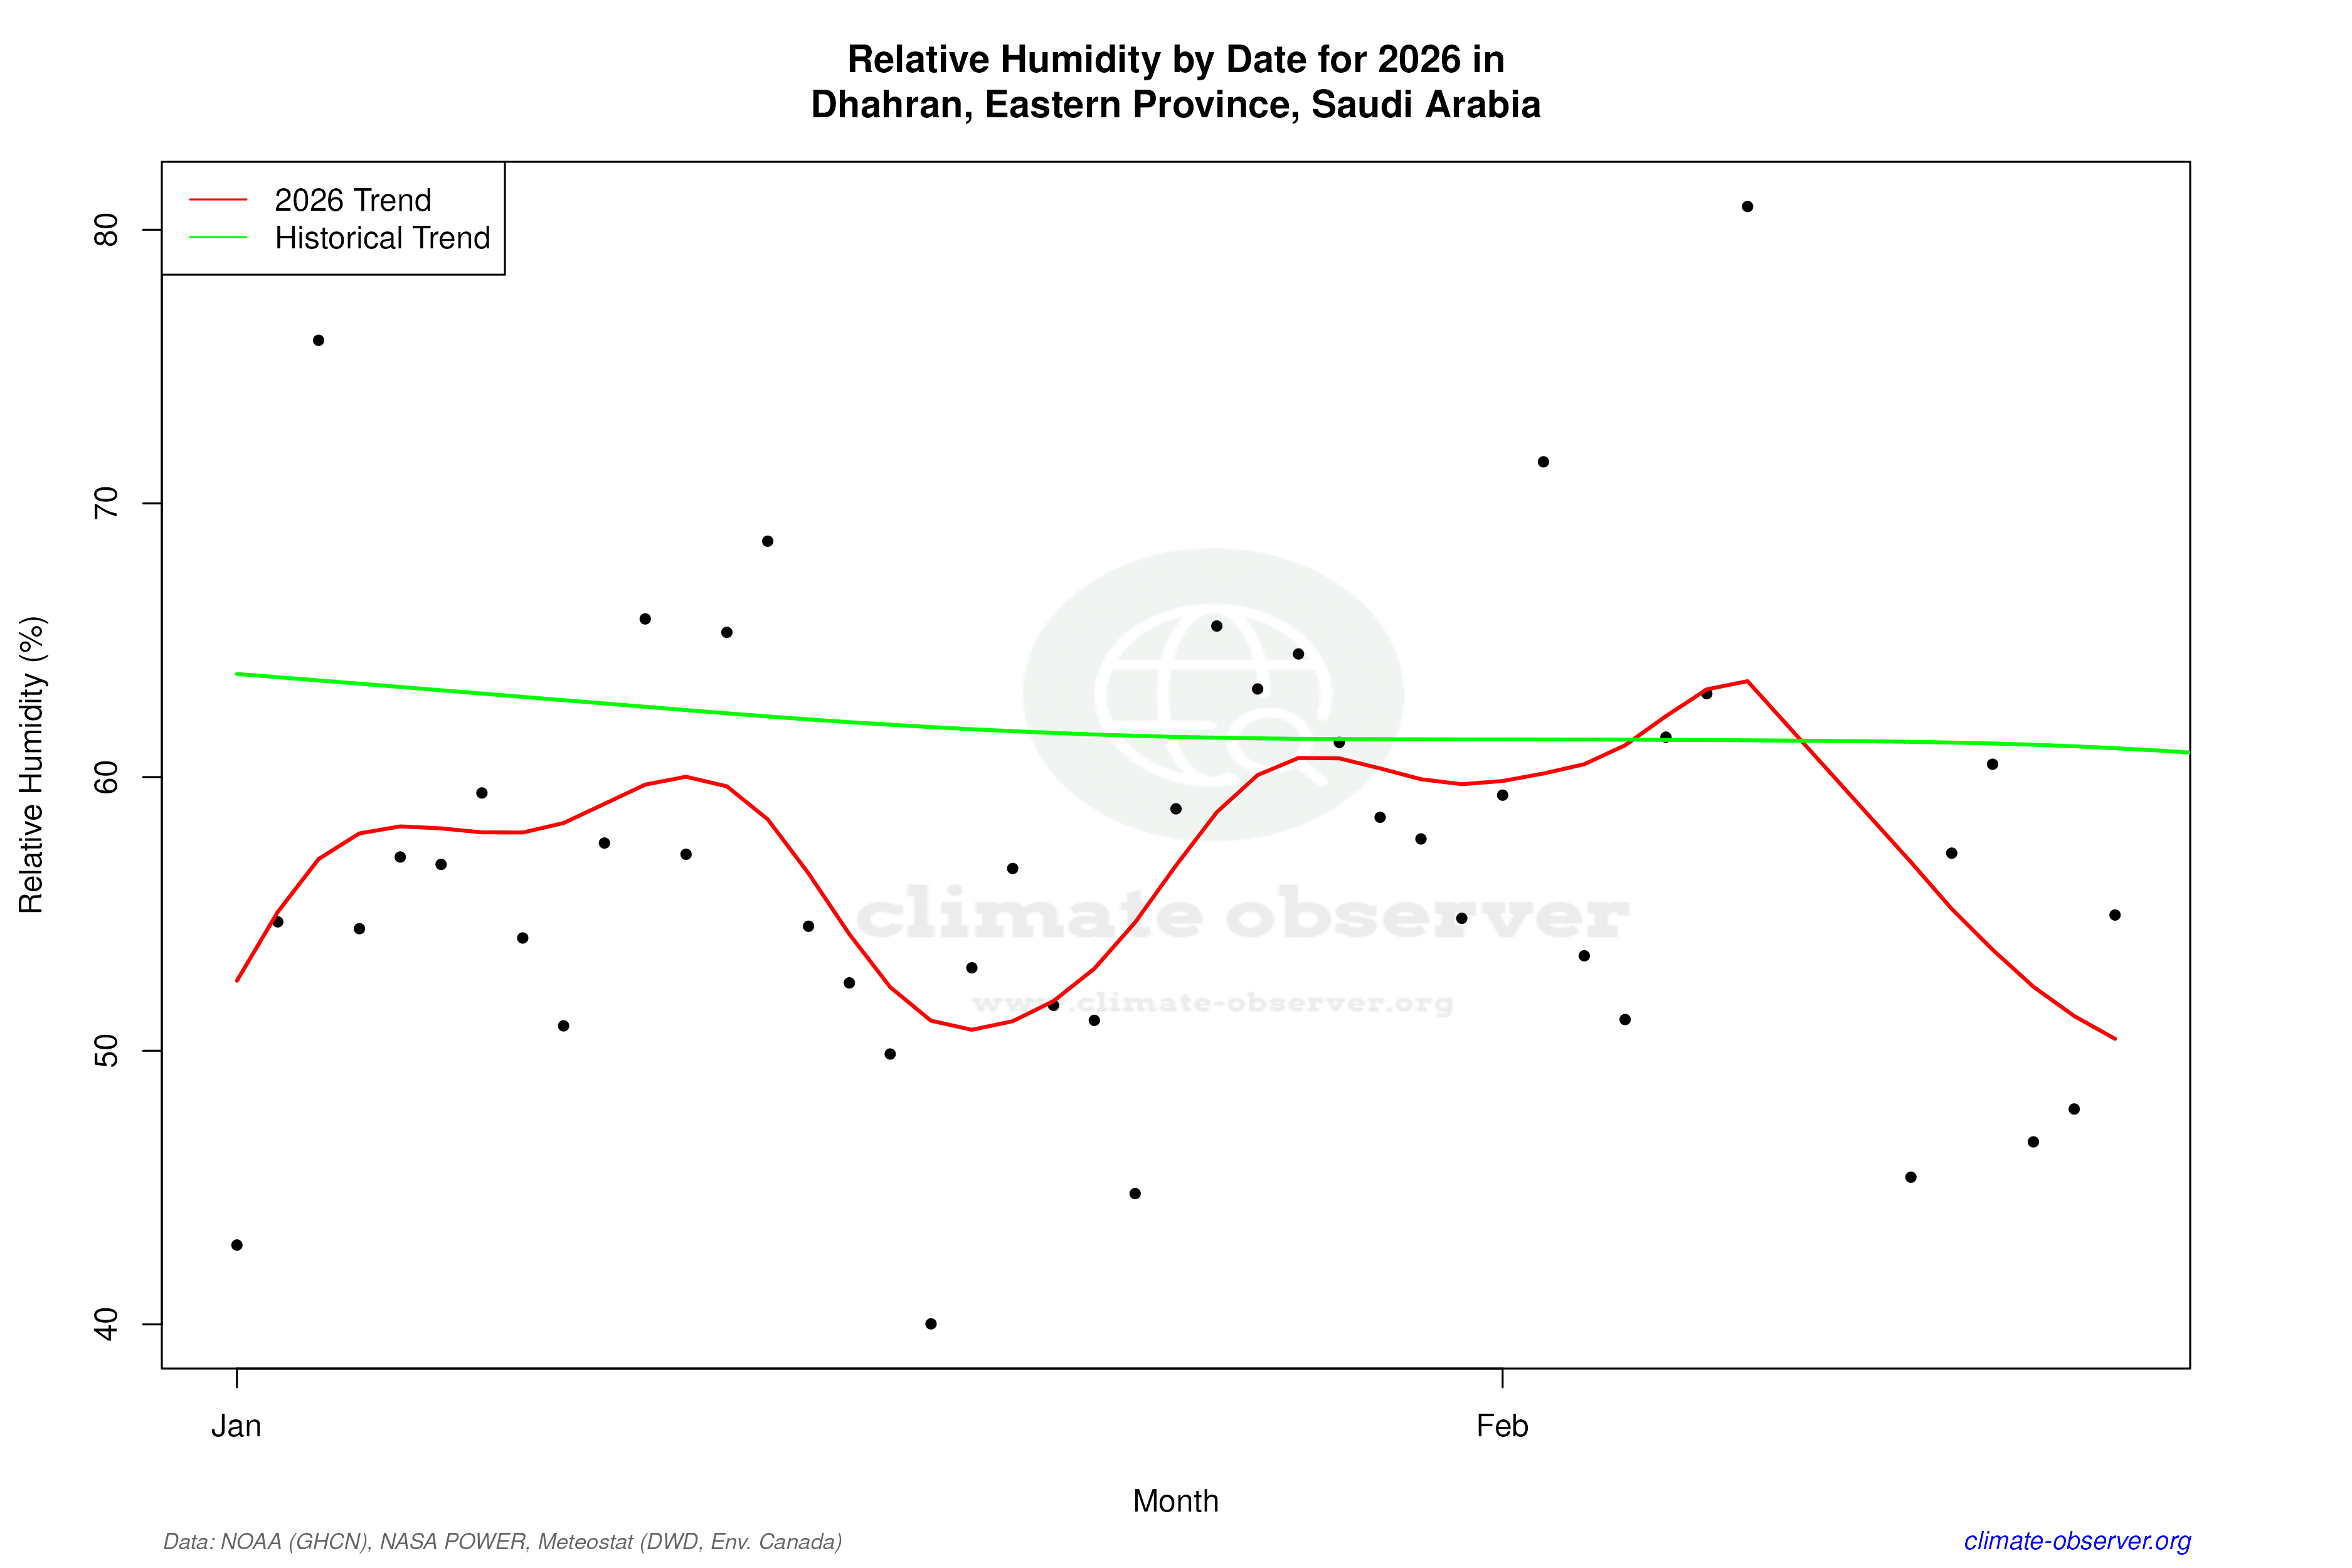

Max Temperature this Year | 1 of 6
Climate 12-Month Moving Averages


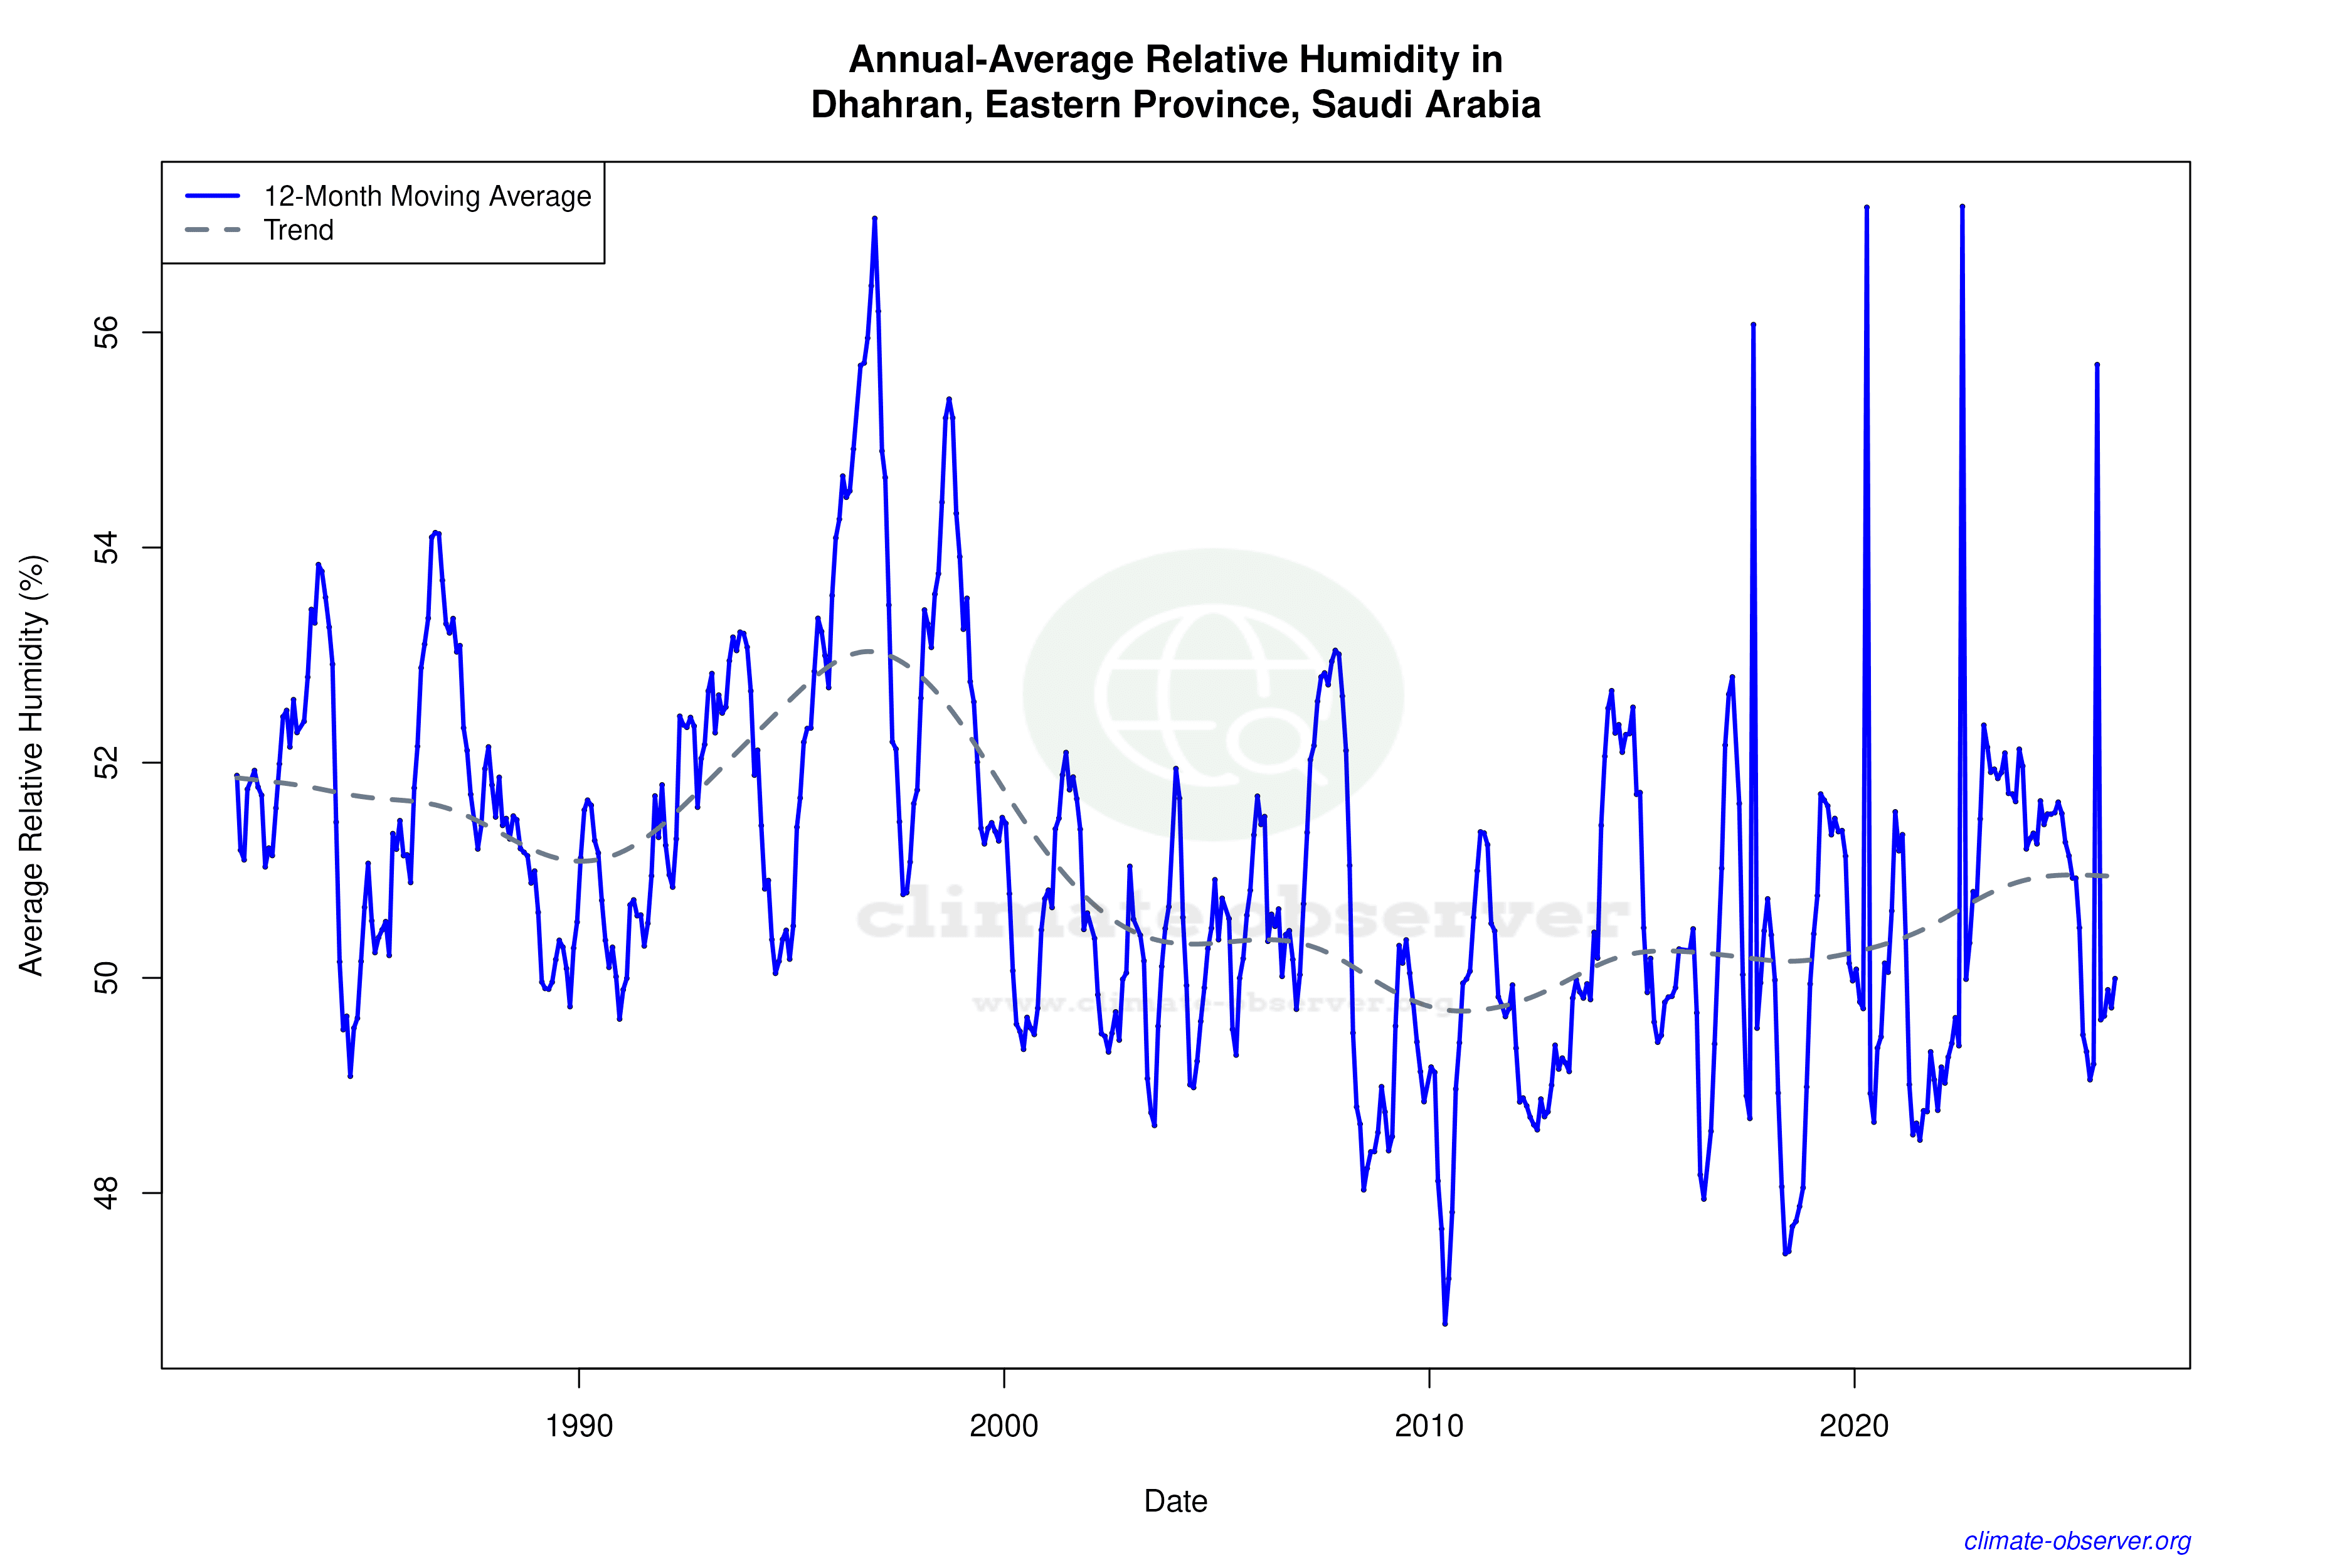

Max Temperature 12-Month MA | 1 of 6
Daily Data Points and Averages Throughout the Year


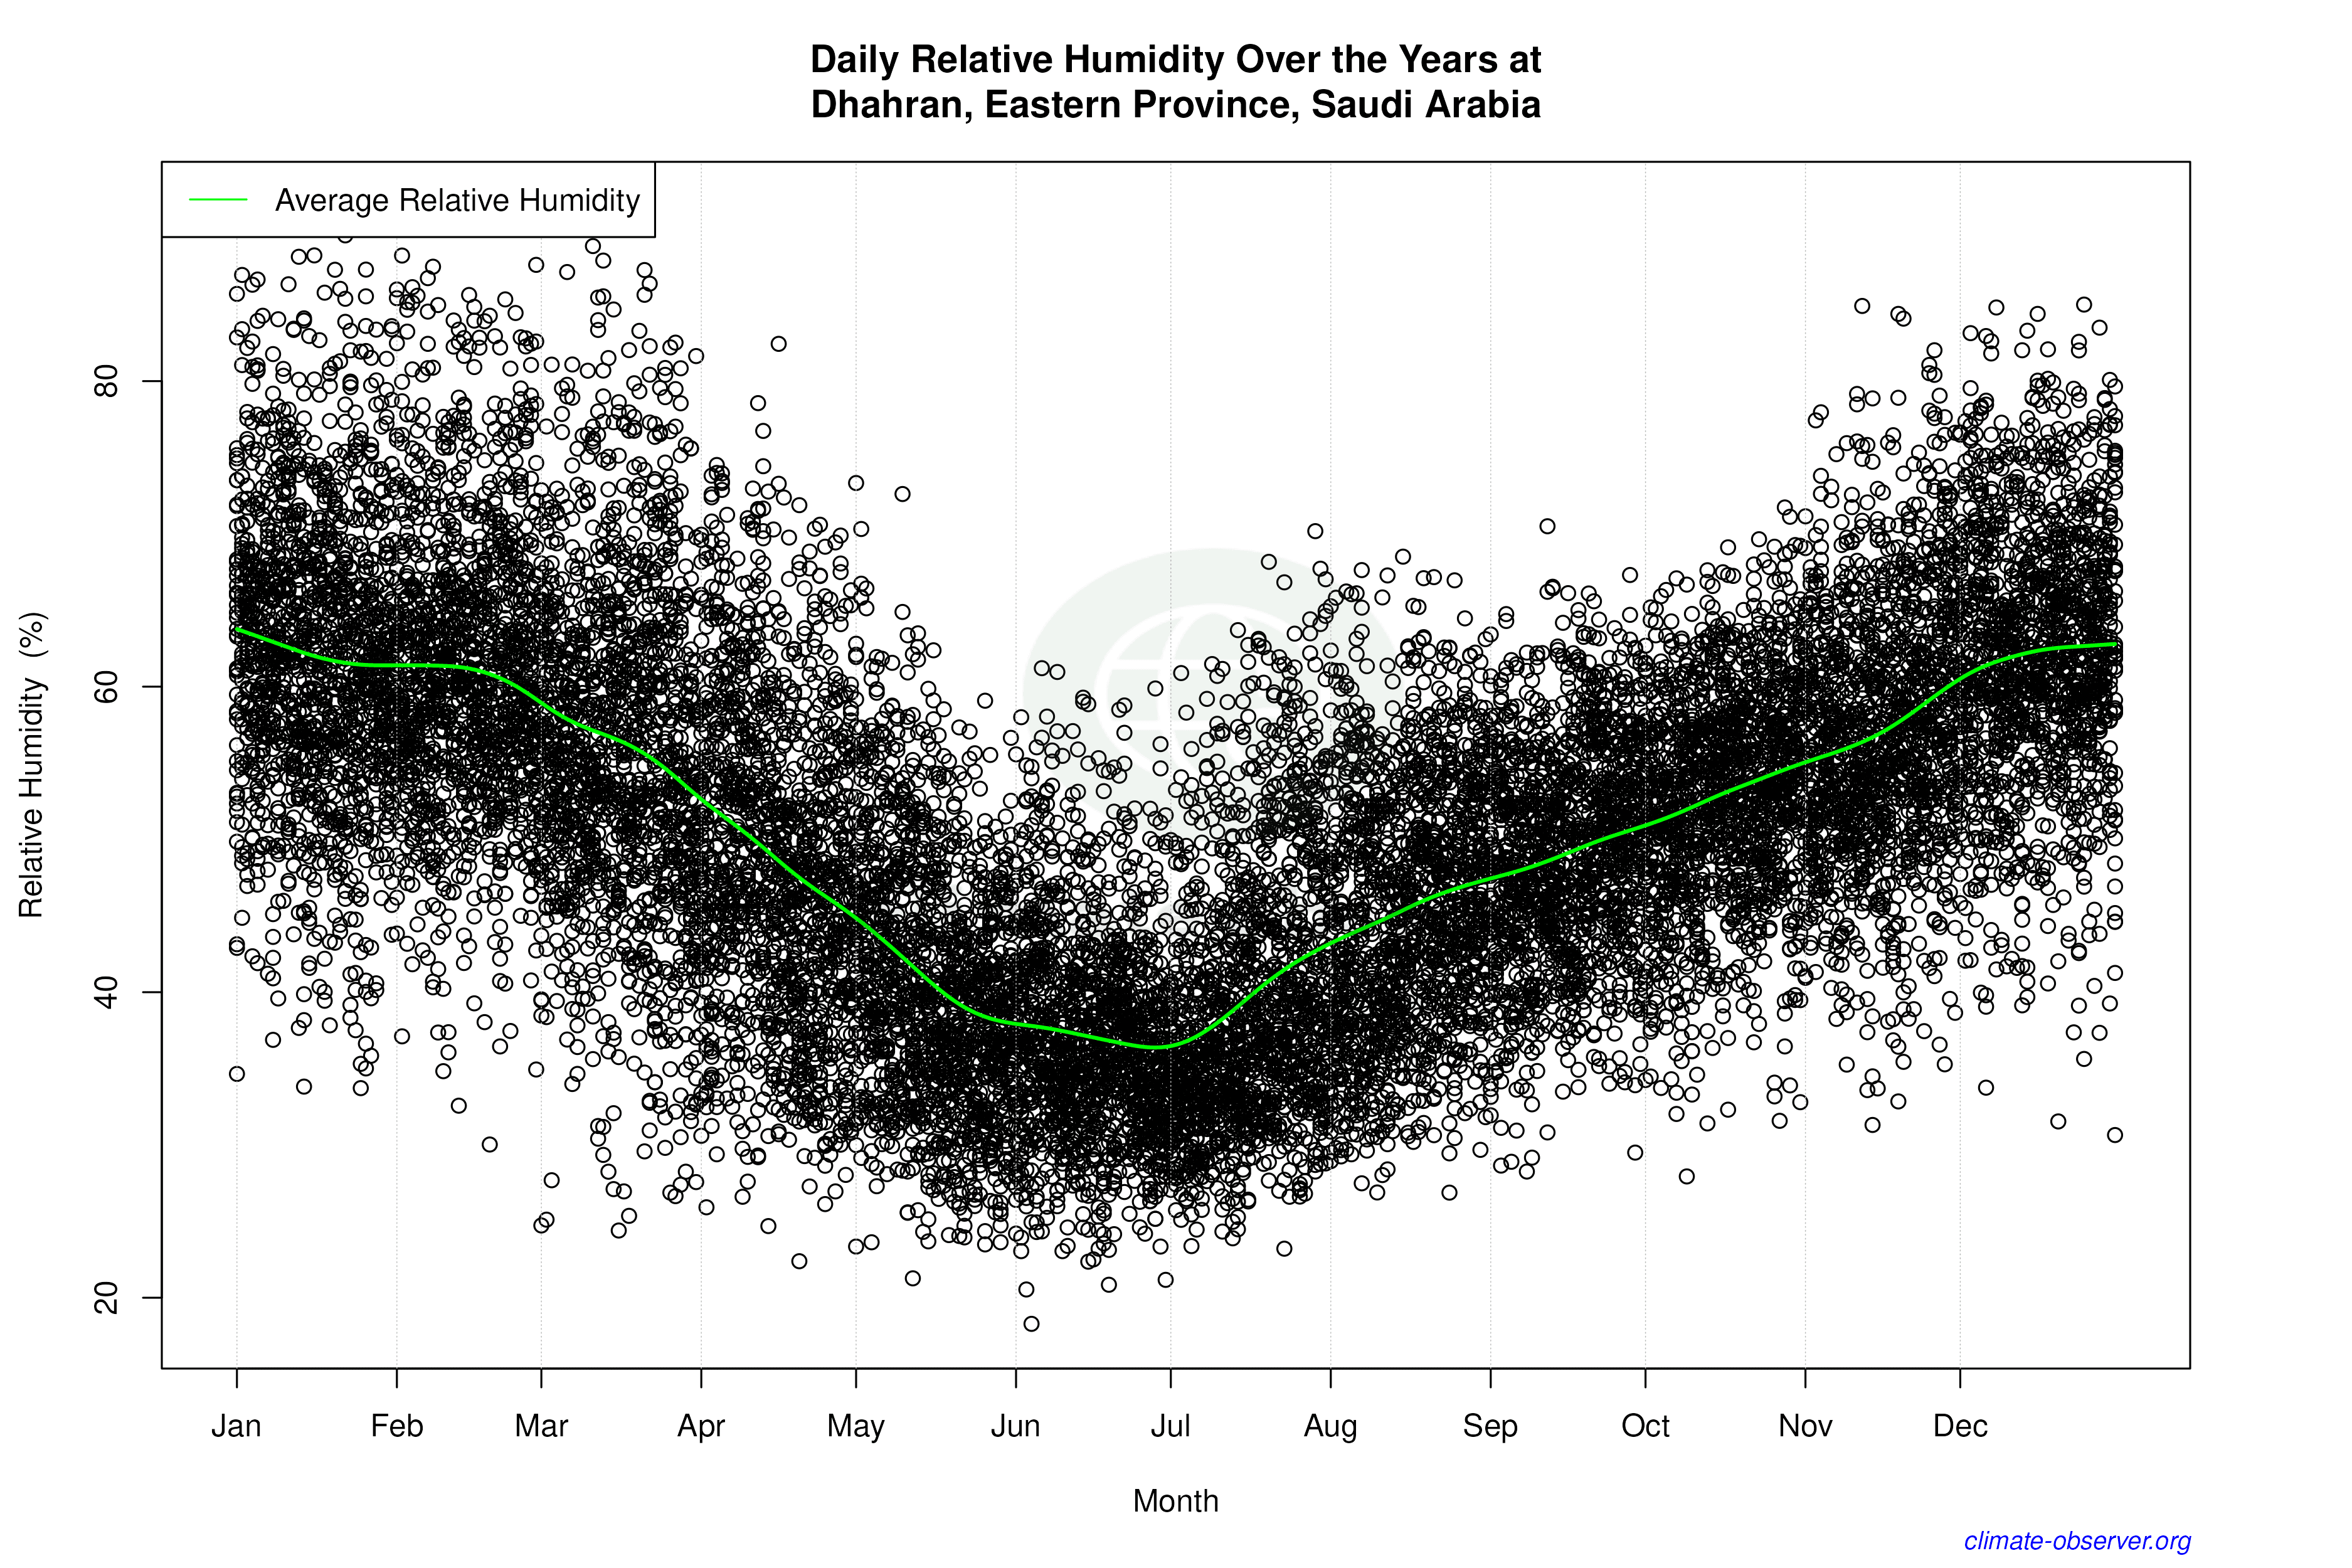

Average Max Temperature Throughout Year | 1 of 5
