Climate for Station: Cape Agulhas, Western Cape, South Africa
Loading live weather...
Climate Analysis & Overview
Cape Agulhas, situated at the southernmost tip of Africa, exhibits a complex climate profile marked by a slight warming trend in temperatures and a marginal increase in precipitation concentration. The area faces a unique interplay of cooling and warming trends over different time scales, highlighting the dynamic nature of its climate.
A Coastal Climate with Unique Dynamics
Cape Agulhas, classified under the Köppen climate system as a Mediterranean climate (Csb), is characterised by mild, wet winters and hot, dry summers. Its geographical positioning along the southern coast of South Africa exposes it to the confluence of the Indian and Atlantic Oceans, which significantly influences its weather patterns. This coastal proximity contributes to the region's moderate temperature fluctuations and distinct seasonal precipitation.
Temperature Trends: A Tale of Two Scales
Over the past decade, Cape Agulhas has experienced a cooling trend in high temperatures of 0.38°C (0.68°F), juxtaposed against a slight warming in low temperatures of 0.11°C (0.20°F). However, when we extend our view to the all-time trends, both high and low temperatures reveal a warming pattern. Highs have increased by 0.22°C (0.40°F), while lows have risen by 0.20°C (0.36°F). These contrasting trends underscore the complexity of local climate dynamics, where short-term cooling can occur alongside long-term warming.
Precipitation Patterns: Concentration on the Rise
The Precipitation Concentration Index (PCI) for Cape Agulhas has seen a marginal increase from a baseline of 12.43 to a current value of 12.83. This slight rise indicates a trend towards more concentrated rainfall events, where precipitation is increasingly occurring in fewer, more intense episodes. Although not yet reaching levels of high concentration, this shift could have implications for local water management and agricultural practices.
Temperature Extremes: A Historical Perspective
Cape Agulhas has recorded a maximum temperature of 30.7°C (87.3°F) and a minimum of 0.8°C (33.4°F). These records highlight the region's capacity for both warmth and chill, reflective of its Mediterranean climate influences. The relatively moderate extremes are indicative of the buffering effect provided by the surrounding oceanic bodies.
Regional Implications and Future Considerations
In light of South Africa's regional climate goals, which focus on adaptation and resilience, understanding these nuanced climate trends is crucial. The observed warming trends, coupled with more concentrated precipitation, may necessitate adjustments in local climate adaptation strategies. As Cape Agulhas continues to navigate these changes, ongoing monitoring and research will be vital in supporting sustainable development and environmental stewardship in the region.
Station Statistics
10-Year Trend
High: -0.57 °C/decade
Low: +0.45 °C/decade
Rain: +0.36 mm/decade
25-Year Trend
High: +0.69 °C/decade
Low: -0.44 °C/decade
Rain: +0.00 mm/decade
50-Year Trend
High: +0.32 °C/decade
Low: +0.19 °C/decade
Rain: +0.04 mm/decade
All-Time Trend
High: +0.22 °C/decade
Low: +0.20 °C/decade
Rain: +0.01 mm/decade
Percentage Above-Average Days
Last 12 Months: 42.2%
This Year: 14.4%
Precipitation Concentration Index (PCI) ℹ️
Last 12 Months: 12.1
Historical Average: 11.8
Percentile Rank of Last 12 Months ℹ️
High: 63rd percentile
Low: 92nd percentile
Rain: 43rd percentile
Change in Variance ℹ️
High: -16.5%
Low: +2.8%
Intraday: +19.7%
Data Coverage
54.6%
First Year of Data
1875
Station Location
Historical Weather Records
| Max High | Avg High | Min High | Max Avg | Avg Avg | Min Avg | Max Low | Avg Low | Min Low | Max Precipitation | Avg Precipitation | Max Snow | Avg Snow | |
|---|---|---|---|---|---|---|---|---|---|---|---|---|---|
| Record | 30.7 °C | — | 10.4 °C | 27.3 °C | — | 8.3 °C | 22.6 °C | — | 0.8 °C | 126.0 mm | — | — | — |
| January | 30.6 °C | 24.0 °C | 18.0 °C | 27.3 °C | 21.2 °C | 16.4 °C | 22.6 °C | 18.2 °C | 10.0 °C | 117.0 mm | 0.7 mm | — | — |
| February | 30.7 °C | 23.9 °C | 17.4 °C | 25.9 °C | 21.2 °C | 14.8 °C | 22.6 °C | 18.4 °C | 10.5 °C | 126.0 mm | 0.8 mm | — | — |
| March | 28.9 °C | 22.7 °C | 15.3 °C | 25.9 °C | 20.0 °C | 14.3 °C | 22.0 °C | 17.3 °C | 9.3 °C | 103.0 mm | 1.1 mm | — | — |
| April | 30.5 °C | 20.7 °C | 14.0 °C | 26.5 °C | 18.1 °C | 10.8 °C | 20.7 °C | 15.3 °C | 7.4 °C | 63.1 mm | 1.3 mm | — | — |
| May | 29.0 °C | 19.2 °C | 13.5 °C | 22.8 °C | 16.5 °C | 10.8 °C | 19.4 °C | 13.6 °C | 7.2 °C | 68.8 mm | 1.5 mm | — | — |
| June | 29.8 °C | 17.9 °C | 10.8 °C | 22.3 °C | 15.1 °C | 9.1 °C | 18.0 °C | 12.0 °C | 2.8 °C | 50.0 mm | 1.8 mm | — | — |
| July | 27.6 °C | 17.1 °C | 10.4 °C | 22.7 °C | 14.3 °C | 8.3 °C | 19.1 °C | 11.2 °C | 0.8 °C | 61.0 mm | 1.7 mm | — | — |
| August | 26.7 °C | 17.1 °C | 11.1 °C | 22.1 °C | 14.4 °C | 8.8 °C | 17.8 °C | 11.3 °C | 1.2 °C | 50.8 mm | 1.7 mm | — | — |
| September | 26.5 °C | 18.0 °C | 12.0 °C | 22.4 °C | 15.4 °C | 9.9 °C | 17.9 °C | 12.4 °C | 3.0 °C | 83.3 mm | 1.3 mm | — | — |
| October | 28.2 °C | 19.5 °C | 13.4 °C | 23.0 °C | 16.9 °C | 11.0 °C | 21.8 °C | 14.0 °C | 5.9 °C | 123.0 mm | 1.3 mm | — | — |
| November | 28.5 °C | 21.2 °C | 14.6 °C | 22.1 °C | 18.4 °C | 12.5 °C | 20.2 °C | 15.5 °C | 6.5 °C | 59.0 mm | 1.0 mm | — | — |
| December | 29.2 °C | 23.0 °C | 16.4 °C | 24.5 °C | 20.1 °C | 14.2 °C | 22.2 °C | 17.2 °C | 10.0 °C | 36.6 mm | 0.7 mm | — | — |
Data Visualisations
Remove WatermarksCurrent Year Climate Trends vs Historical


Max Temperature this Year | 1 of 6
Climate 12-Month Moving Averages


Max Temperature 12-Month MA | 1 of 6
Daily Data Points and Averages Throughout the Year


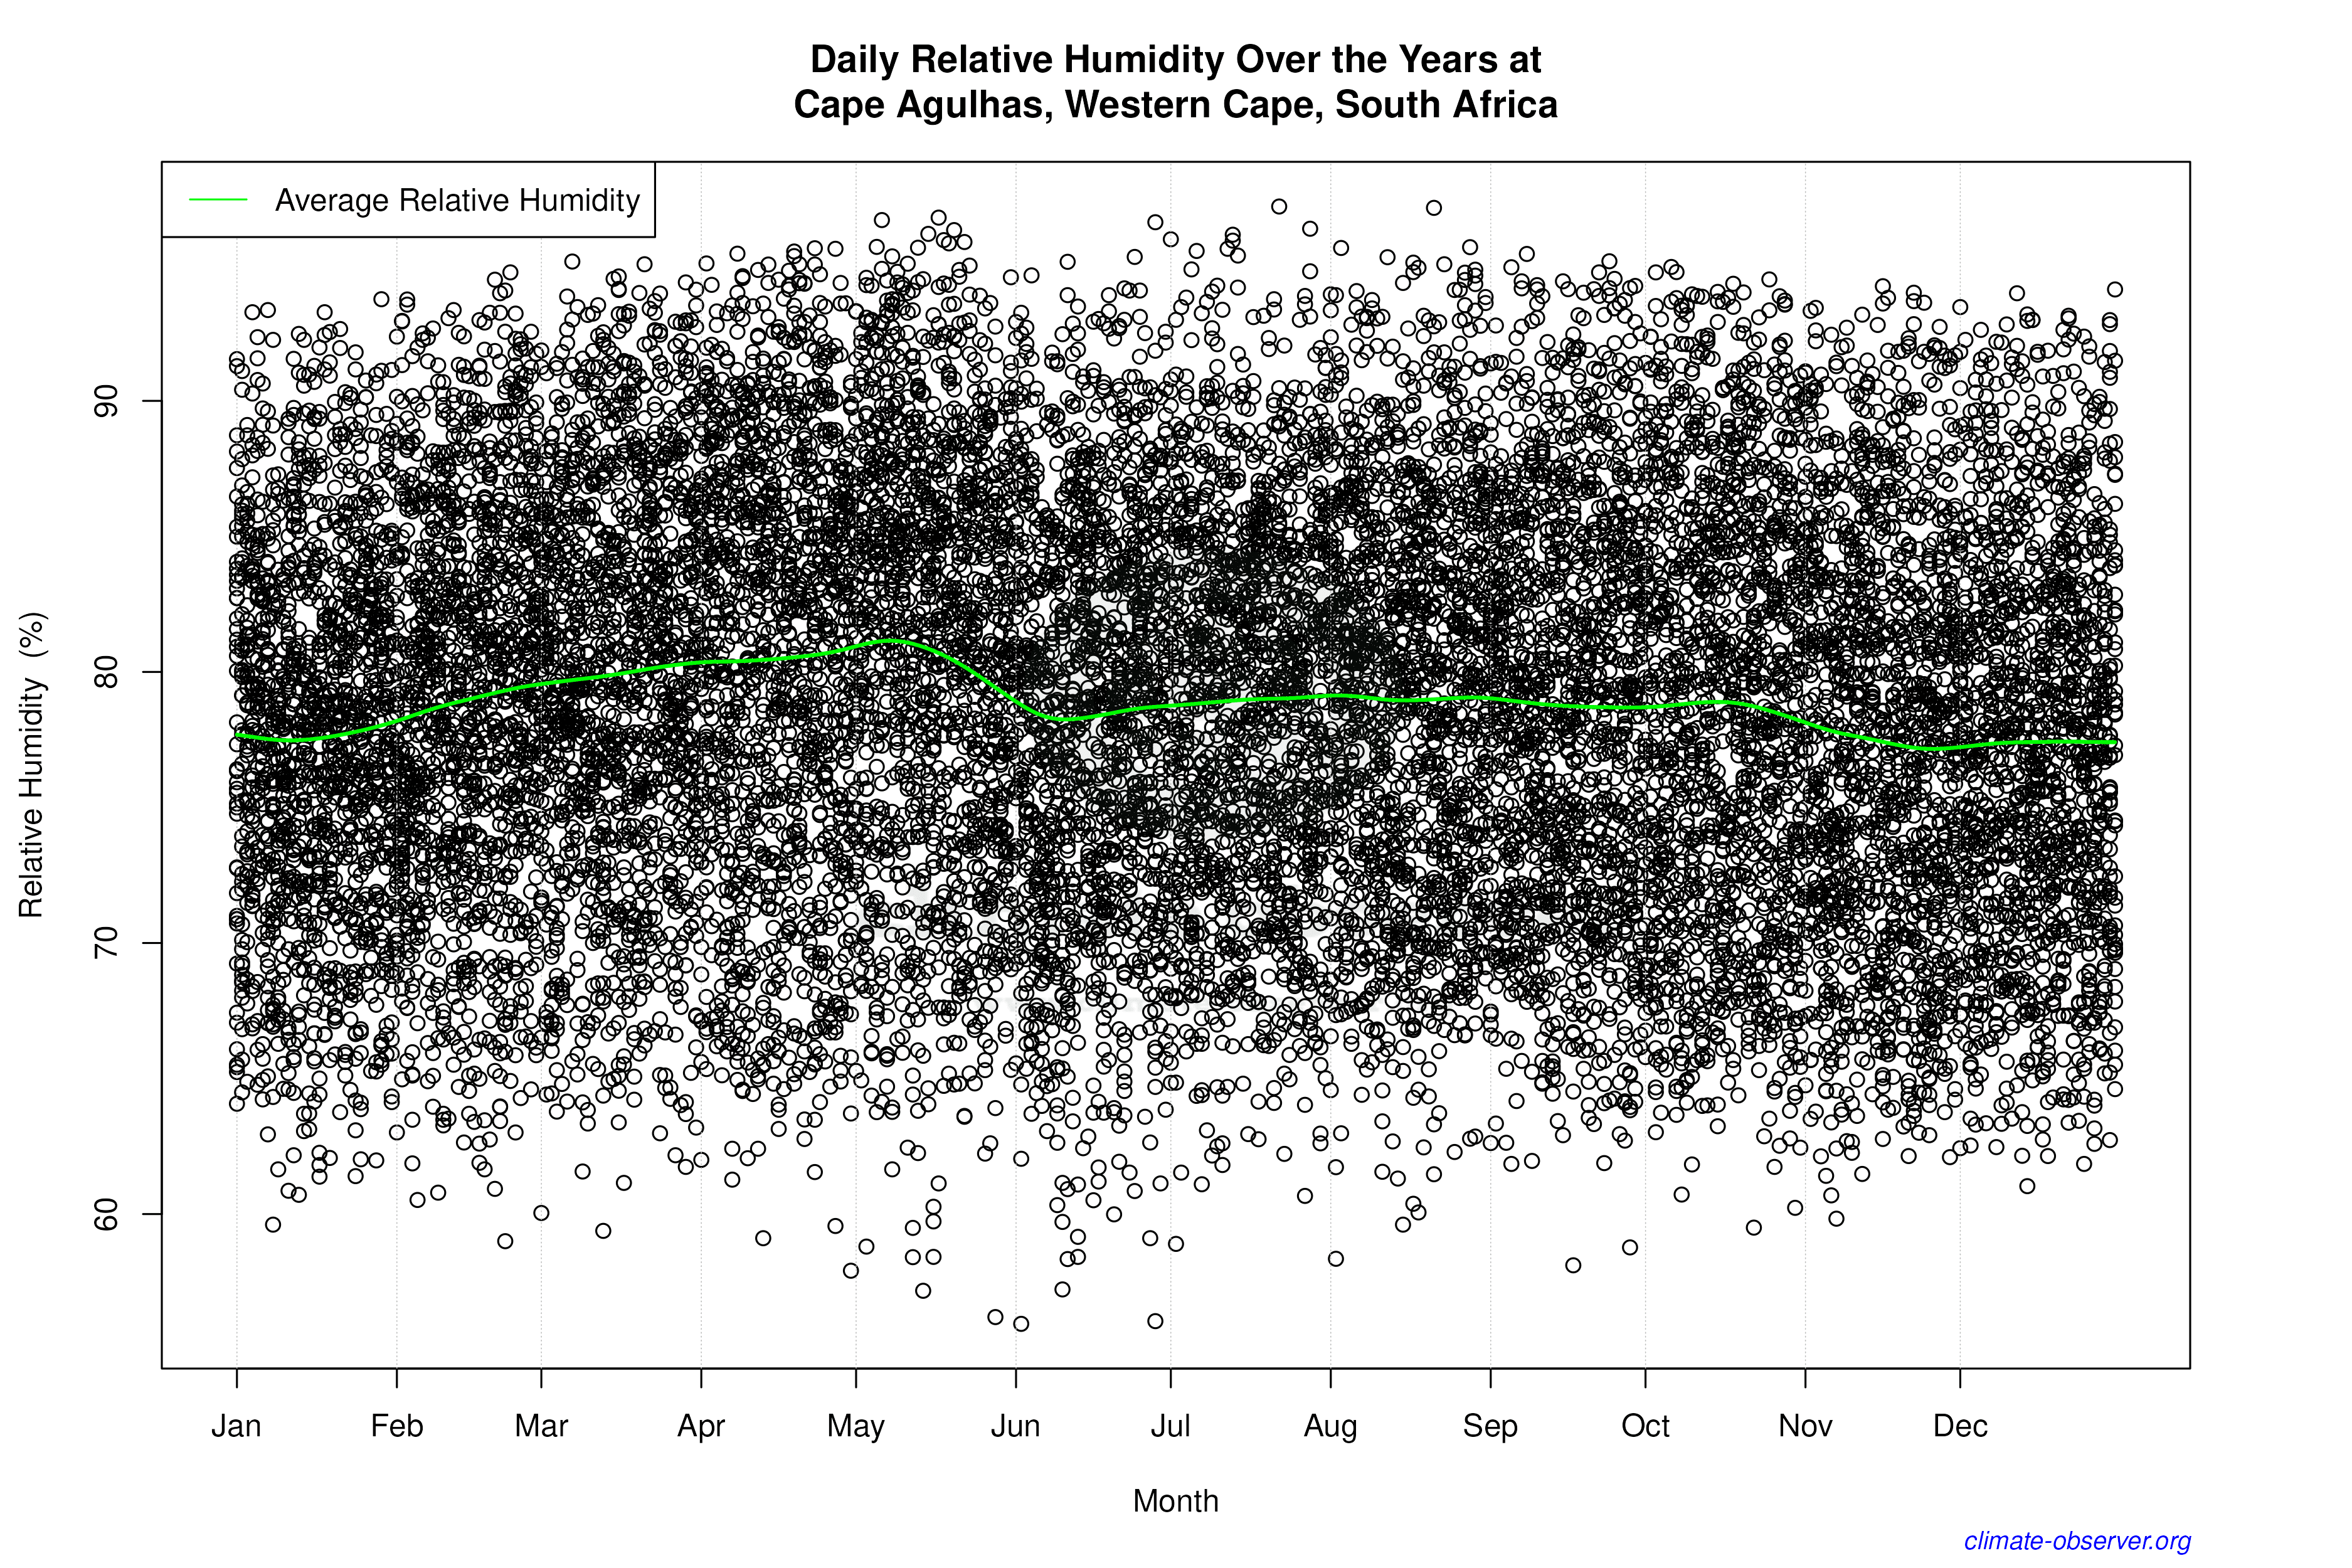

Average Max Temperature Throughout Year | 1 of 5
