Climate for Station: Bloemfontein Airpor, Free State, South Africa
Loading live weather...
Climate Analysis & Overview
Bloemfontein Airport's climate profile reveals a complex interplay of cooling trends over the past decade with a slight long-term warming. The precipitation pattern has become marginally more even, suggesting subtle shifts in local weather dynamics.
Köppen Climate and Geographic Influence
Bloemfontein Airport is situated in a region classified under the Köppen climate classification as BSk, which denotes a semi-arid climate. This classification is characterised by low annual precipitation and significant temperature variability. The city's location on the South African Highveld plateau, at an elevation of approximately 1,400 metres (4,593 feet), influences its climate, resulting in cooler temperatures compared to the coastal regions. This elevation, combined with its inland position, means that Bloemfontein experiences hot summers and cold winters, with a distinct lack of moisture due to the absence of nearby large water bodies.
Temperature Trends: A Mixed Picture
The last decade has seen a noticeable cooling trend in Bloemfontein Airport's temperature records. High temperatures have decreased by 0.47°C (0.85°F), while low temperatures have fallen by a more pronounced 1.00°C (1.80°F). However, when considering the all-time trends, a slight warming is observed in the high temperatures, with an increase of 0.30°C (0.54°F). Conversely, the low temperatures have experienced a marginal cooling of 0.05°C (0.09°F). This juxtaposition of short-term cooling against a backdrop of long-term warming highlights the complexity of local climate dynamics.
Precipitation Patterns: A Subtle Shift
The Precipitation Concentration Index (PCI), which measures how precipitation is distributed over time, indicates a slight decrease from a baseline of 16.63 to a current value of 16.34. This marginal change suggests that rainfall events have become slightly more evenly distributed across the year, potentially reducing the risk of intense, concentrated downpours. This shift aligns with broader regional climate goals aimed at stabilising precipitation patterns to mitigate the impacts of droughts and floods.
Record Extremes and Their Implications
Bloemfontein Airport's temperature extremes underscore the region's climatic variability. The highest recorded temperature is 42.0°C (107.6°F), while the lowest is a frigid -11.7°C (10.9°F). These extremes reflect the significant diurnal and seasonal temperature ranges typical of semi-arid climates. Such variability poses challenges for local agriculture and water management, necessitating adaptive strategies to cope with potential heatwaves and cold spells.
Regional Climate Context
South Africa's climate goals focus on resilience and adaptation in the face of changing weather patterns. Recent regional initiatives aim to enhance water conservation and improve agricultural practices, aligning with the observed trends at Bloemfontein Airport. The subtle shifts in temperature and precipitation distribution offer insights into the broader climatic changes occurring across the Highveld, providing valuable data for policymakers and researchers alike.
Station Statistics
10-Year Trend
High: -0.59 °C/decade
Low: -0.19 °C/decade
Rain: +1.07 mm/decade
25-Year Trend
High: +0.64 °C/decade
Low: +0.28 °C/decade
Rain: +0.11 mm/decade
50-Year Trend
High: +0.27 °C/decade
Low: -0.00 °C/decade
Rain: +0.02 mm/decade
All-Time Trend
High: +0.29 °C/decade
Low: -0.03 °C/decade
Rain: +0.02 mm/decade
Percentage Above-Average Days
Last 12 Months: 45.2%
This Year: 45.5%
Precipitation Concentration Index (PCI) ℹ️
Last 12 Months: 13.2
Historical Average: 16.6
Percentile Rank of Last 12 Months ℹ️
High: 33rd percentile
Low: 97th percentile
Rain: 84th percentile
Change in Variance ℹ️
High: -9.7%
Low: +1.8%
Intraday: +24.2%
Data Coverage
56.2%
First Year of Data
1909
Station Location
Historical Weather Records
| Max High | Avg High | Min High | Max Avg | Avg Avg | Min Avg | Max Low | Avg Low | Min Low | Max Precipitation | Avg Precipitation | Max Snow | Avg Snow | |
|---|---|---|---|---|---|---|---|---|---|---|---|---|---|
| Record | 42.0 °C | — | 5.5 °C | 33.7 °C | — | -4.5 °C | 24.0 °C | — | -11.7 °C | 108.7 mm | — | — | — |
| January | 42.0 °C | 31.7 °C | 17.0 °C | 32.7 °C | 23.0 °C | 13.2 °C | 22.5 °C | 15.4 °C | 5.5 °C | 108.7 mm | 2.8 mm | — | — |
| February | 38.9 °C | 30.5 °C | 18.4 °C | 31.4 °C | 22.1 °C | 14.4 °C | 22.3 °C | 14.8 °C | 4.4 °C | 93.0 mm | 3.1 mm | — | — |
| March | 37.1 °C | 28.7 °C | 16.3 °C | 27.2 °C | 19.8 °C | 9.1 °C | 21.0 °C | 12.3 °C | 0.8 °C | 79.8 mm | 2.6 mm | — | — |
| April | 33.3 °C | 25.2 °C | 12.8 °C | 24.8 °C | 15.7 °C | 5.2 °C | 19.3 °C | 7.7 °C | -4.2 °C | 60.2 mm | 1.8 mm | — | — |
| May | 29.8 °C | 22.0 °C | 9.0 °C | 21.0 °C | 11.5 °C | 1.5 °C | 12.5 °C | 2.7 °C | -8.0 °C | 51.8 mm | 0.7 mm | — | — |
| June | 25.8 °C | 18.7 °C | 5.5 °C | 16.8 °C | 7.8 °C | -0.2 °C | 12.9 °C | -1.2 °C | -11.7 °C | 46.0 mm | 0.3 mm | — | — |
| July | 26.5 °C | 18.8 °C | 7.2 °C | 17.7 °C | 7.8 °C | -4.5 °C | 10.1 °C | -1.8 °C | -11.2 °C | 34.1 mm | 0.3 mm | — | — |
| August | 32.7 °C | 21.7 °C | 6.0 °C | 21.3 °C | 10.8 °C | 1.0 °C | 15.6 °C | 0.9 °C | -10.3 °C | 55.9 mm | 0.4 mm | — | — |
| September | 35.0 °C | 25.8 °C | 8.9 °C | 26.0 °C | 15.4 °C | 2.7 °C | 19.3 °C | 5.3 °C | -5.5 °C | 95.3 mm | 0.6 mm | — | — |
| October | 37.1 °C | 28.0 °C | 13.6 °C | 28.3 °C | 18.4 °C | 8.1 °C | 19.7 °C | 9.3 °C | -1.8 °C | 68.3 mm | 1.5 mm | — | — |
| November | 39.6 °C | 29.6 °C | 15.9 °C | 30.2 °C | 20.5 °C | 9.2 °C | 22.4 °C | 11.7 °C | 0.9 °C | 74.9 mm | 2.2 mm | — | — |
| December | 40.2 °C | 31.3 °C | 19.0 °C | 33.7 °C | 22.3 °C | 13.8 °C | 24.0 °C | 14.0 °C | 1.0 °C | 82.6 mm | 2.3 mm | — | — |
Data Visualisations
Remove WatermarksCurrent Year Climate Trends vs Historical


Max Temperature this Year | 1 of 6
Climate 12-Month Moving Averages


Max Temperature 12-Month MA | 1 of 6
Daily Data Points and Averages Throughout the Year


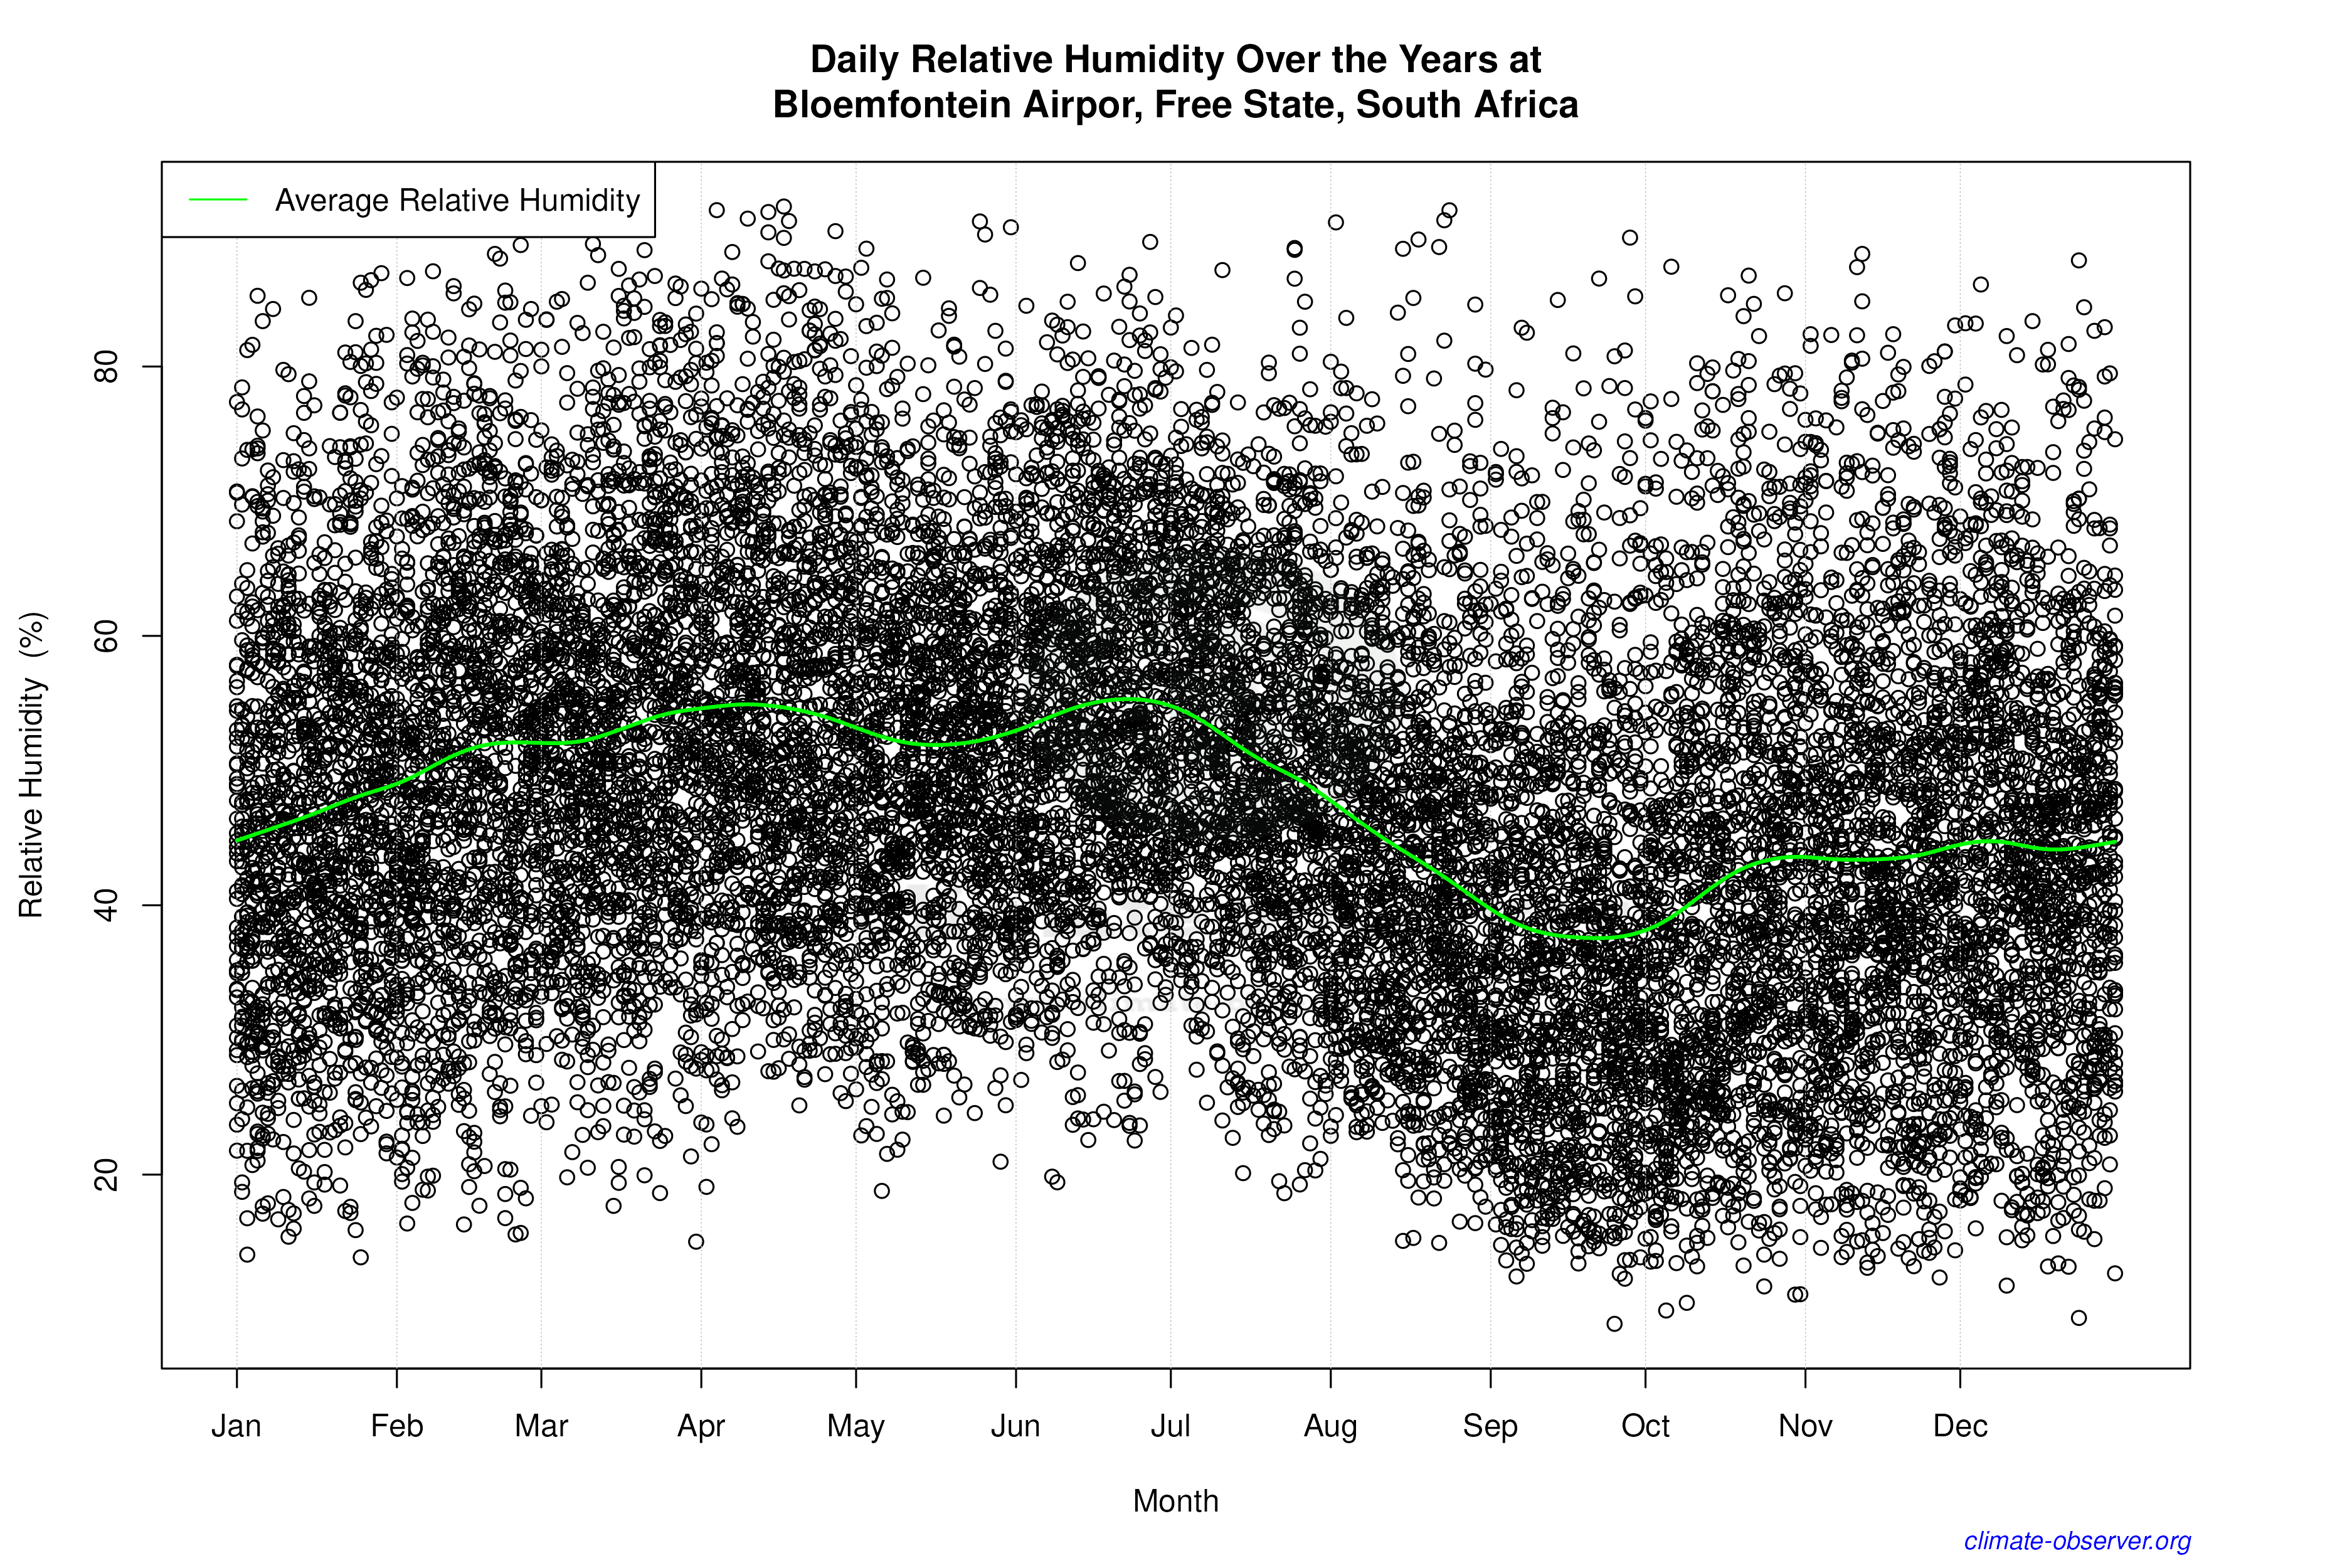

Average Max Temperature Throughout Year | 1 of 5
