Climate for Station: Durban Intl, KwaZulu-Natal, South Africa
Loading live weather...
Climate Analysis & Overview
Durban International Airport has experienced a complex climate trajectory over recent years, with a notable warming trend in low temperatures and a slight cooling in high temperatures. The region's precipitation patterns have become marginally more concentrated, potentially impacting local water management strategies.
Köppen Climate Context and Geographical Influence
Durban International Airport, located at coordinates -29.97, 30.951, falls under the Cfa classification in the Köppen climate system, indicating a humid subtropical climate. This classification is characterised by hot, humid summers and mild, dry winters. The proximity to the Indian Ocean significantly influences the region's climate, moderating temperatures and contributing to the area's high humidity levels. The local geography, with its coastal plains and nearby Drakensberg Mountains, plays a crucial role in shaping weather patterns, including the distribution and intensity of rainfall.
Temperature Trends: A Mixed Picture
Over the past decade, Durban International has witnessed a slight cooling in high temperatures, with a trend of -0.03°C (-0.06°F). In contrast, low temperatures have shown a warming trend of 0.81°C (1.46°F). When considering all-time data, high temperatures have experienced a modest warming trend of 0.10°C (0.18°F), while low temperatures have seen a minimal cooling of -0.02°C (-0.04°F). These trends suggest a narrowing of the temperature range, which could have implications for local ecosystems and energy consumption patterns.
Precipitation Patterns: Concentration Intensifies
The Precipitation Concentration Index (PCI) for Durban International has increased from a baseline of 13.40 to a current value of 14.02. This marginal increase indicates that rainfall events have become slightly more concentrated, with precipitation occurring in fewer, more intense events. Such changes can lead to challenges in water management, as more intense rainfall can increase the risk of flooding and soil erosion, while dry spells may become more pronounced.
Record Extremes and Implications
The station's record high temperature stands at 40.4°C (104.7°F), while the record low is 0.0°C (32.0°F). These extremes highlight the potential for significant thermal variability, which can impact agriculture, infrastructure, and public health. Understanding these extremes is vital for developing adaptive strategies to mitigate the effects of climate variability.
Regional Climate Goals and Recent Events
In the context of South Africa's climate goals, which aim to reduce greenhouse gas emissions and enhance resilience to climate impacts, the trends observed at Durban International are significant. The warming of low temperatures aligns with broader regional trends, while the increased concentration of precipitation events may necessitate adjustments in water resource management. Recent weather events, such as intense storms and prolonged dry periods, underscore the importance of integrating climate data into planning and policy-making to enhance the region's climate resilience.
Station Statistics
10-Year Trend
High: -0.07 °C/decade
Low: +0.69 °C/decade
Rain: +0.93 mm/decade
25-Year Trend
High: +0.15 °C/decade
Low: +0.39 °C/decade
Rain: +0.19 mm/decade
50-Year Trend
High: +0.10 °C/decade
Low: -0.01 °C/decade
Rain: +0.03 mm/decade
All-Time Trend
High: +0.10 °C/decade
Low: -0.01 °C/decade
Rain: +0.03 mm/decade
Percentage Above-Average Days
Last 12 Months: 41.1%
This Year: 42.5%
Precipitation Concentration Index (PCI) ℹ️
Last 12 Months: 16.1
Historical Average: 14.0
Percentile Rank of Last 12 Months ℹ️
High: 45th percentile
Low: 94th percentile
Rain: 98th percentile
Change in Variance ℹ️
High: +11.5%
Low: -30.3%
Intraday: -33.0%
Data Coverage
90.7%
First Year of Data
1977
Station Location
Historical Weather Records
| Max High | Avg High | Min High | Max Avg | Avg Avg | Min Avg | Max Low | Avg Low | Min Low | Max Precipitation | Avg Precipitation | Max Snow | Avg Snow | |
|---|---|---|---|---|---|---|---|---|---|---|---|---|---|
| Record | 40.4 °C | — | 12.0 °C | 29.4 °C | — | 11.3 °C | 26.3 °C | — | 0.0 °C | 210.1 mm | — | — | — |
| January | 40.4 °C | 28.9 °C | 21.0 °C | 29.4 °C | 24.4 °C | 17.6 °C | 26.3 °C | 21.4 °C | 11.0 °C | 108.0 mm | 3.9 mm | — | — |
| February | 39.8 °C | 29.2 °C | 20.9 °C | 29.4 °C | 24.8 °C | 18.3 °C | 26.2 °C | 21.7 °C | 12.3 °C | 117.1 mm | 4.0 mm | — | — |
| March | 37.1 °C | 28.6 °C | 21.0 °C | 28.7 °C | 24.0 °C | 17.0 °C | 25.7 °C | 20.6 °C | 12.7 °C | 160.0 mm | 3.6 mm | — | — |
| April | 38.1 °C | 27.0 °C | 18.4 °C | 29.4 °C | 22.1 °C | 15.8 °C | 25.4 °C | 18.1 °C | 9.0 °C | 130.8 mm | 2.7 mm | — | — |
| May | 36.5 °C | 25.7 °C | 18.0 °C | 26.9 °C | 19.9 °C | 12.7 °C | 23.8 °C | 15.0 °C | 5.5 °C | 77.0 mm | 1.5 mm | — | — |
| June | 36.0 °C | 24.3 °C | 16.1 °C | 25.8 °C | 17.6 °C | 12.2 °C | 21.2 °C | 12.0 °C | 0.0 °C | 81.3 mm | 0.9 mm | — | — |
| July | 33.8 °C | 23.6 °C | 15.6 °C | 23.8 °C | 17.2 °C | 11.8 °C | 21.1 °C | 11.8 °C | 3.8 °C | 119.2 mm | 1.3 mm | — | — |
| August | 37.2 °C | 23.9 °C | 15.1 °C | 26.9 °C | 18.3 °C | 11.3 °C | 22.4 °C | 13.7 °C | 3.2 °C | 59.9 mm | 1.4 mm | — | — |
| September | 35.5 °C | 24.5 °C | 12.0 °C | 25.8 °C | 19.5 °C | 11.6 °C | 21.1 °C | 15.7 °C | 4.0 °C | 121.5 mm | 2.5 mm | — | — |
| October | 38.8 °C | 24.9 °C | 16.4 °C | 27.7 °C | 20.4 °C | 14.4 °C | 23.1 °C | 17.1 °C | 8.0 °C | 74.9 mm | 3.4 mm | — | — |
| November | 34.9 °C | 26.2 °C | 17.3 °C | 27.6 °C | 21.7 °C | 14.7 °C | 23.5 °C | 18.6 °C | 11.2 °C | 97.3 mm | 4.0 mm | — | — |
| December | 35.7 °C | 27.7 °C | 19.8 °C | 28.6 °C | 23.3 °C | 17.1 °C | 25.8 °C | 20.2 °C | 9.0 °C | 210.1 mm | 4.1 mm | — | — |
Data Visualisations
Remove WatermarksCurrent Year Climate Trends vs Historical


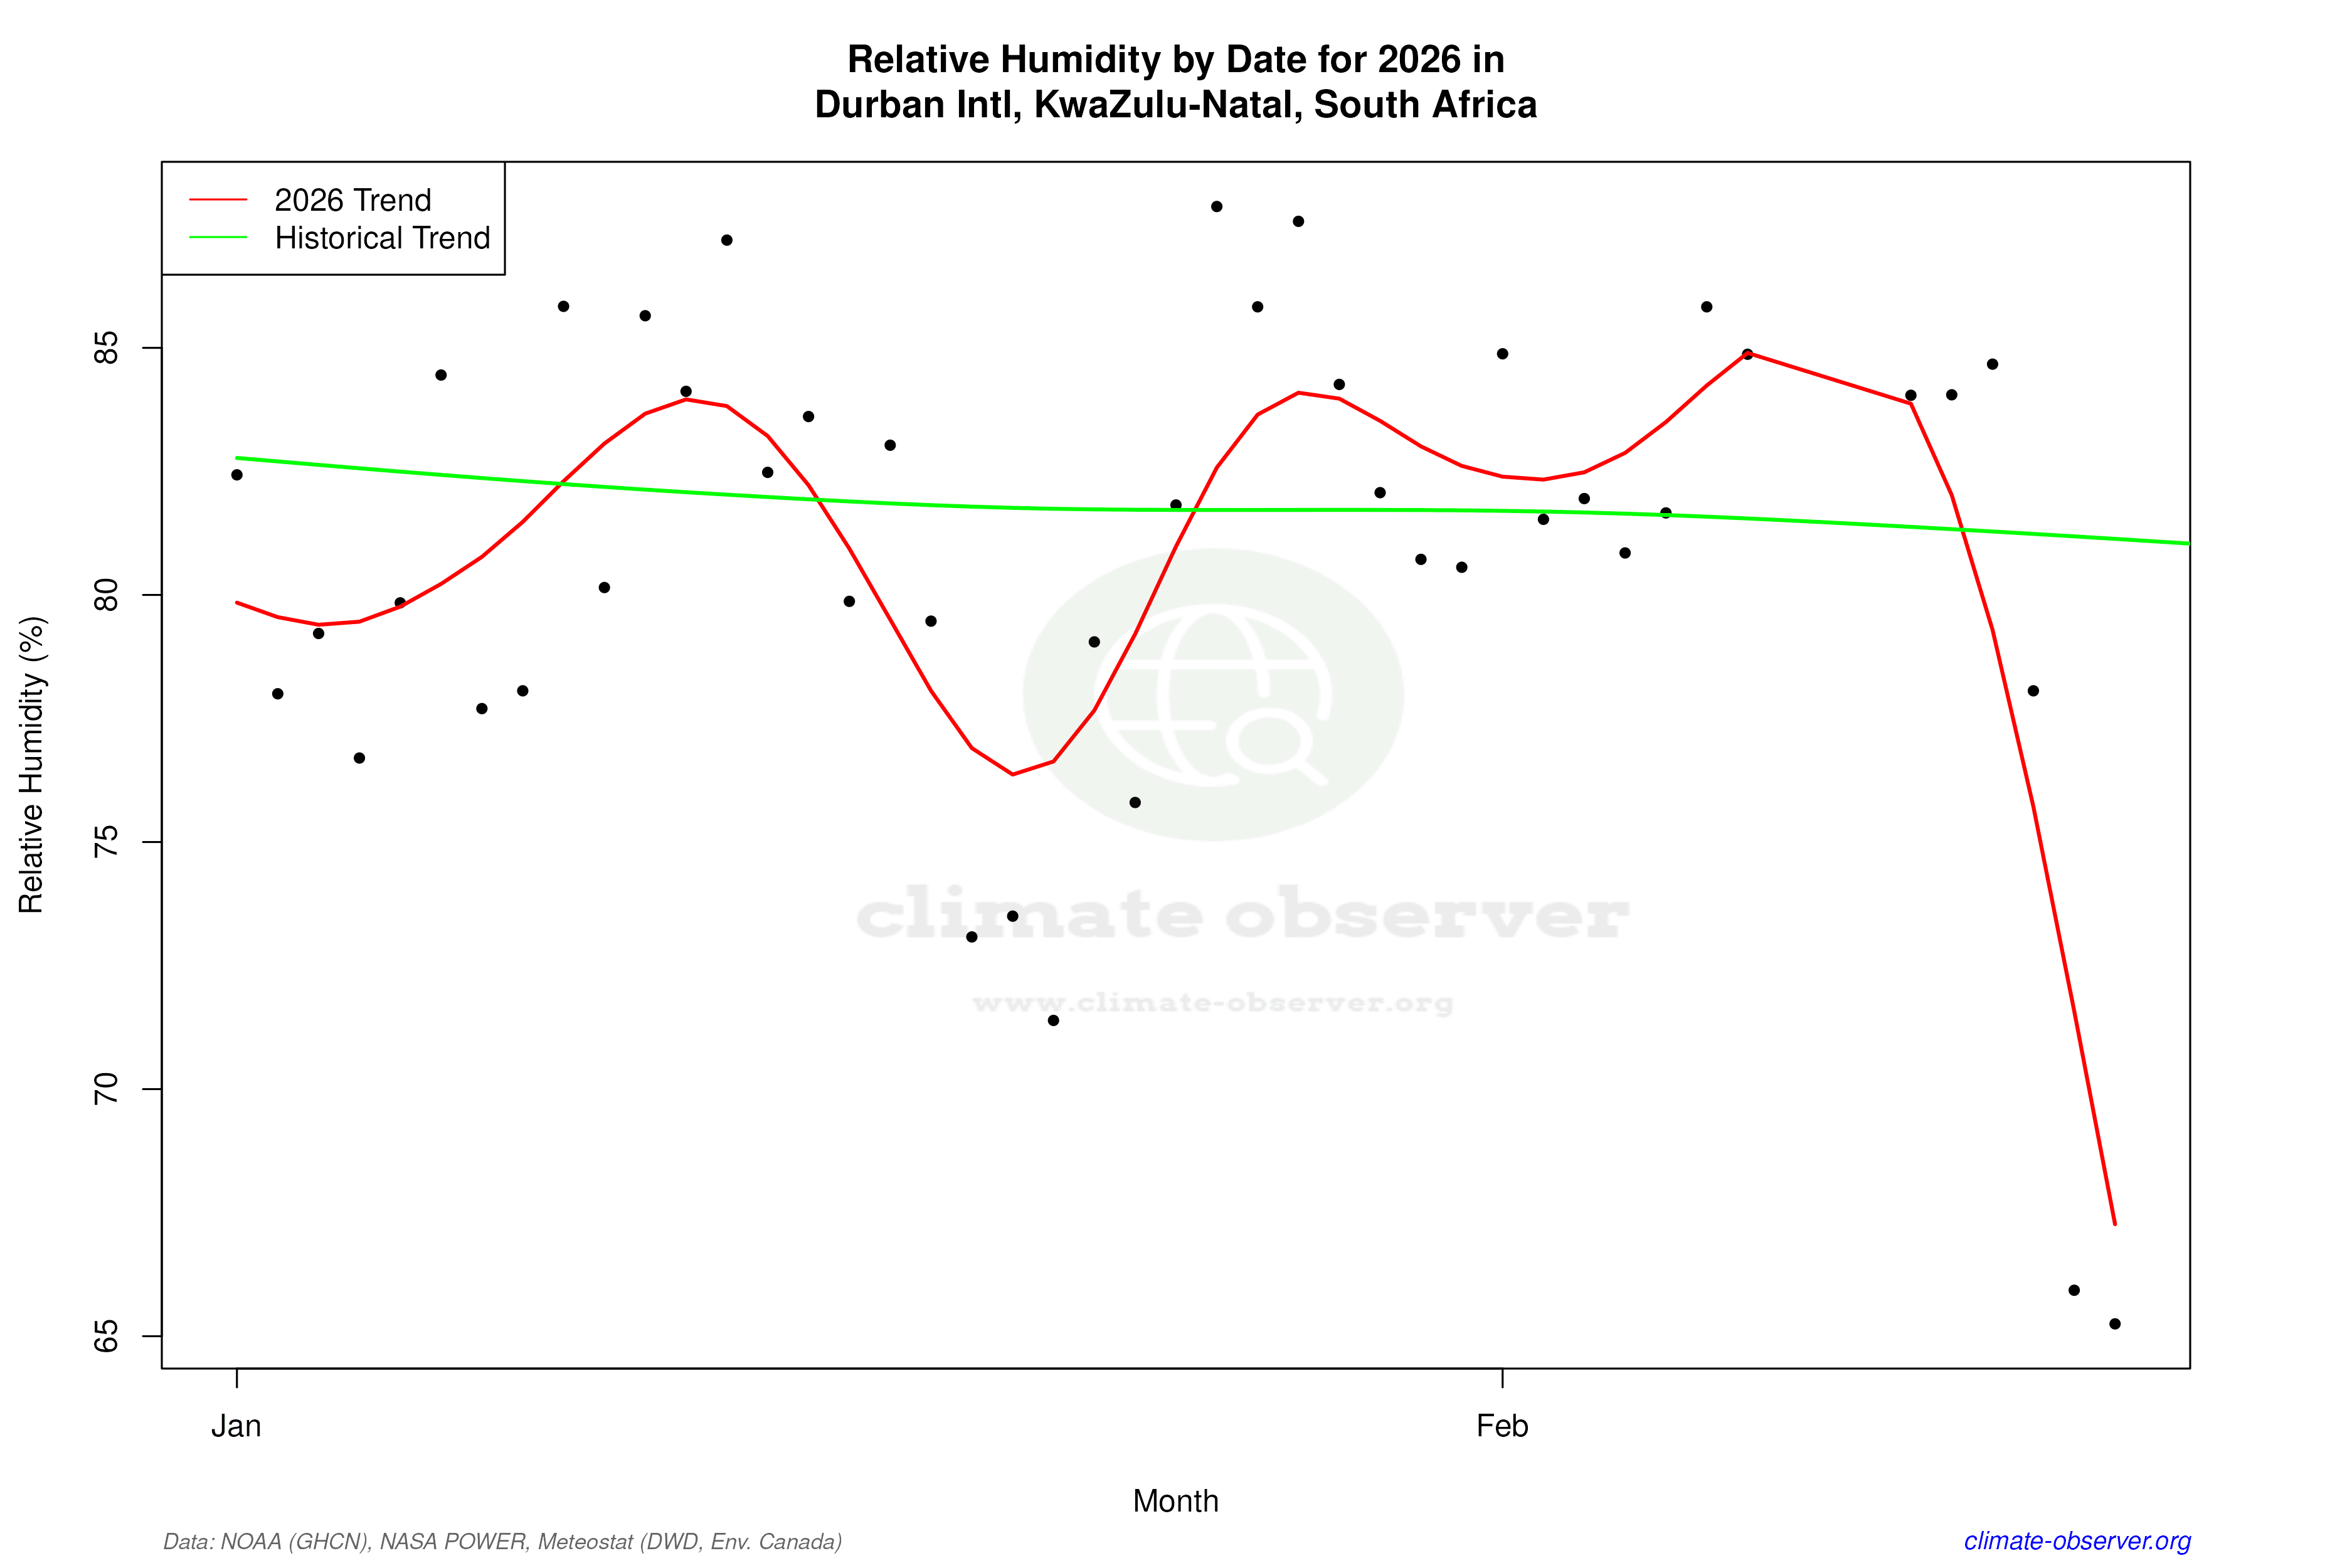

Max Temperature this Year | 1 of 6
Climate 12-Month Moving Averages


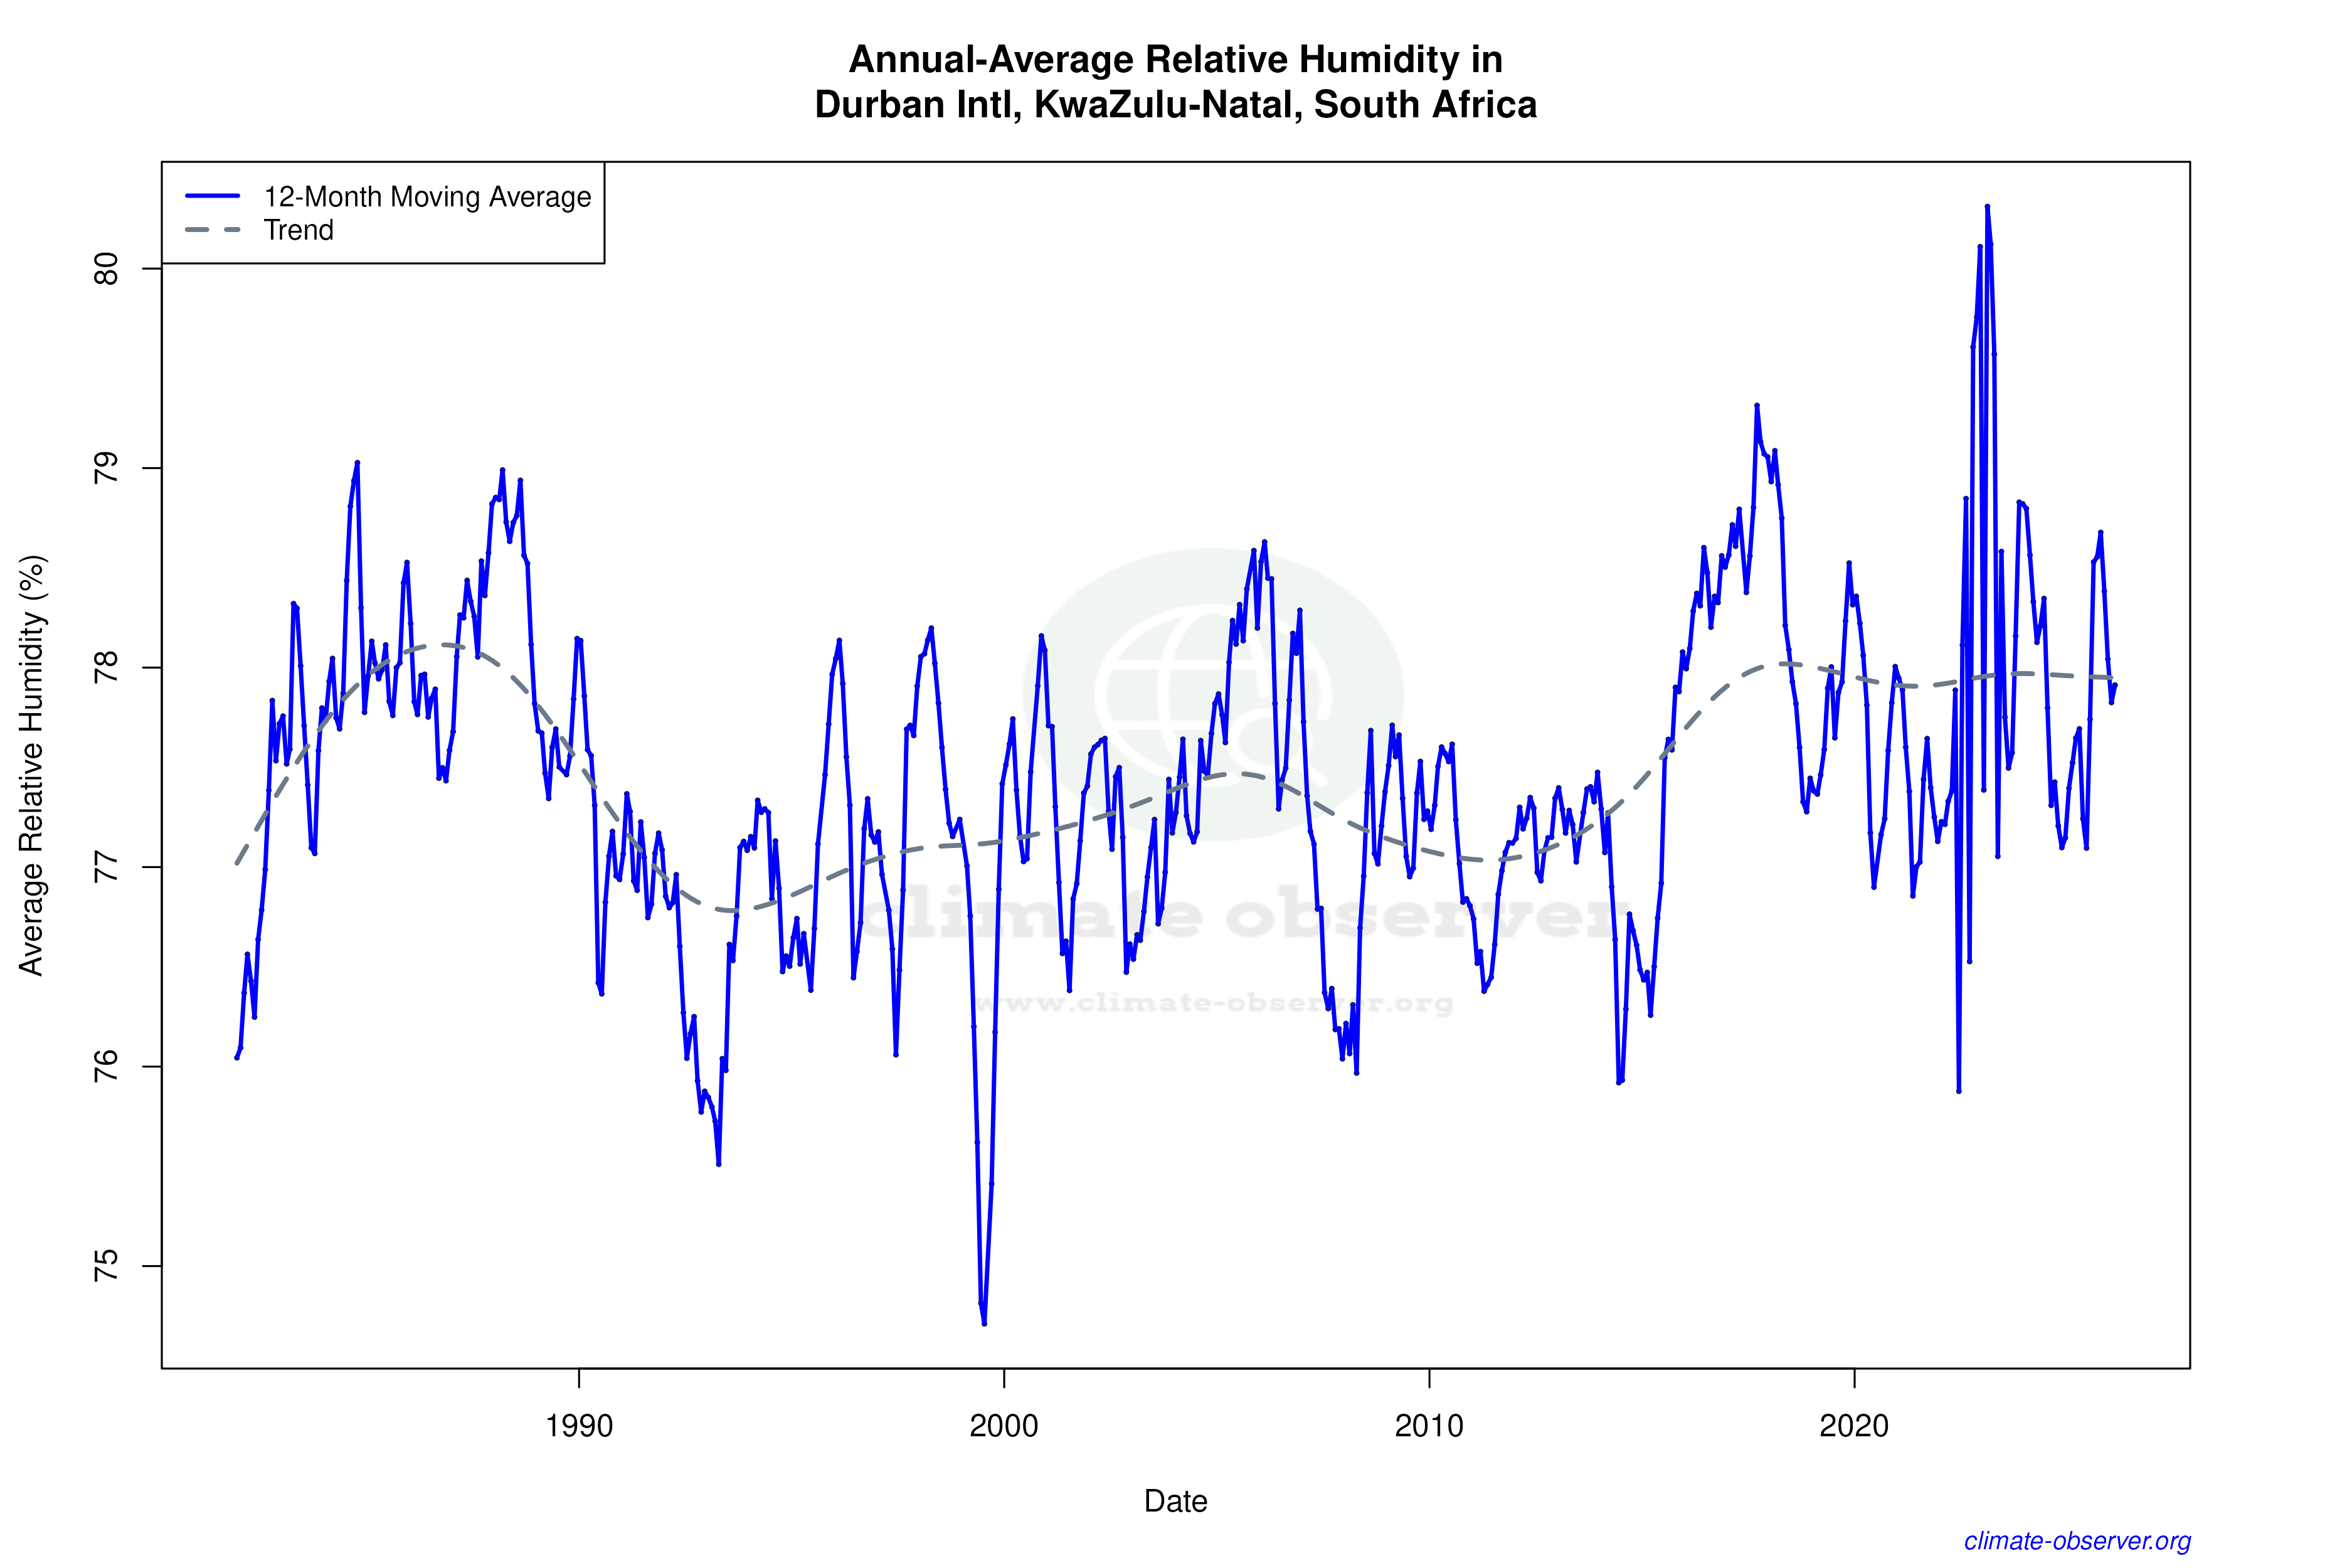

Max Temperature 12-Month MA | 1 of 6
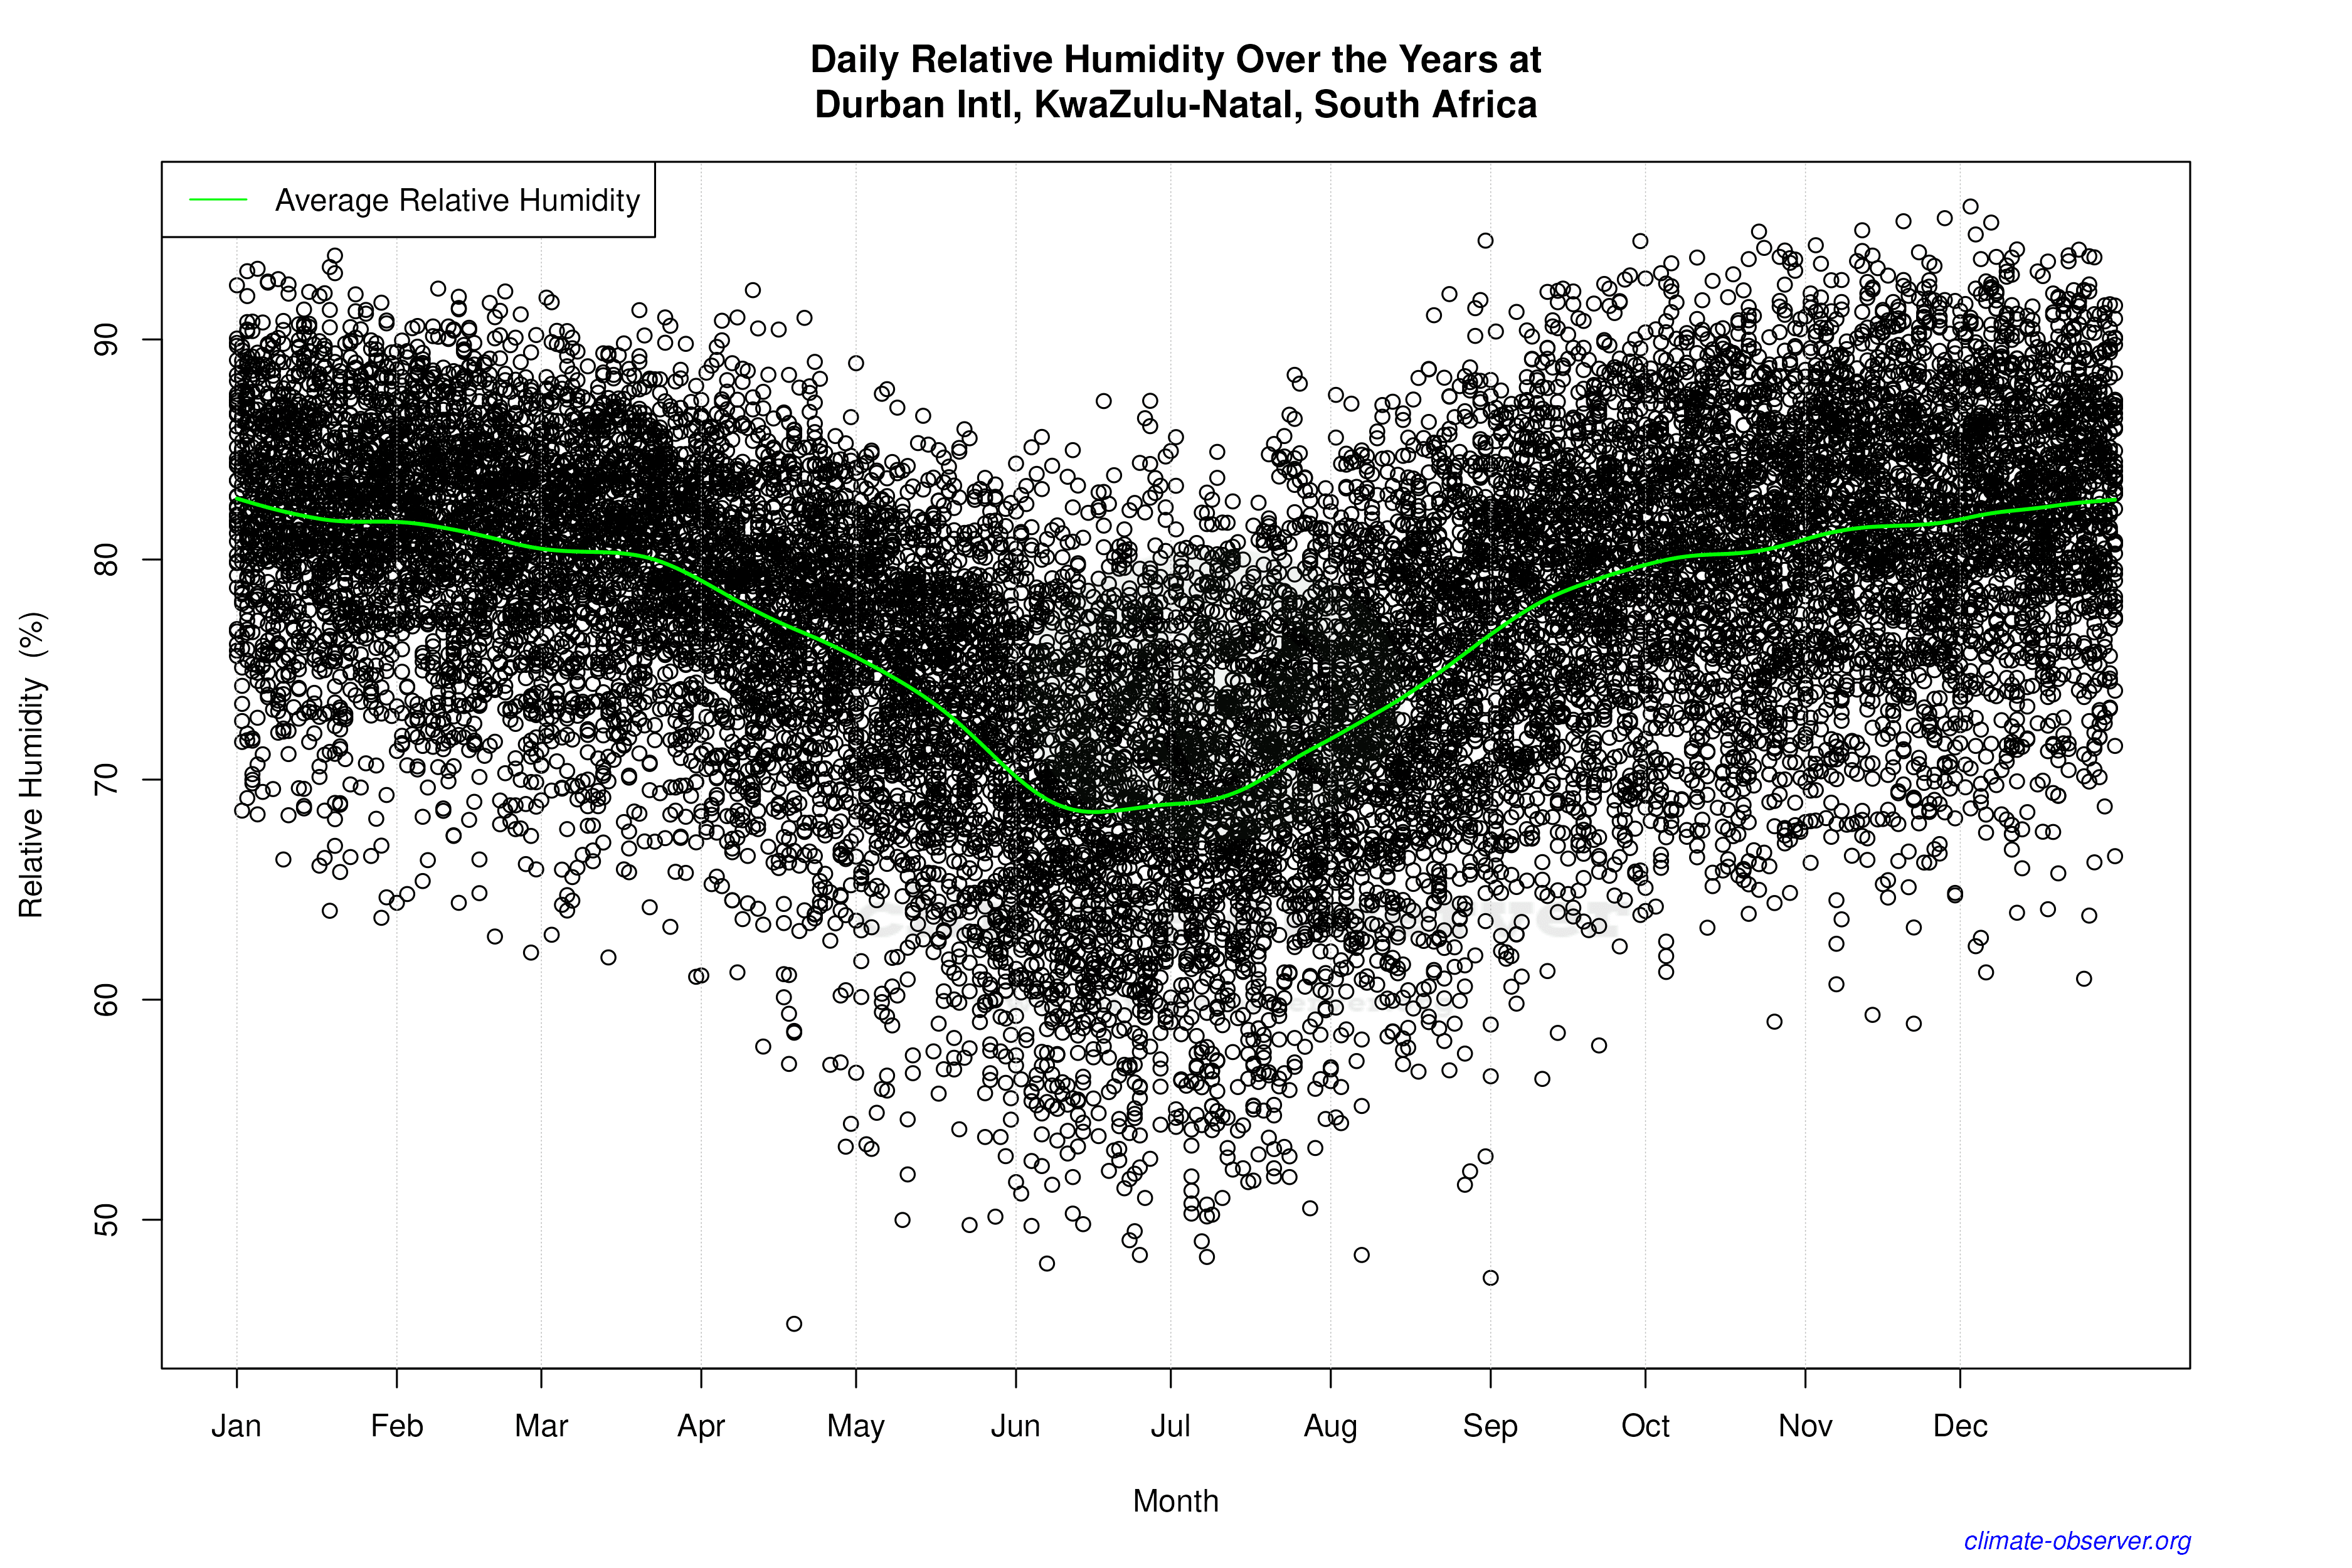
Daily Data Points and Averages Throughout the Year

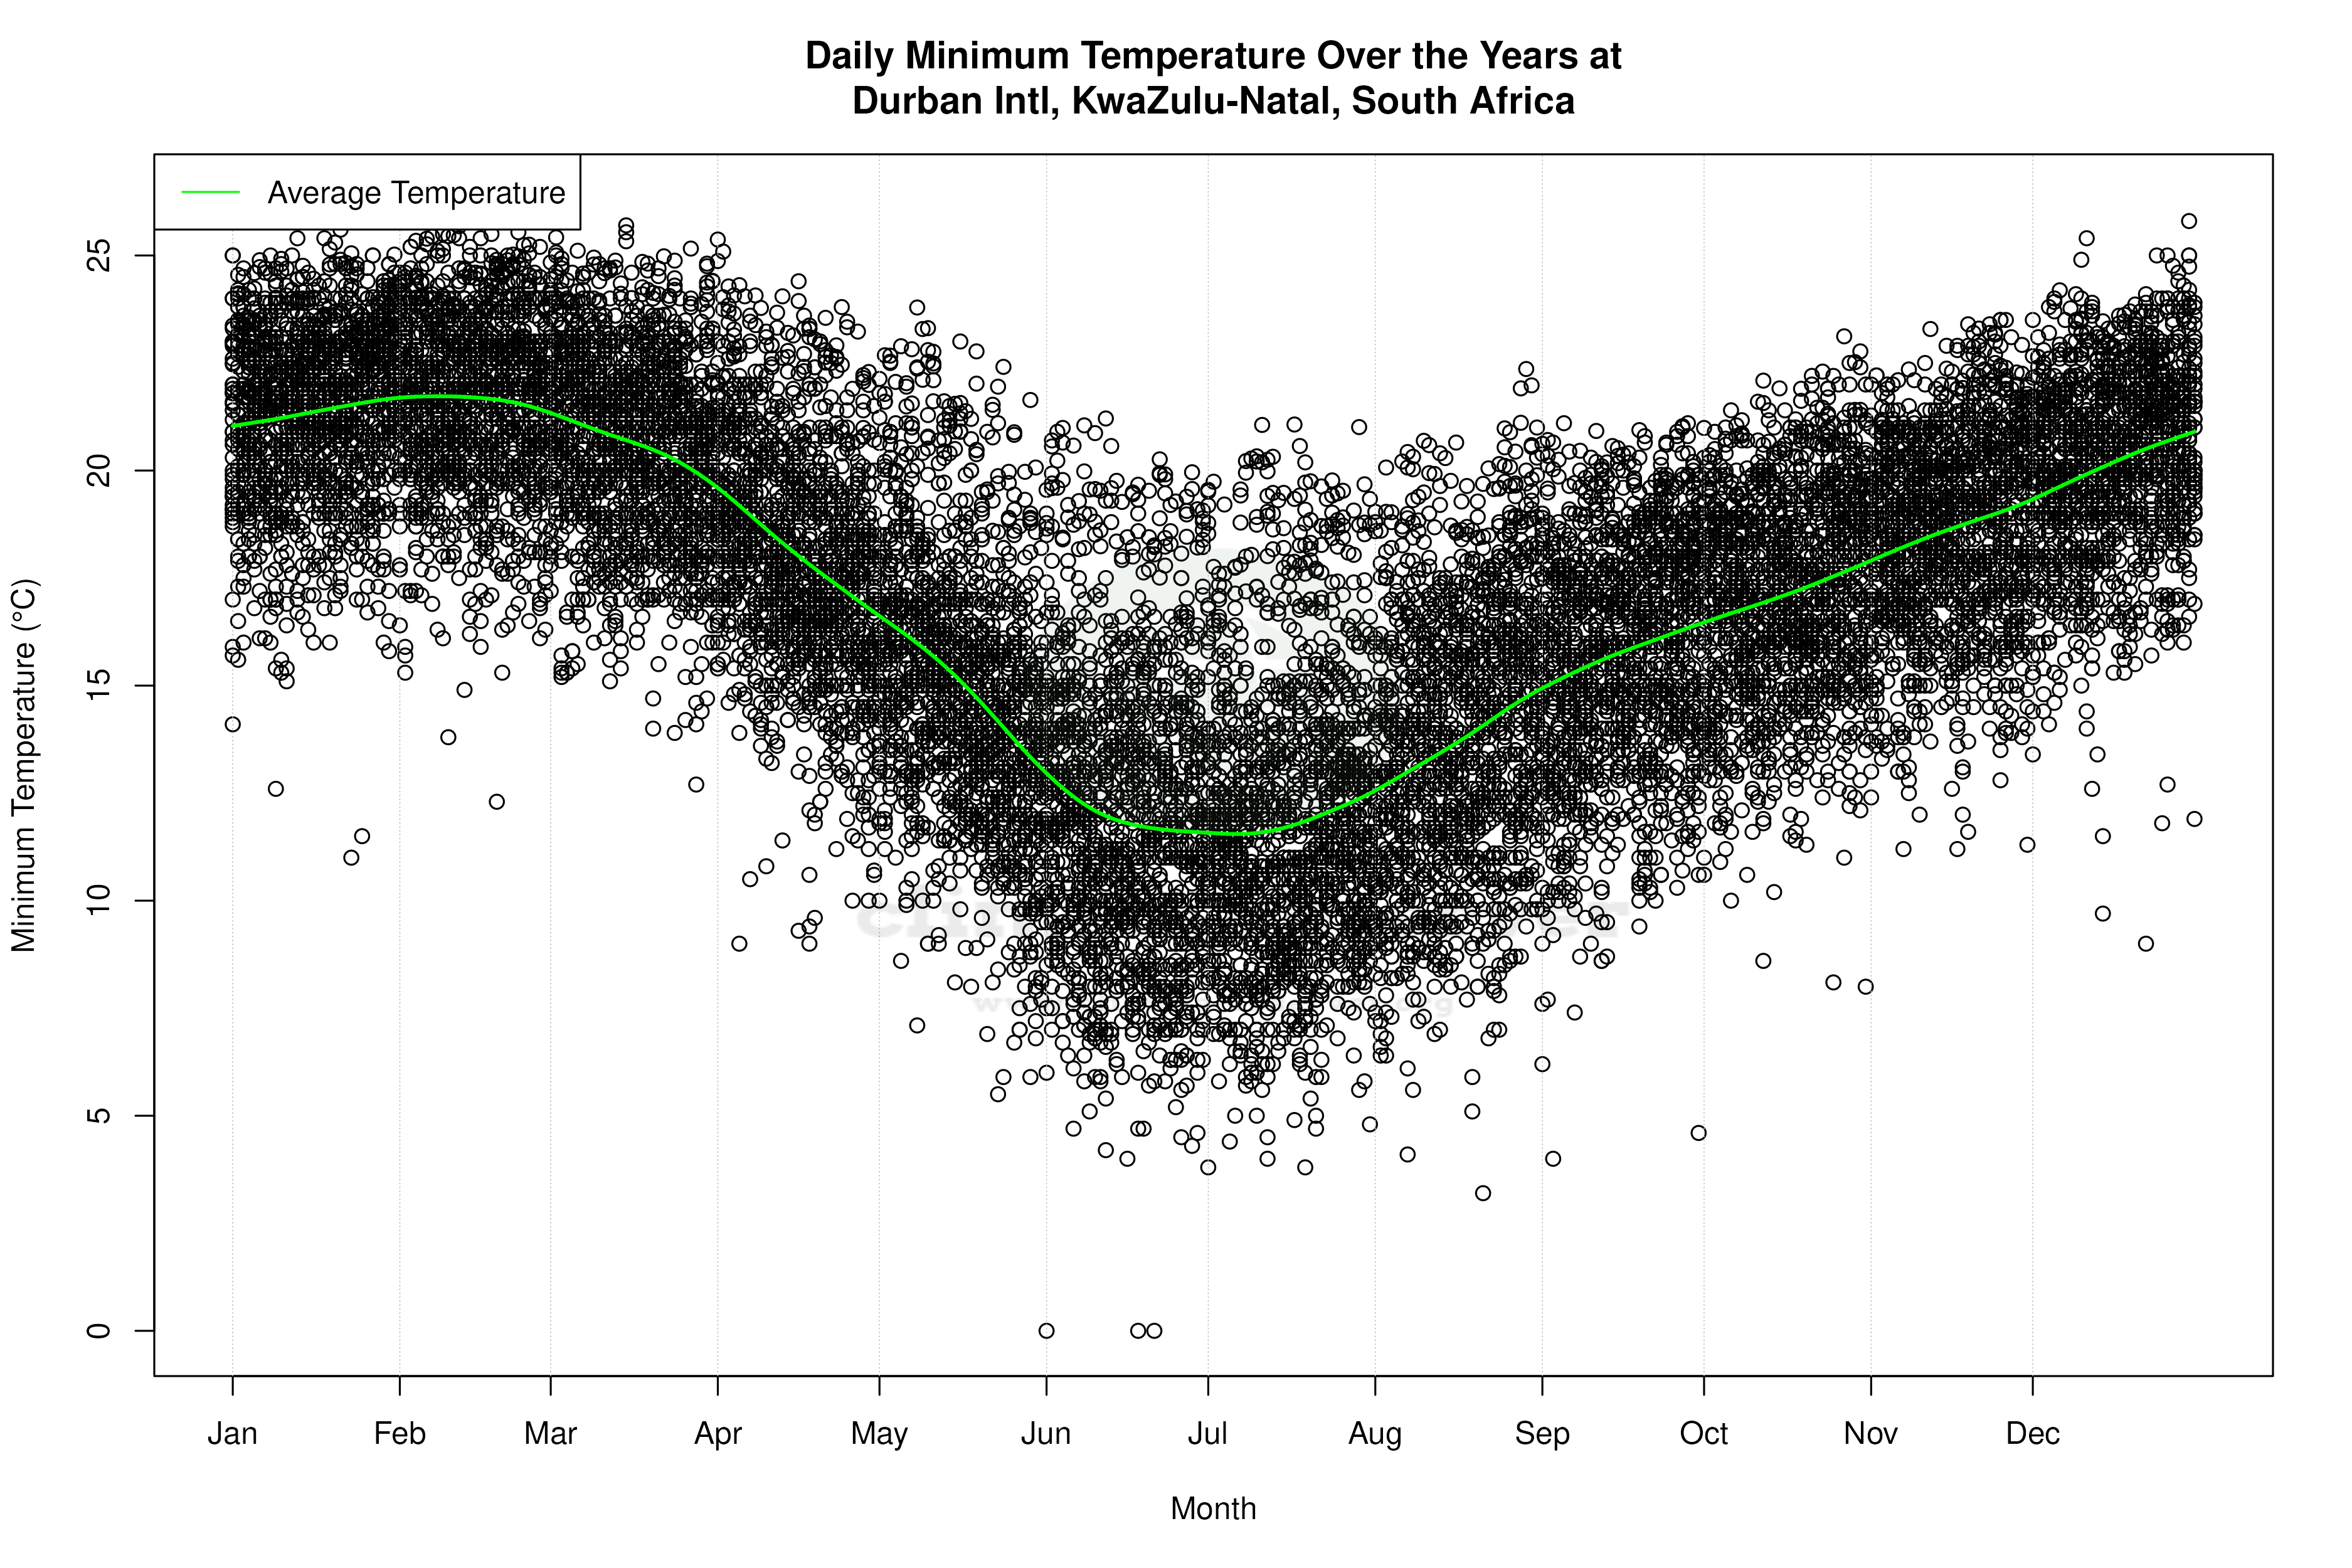


Average Max Temperature Throughout Year | 1 of 5
