Climate for Station: Cape Town Intl, Western Cape, South Africa
Loading live weather...
Climate Analysis & Overview
Cape Town International Airport is experiencing a complex climate narrative marked by cooling highs and warming lows. The precipitation pattern is becoming slightly more concentrated, suggesting a shift in rainfall distribution. This dynamic interplay of factors is set against the backdrop of South Africa's climate goals, which aim to balance economic growth with environmental sustainability.
A Tale of Two Trends
Cape Town International Airport, located at the coordinates -33.965, 18.602, is situated within a Mediterranean climate zone, classified as Csb under the Köppen system. This climate is characterised by warm, dry summers and mild, wet winters, influenced heavily by the nearby Atlantic Ocean and the surrounding mountainous terrain, which can create microclimates. Over the past decade, the region has seen a dichotomy in temperature trends: while the highs have cooled by 0.29°C (0.52°F), the lows have warmed by 0.62°C (1.12°F). This divergence suggests a narrowing of the daily temperature range, which could impact local ecosystems and energy demands.
Long-term Cooling Amidst Warming Lows
When examining the all-time trends, a subtle cooling of the highs by 0.01°C (0.02°F) is evident, juxtaposed against a more pronounced warming of the lows by 0.36°C (0.64°F). This pattern indicates a long-term shift where nights are becoming warmer, even as daytime temperatures show a slight decline. Such changes could have implications for agriculture, water resources, and urban planning, especially as South Africa continues to navigate its climate commitments.
Record Extremes and Their Implications
The airport has recorded extreme temperatures with a maximum of 42.4°C (108.3°F) and a minimum of -4.6°C (23.7°F). These extremes highlight the potential for significant weather variability, which can challenge infrastructure and emergency preparedness. As climate models predict increased frequency of such extremes, understanding these records becomes crucial for future resilience planning.
Shifting Rainfall Patterns
The Precipitation Concentration Index (PCI) has seen a slight increase from a baseline of 15.19 to a current value of 16.11. This suggests that rainfall is becoming slightly more concentrated in fewer events, which can lead to challenges such as flooding or droughts, depending on the timing and intensity of these events. While not yet highly concentrated, this trend warrants attention as it could influence water management strategies in the region.
Regional Climate Goals and Future Outlook
As South Africa strives to meet its climate goals, which include reducing greenhouse gas emissions and promoting sustainable development, the data from Cape Town International Airport offers valuable insights. The cooling of highs and warming of lows, along with changing precipitation patterns, underscores the need for adaptive strategies that consider both mitigation and adaptation. The interplay of these factors will be crucial in shaping the region's climate resilience and sustainability efforts.
Station Statistics
10-Year Trend
High: -0.46 °C/decade
Low: +0.85 °C/decade
Rain: -0.43 mm/decade
25-Year Trend
High: -0.17 °C/decade
Low: +0.39 °C/decade
Rain: -0.01 mm/decade
50-Year Trend
High: -0.02 °C/decade
Low: +0.36 °C/decade
Rain: +0.00 mm/decade
All-Time Trend
High: -0.02 °C/decade
Low: +0.36 °C/decade
Rain: +0.00 mm/decade
Percentage Above-Average Days
Last 12 Months: 40.8%
This Year: 24.4%
Precipitation Concentration Index (PCI) ℹ️
Last 12 Months: 18.4
Historical Average: 14.5
Percentile Rank of Last 12 Months ℹ️
High: 13th percentile
Low: 99th percentile
Rain: 32nd percentile
Change in Variance ℹ️
High: -5.2%
Low: -6.2%
Intraday: -6.5%
Data Coverage
90.8%
First Year of Data
1973
Station Location
Historical Weather Records
| Max High | Avg High | Min High | Max Avg | Avg Avg | Min Avg | Max Low | Avg Low | Min Low | Max Precipitation | Avg Precipitation | Max Snow | Avg Snow | |
|---|---|---|---|---|---|---|---|---|---|---|---|---|---|
| Record | 42.4 °C | — | 10.5 °C | 29.8 °C | — | 5.0 °C | 22.4 °C | — | -4.6 °C | 90.6 mm | — | — | — |
| January | 41.3 °C | 27.5 °C | 19.7 °C | 29.1 °C | 21.3 °C | 14.7 °C | 22.0 °C | 16.5 °C | 7.8 °C | 35.1 mm | 0.6 mm | — | — |
| February | 37.4 °C | 27.9 °C | 17.7 °C | 29.8 °C | 21.2 °C | 15.1 °C | 22.4 °C | 16.4 °C | 6.2 °C | 26.9 mm | 0.6 mm | — | — |
| March | 42.4 °C | 26.6 °C | 18.2 °C | 28.8 °C | 19.8 °C | 12.2 °C | 21.7 °C | 14.9 °C | 1.0 °C | 30.8 mm | 0.9 mm | — | — |
| April | 37.4 °C | 24.2 °C | 15.2 °C | 28.4 °C | 17.4 °C | 10.7 °C | 21.0 °C | 12.3 °C | 0.0 °C | 55.1 mm | 1.6 mm | — | — |
| May | 33.7 °C | 21.3 °C | 13.1 °C | 24.2 °C | 15.0 °C | 7.9 °C | 18.0 °C | 10.2 °C | 0.0 °C | 90.6 mm | 2.3 mm | — | — |
| June | 31.0 °C | 19.0 °C | 11.2 °C | 21.8 °C | 13.1 °C | 5.3 °C | 17.9 °C | 8.2 °C | -0.4 °C | 89.9 mm | 3.4 mm | — | — |
| July | 30.3 °C | 18.3 °C | 10.5 °C | 20.9 °C | 12.5 °C | 5.0 °C | 15.0 °C | 7.4 °C | -4.6 °C | 65.7 mm | 3.2 mm | — | — |
| August | 31.5 °C | 18.8 °C | 11.4 °C | 21.3 °C | 12.9 °C | 7.2 °C | 15.0 °C | 7.9 °C | -0.2 °C | 59.9 mm | 2.7 mm | — | — |
| September | 37.1 °C | 20.2 °C | 12.4 °C | 23.2 °C | 14.4 °C | 9.1 °C | 16.8 °C | 9.3 °C | 0.6 °C | 42.4 mm | 1.6 mm | — | — |
| October | 37.2 °C | 22.9 °C | 13.3 °C | 28.0 °C | 16.6 °C | 9.8 °C | 20.6 °C | 11.3 °C | 0.0 °C | 46.6 mm | 1.1 mm | — | — |
| November | 38.7 °C | 24.5 °C | 15.3 °C | 26.8 °C | 18.4 °C | 10.9 °C | 20.3 °C | 13.5 °C | 3.4 °C | 83.3 mm | 1.1 mm | — | — |
| December | 39.1 °C | 26.3 °C | 18.3 °C | 27.7 °C | 20.3 °C | 12.6 °C | 21.0 °C | 15.5 °C | 6.2 °C | 35.6 mm | 0.6 mm | — | — |
Data Visualisations
Remove WatermarksCurrent Year Climate Trends vs Historical


Max Temperature this Year | 1 of 6
Climate 12-Month Moving Averages


Max Temperature 12-Month MA | 1 of 6
Daily Data Points and Averages Throughout the Year
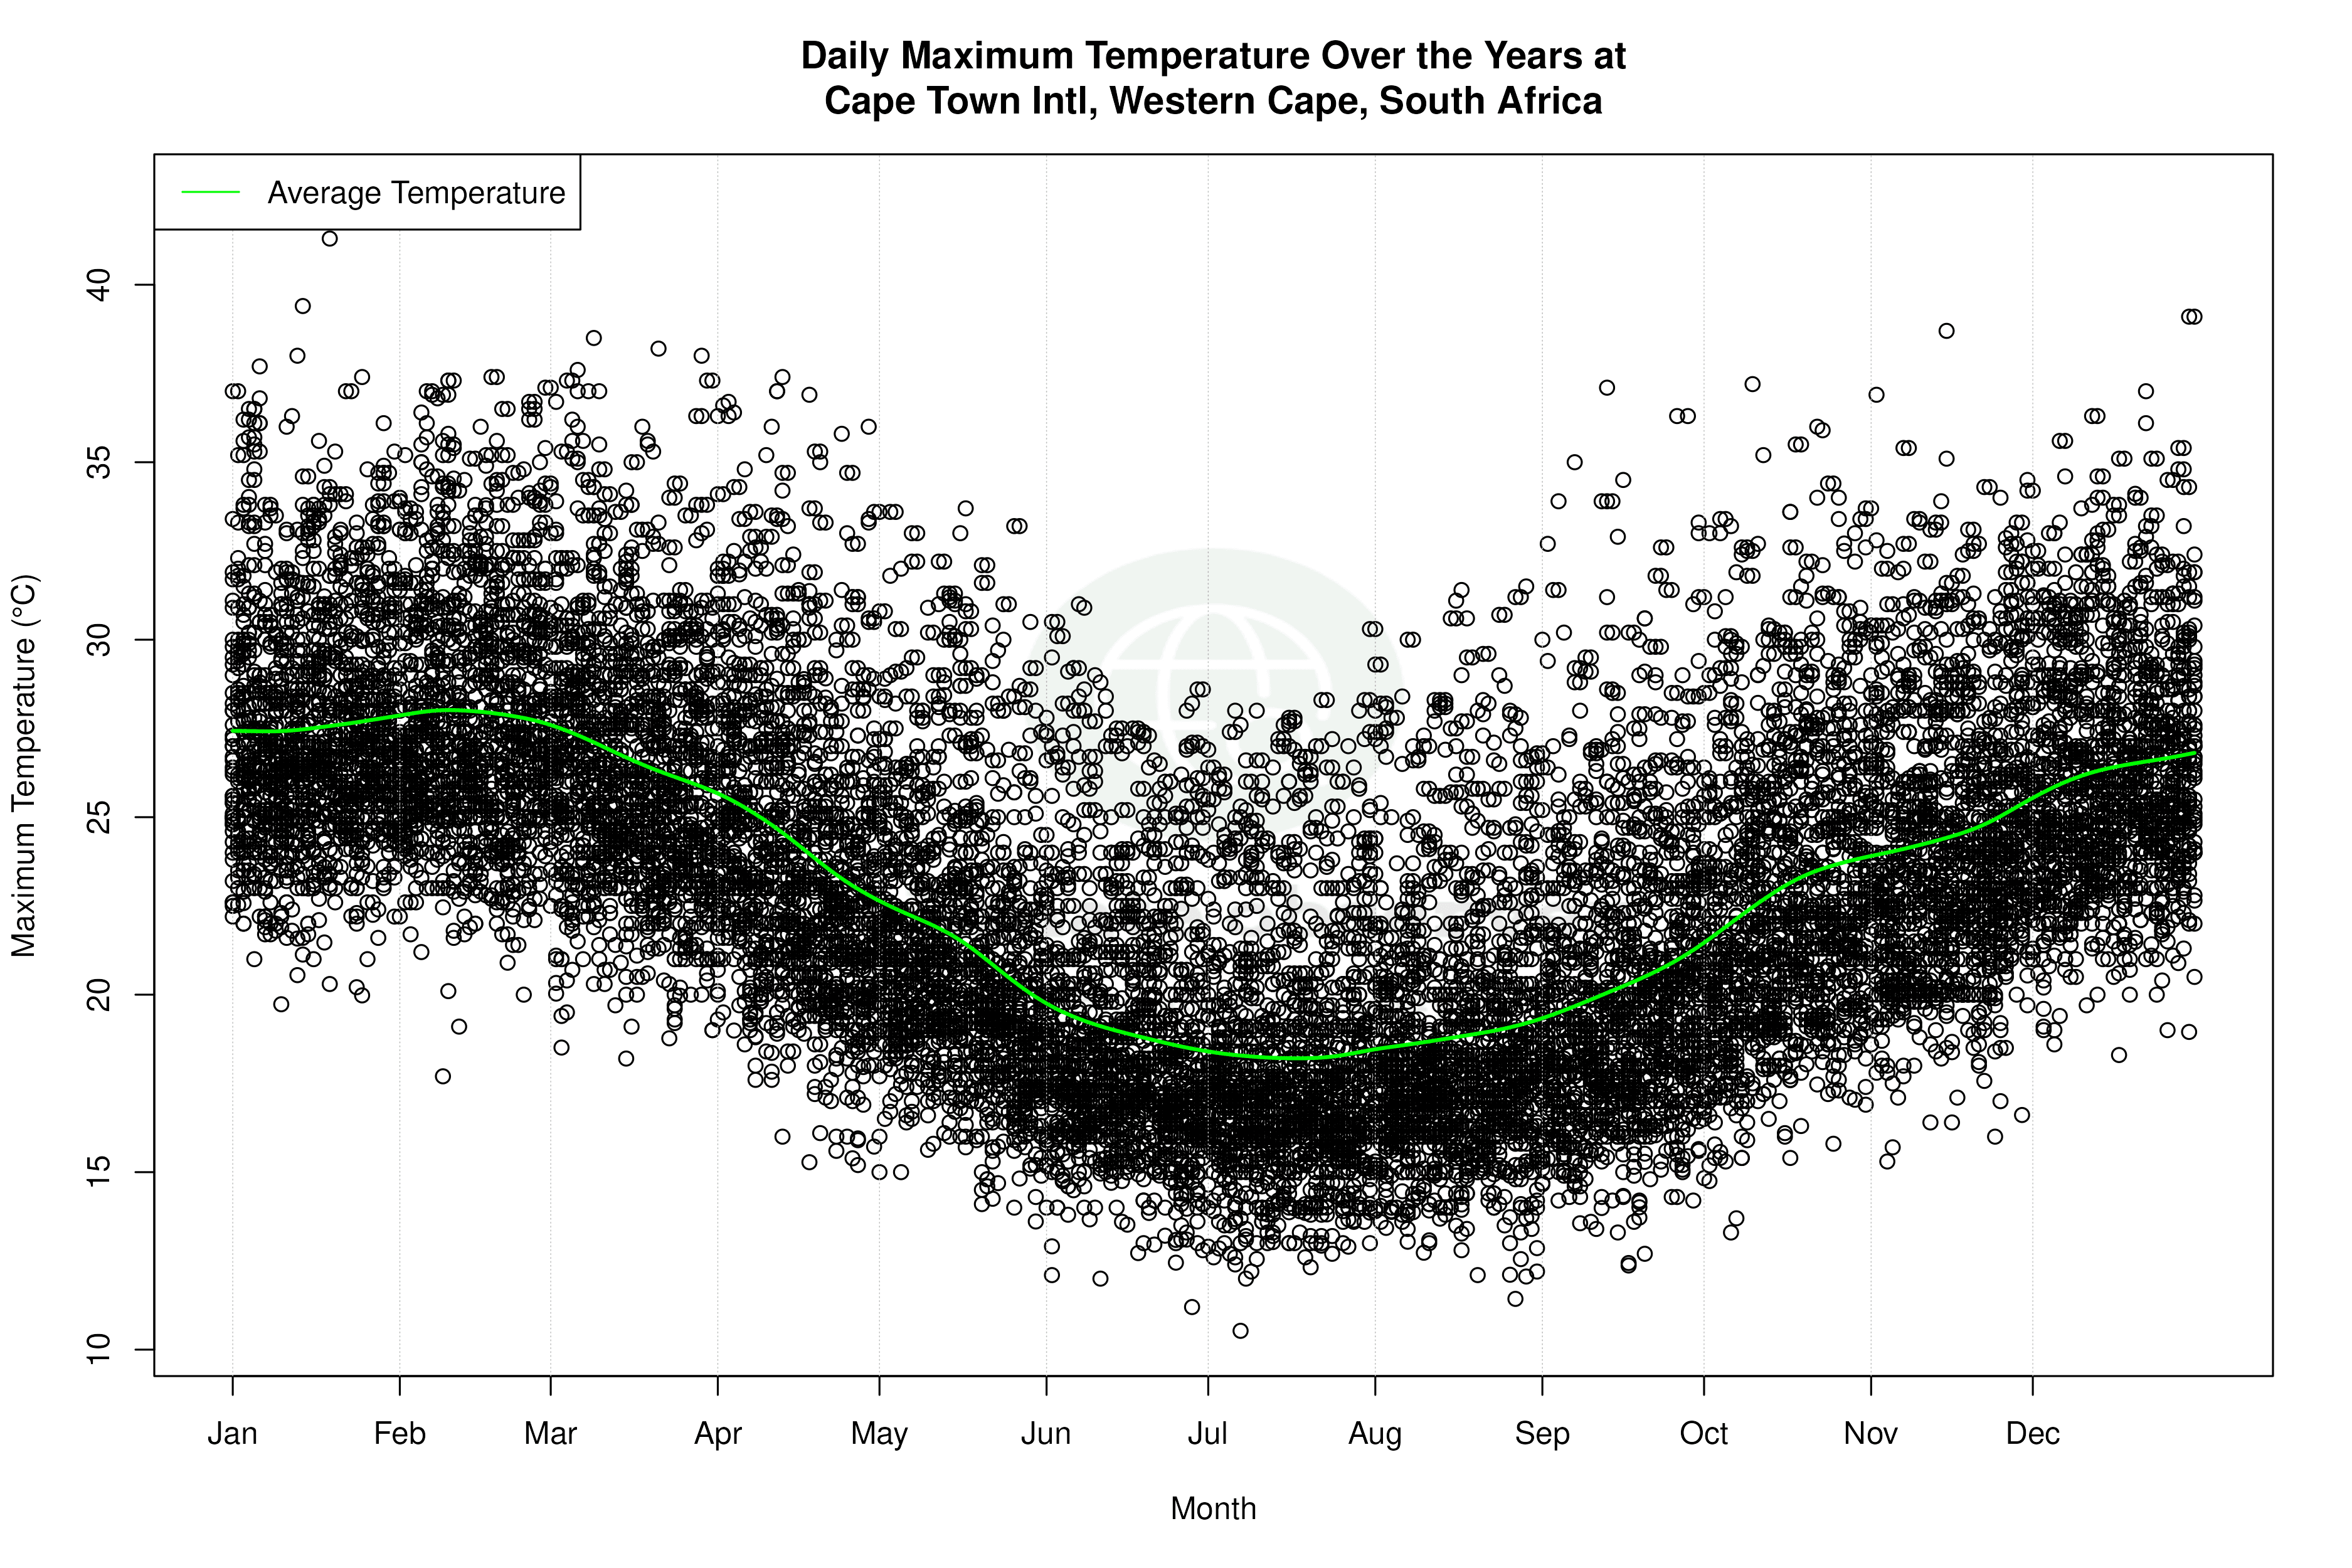


Average Max Temperature Throughout Year | 1 of 5
