Climate for Station: Linguere, Louga, Senegal
Loading live weather...
Climate Analysis & Overview
Linguère is experiencing a warming trend, with notable increases in both high and low temperatures over the past decade. Precipitation patterns are becoming slightly more even, although the region remains characterised by concentrated rainfall events.
Warming Trends in Linguère
Situated in the Sahel region of Senegal, Linguère falls under the Köppen climate classification of a hot semi-arid climate (BSh). The region is experiencing significant warming, particularly in the last decade. Over the past ten years, high temperatures have increased by 0.44°C (0.79°F), while low temperatures have risen by 0.71°C (1.28°F). These recent trends suggest an accelerated warming compared to the all-time trends, where highs have risen by 0.09°C (0.16°F) and lows by 0.42°C (0.76°F). This warming is consistent with broader regional patterns observed in West Africa, which are influenced by global climate change and local geographic factors such as the Sahara Desert's proximity.
Temperature Extremes and Records
Linguère's temperature records reflect its harsh climate. The highest recorded temperature is a scorching 50.0°C (122.0°F), while the lowest dips to a chilly 5.4°C (41.7°F). These extremes highlight the region's vulnerability to temperature variability, which can impact agriculture and water resources. The increasing trend in both high and low temperatures suggests that such extremes may become more frequent, posing challenges to local communities and ecosystems.
Precipitation Patterns and Changes
The Precipitation Concentration Index (PCI) for Linguère indicates a slight shift towards more evenly distributed rainfall. The baseline PCI was 31.9, while the current PCI is 30.1. Although this represents a marginal decrease, the PCI remains high, indicating that rainfall events are still concentrated within a few intense periods. This pattern is typical for semi-arid regions, where rain falls predominantly during a short wet season. The slight decrease in PCI suggests a minor shift towards more consistent rainfall, which could benefit agriculture by reducing the risk of droughts and floods.
Regional Climate Goals and Implications
Senegal is actively pursuing climate resilience strategies, focusing on sustainable agriculture and water management to combat the impacts of climate change. The warming trends and precipitation changes in Linguère underscore the importance of these initiatives. As temperatures continue to rise, adaptation measures such as drought-resistant crops and improved irrigation systems will be crucial. Furthermore, the slight shift towards more even precipitation distribution could offer opportunities for better water resource management, aligning with Senegal's broader climate goals.
Geographical Influences on Climate
Linguère's climate is heavily influenced by its geographical location. The proximity to the Sahara Desert contributes to its high temperatures and arid conditions. Additionally, the region's flat terrain allows for the rapid movement of air masses, which can lead to sudden temperature changes. These geographical factors, combined with the ongoing warming trends, highlight the complexity of climate dynamics in the region and the need for targeted research and policy interventions to mitigate adverse impacts.
Station Statistics
10-Year Trend
High: +0.22 °C/decade
Low: +0.90 °C/decade
Rain: -0.43 mm/decade
25-Year Trend
High: +0.20 °C/decade
Low: +0.04 °C/decade
Rain: +0.15 mm/decade
50-Year Trend
High: +0.25 °C/decade
Low: +0.09 °C/decade
Rain: +0.11 mm/decade
All-Time Trend
High: +0.10 °C/decade
Low: +0.42 °C/decade
Rain: +0.02 mm/decade
Percentage Above-Average Days
Last 12 Months: 47.4%
This Year: 57.8%
Precipitation Concentration Index (PCI) ℹ️
Last 12 Months: 31.2
Historical Average: 31.7
Percentile Rank of Last 12 Months ℹ️
High: 46th percentile
Low: 83rd percentile
Rain: 29th percentile
Change in Variance ℹ️
High: +4.8%
Low: -22.0%
Intraday: -17.9%
Data Coverage
81.5%
First Year of Data
1933
Station Location
Historical Weather Records
| Max High | Avg High | Min High | Max Avg | Avg Avg | Min Avg | Max Low | Avg Low | Min Low | Max Precipitation | Avg Precipitation | Max Snow | Avg Snow | |
|---|---|---|---|---|---|---|---|---|---|---|---|---|---|
| Record | 50.0 °C | — | 18.3 °C | 42.1 °C | — | 16.2 °C | 34.8 °C | — | 5.4 °C | 136.9 mm | — | — | — |
| January | 43.0 °C | 33.3 °C | 19.5 °C | 34.1 °C | 25.3 °C | 16.2 °C | 25.9 °C | 16.2 °C | 6.8 °C | 13.5 mm | 0.0 mm | — | — |
| February | 44.0 °C | 35.6 °C | 18.3 °C | 35.7 °C | 27.6 °C | 18.7 °C | 28.2 °C | 17.9 °C | 6.0 °C | 25.4 mm | 0.1 mm | — | — |
| March | 45.5 °C | 38.2 °C | 23.4 °C | 38.1 °C | 29.8 °C | 18.2 °C | 31.0 °C | 19.7 °C | 9.7 °C | 16.7 mm | 0.0 mm | — | — |
| April | 47.0 °C | 40.4 °C | 30.0 °C | 40.6 °C | 31.8 °C | 23.5 °C | 34.8 °C | 21.3 °C | 10.4 °C | 12.6 mm | 0.0 mm | — | — |
| May | 49.0 °C | 41.5 °C | 30.8 °C | 42.1 °C | 32.8 °C | 23.0 °C | 34.0 °C | 22.9 °C | 10.8 °C | 23.4 mm | 0.1 mm | — | — |
| June | 50.0 °C | 39.7 °C | 29.1 °C | 40.2 °C | 32.0 °C | 24.7 °C | 34.0 °C | 24.1 °C | 12.5 °C | 70.1 mm | 0.9 mm | — | — |
| July | 48.0 °C | 36.2 °C | 25.8 °C | 36.6 °C | 30.5 °C | 23.9 °C | 29.0 °C | 24.5 °C | 16.5 °C | 90.9 mm | 3.4 mm | — | — |
| August | 44.5 °C | 34.0 °C | 24.4 °C | 34.8 °C | 29.4 °C | 24.4 °C | 33.3 °C | 24.3 °C | 19.0 °C | 136.9 mm | 5.6 mm | — | — |
| September | 42.5 °C | 34.3 °C | 24.8 °C | 35.2 °C | 29.2 °C | 23.8 °C | 28.5 °C | 23.8 °C | 18.0 °C | 128.0 mm | 4.6 mm | — | — |
| October | 44.5 °C | 37.4 °C | 24.5 °C | 37.7 °C | 30.7 °C | 23.1 °C | 31.0 °C | 22.9 °C | 11.4 °C | 69.7 mm | 1.1 mm | — | — |
| November | 46.5 °C | 37.1 °C | 26.6 °C | 35.8 °C | 29.3 °C | 19.2 °C | 28.5 °C | 19.8 °C | 10.5 °C | 29.7 mm | 0.1 mm | — | — |
| December | 42.0 °C | 33.8 °C | 21.3 °C | 34.9 °C | 26.2 °C | 18.5 °C | 27.0 °C | 17.0 °C | 5.4 °C | 8.9 mm | 0.0 mm | — | — |
Data Visualisations
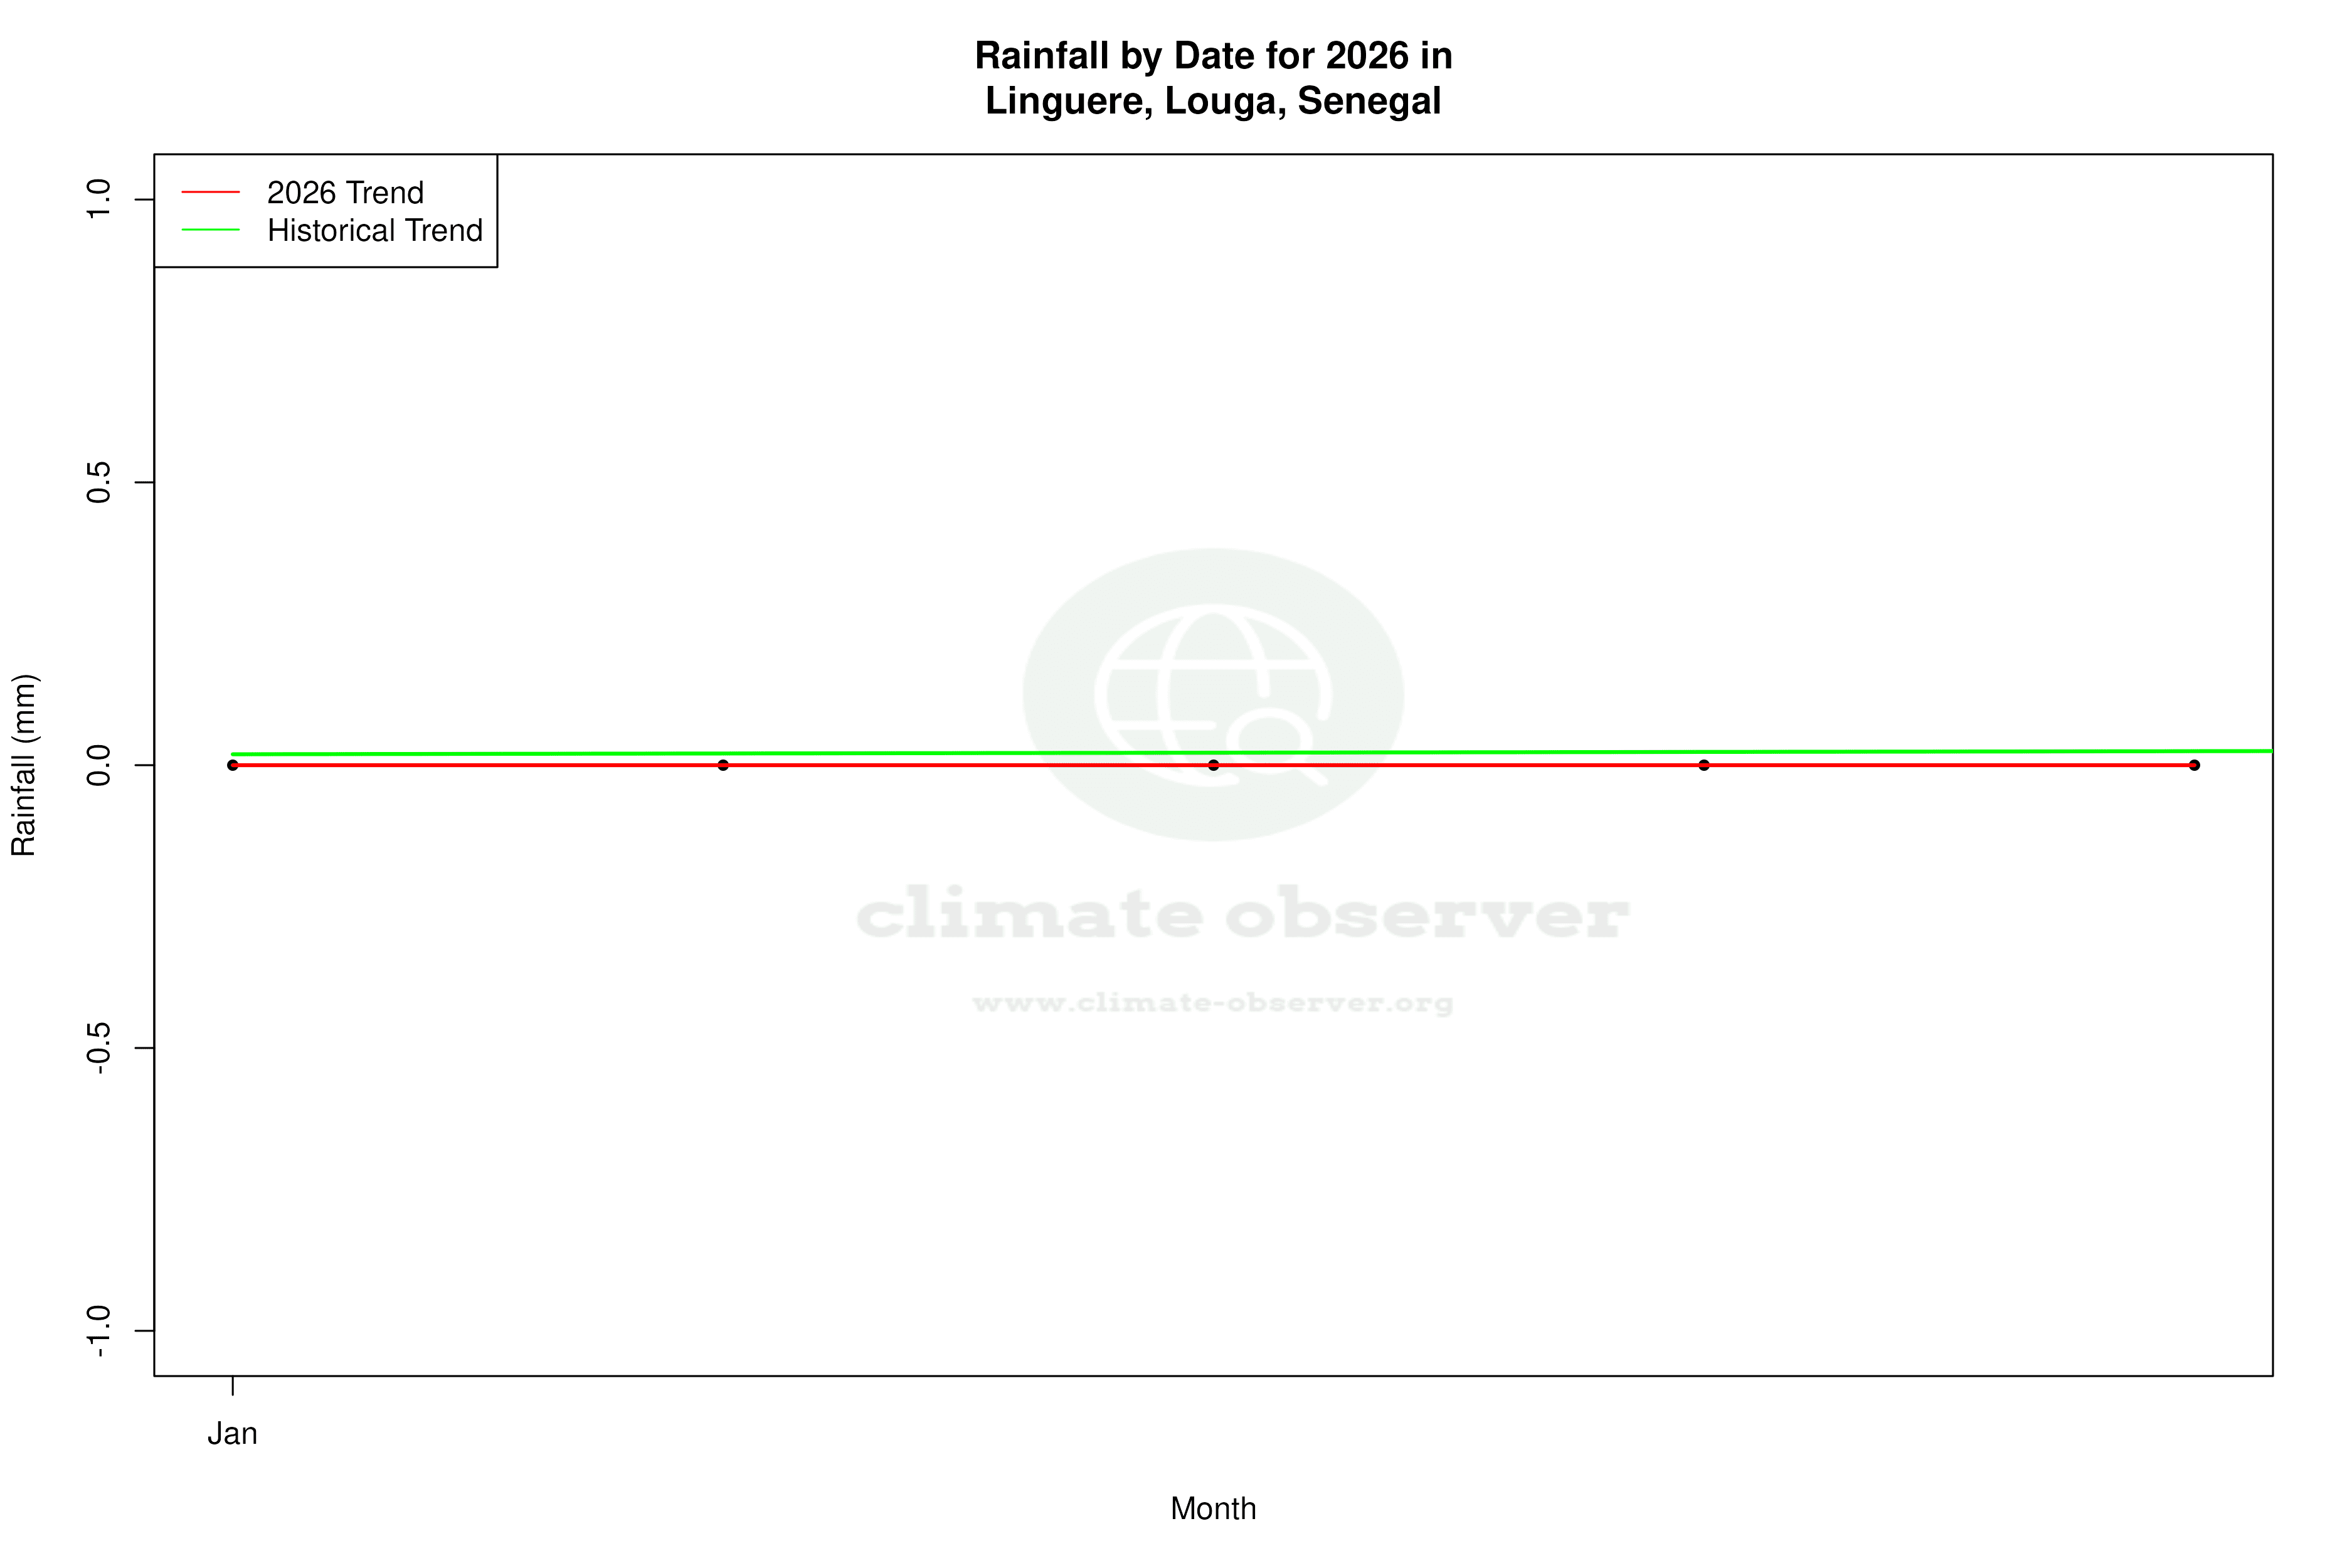
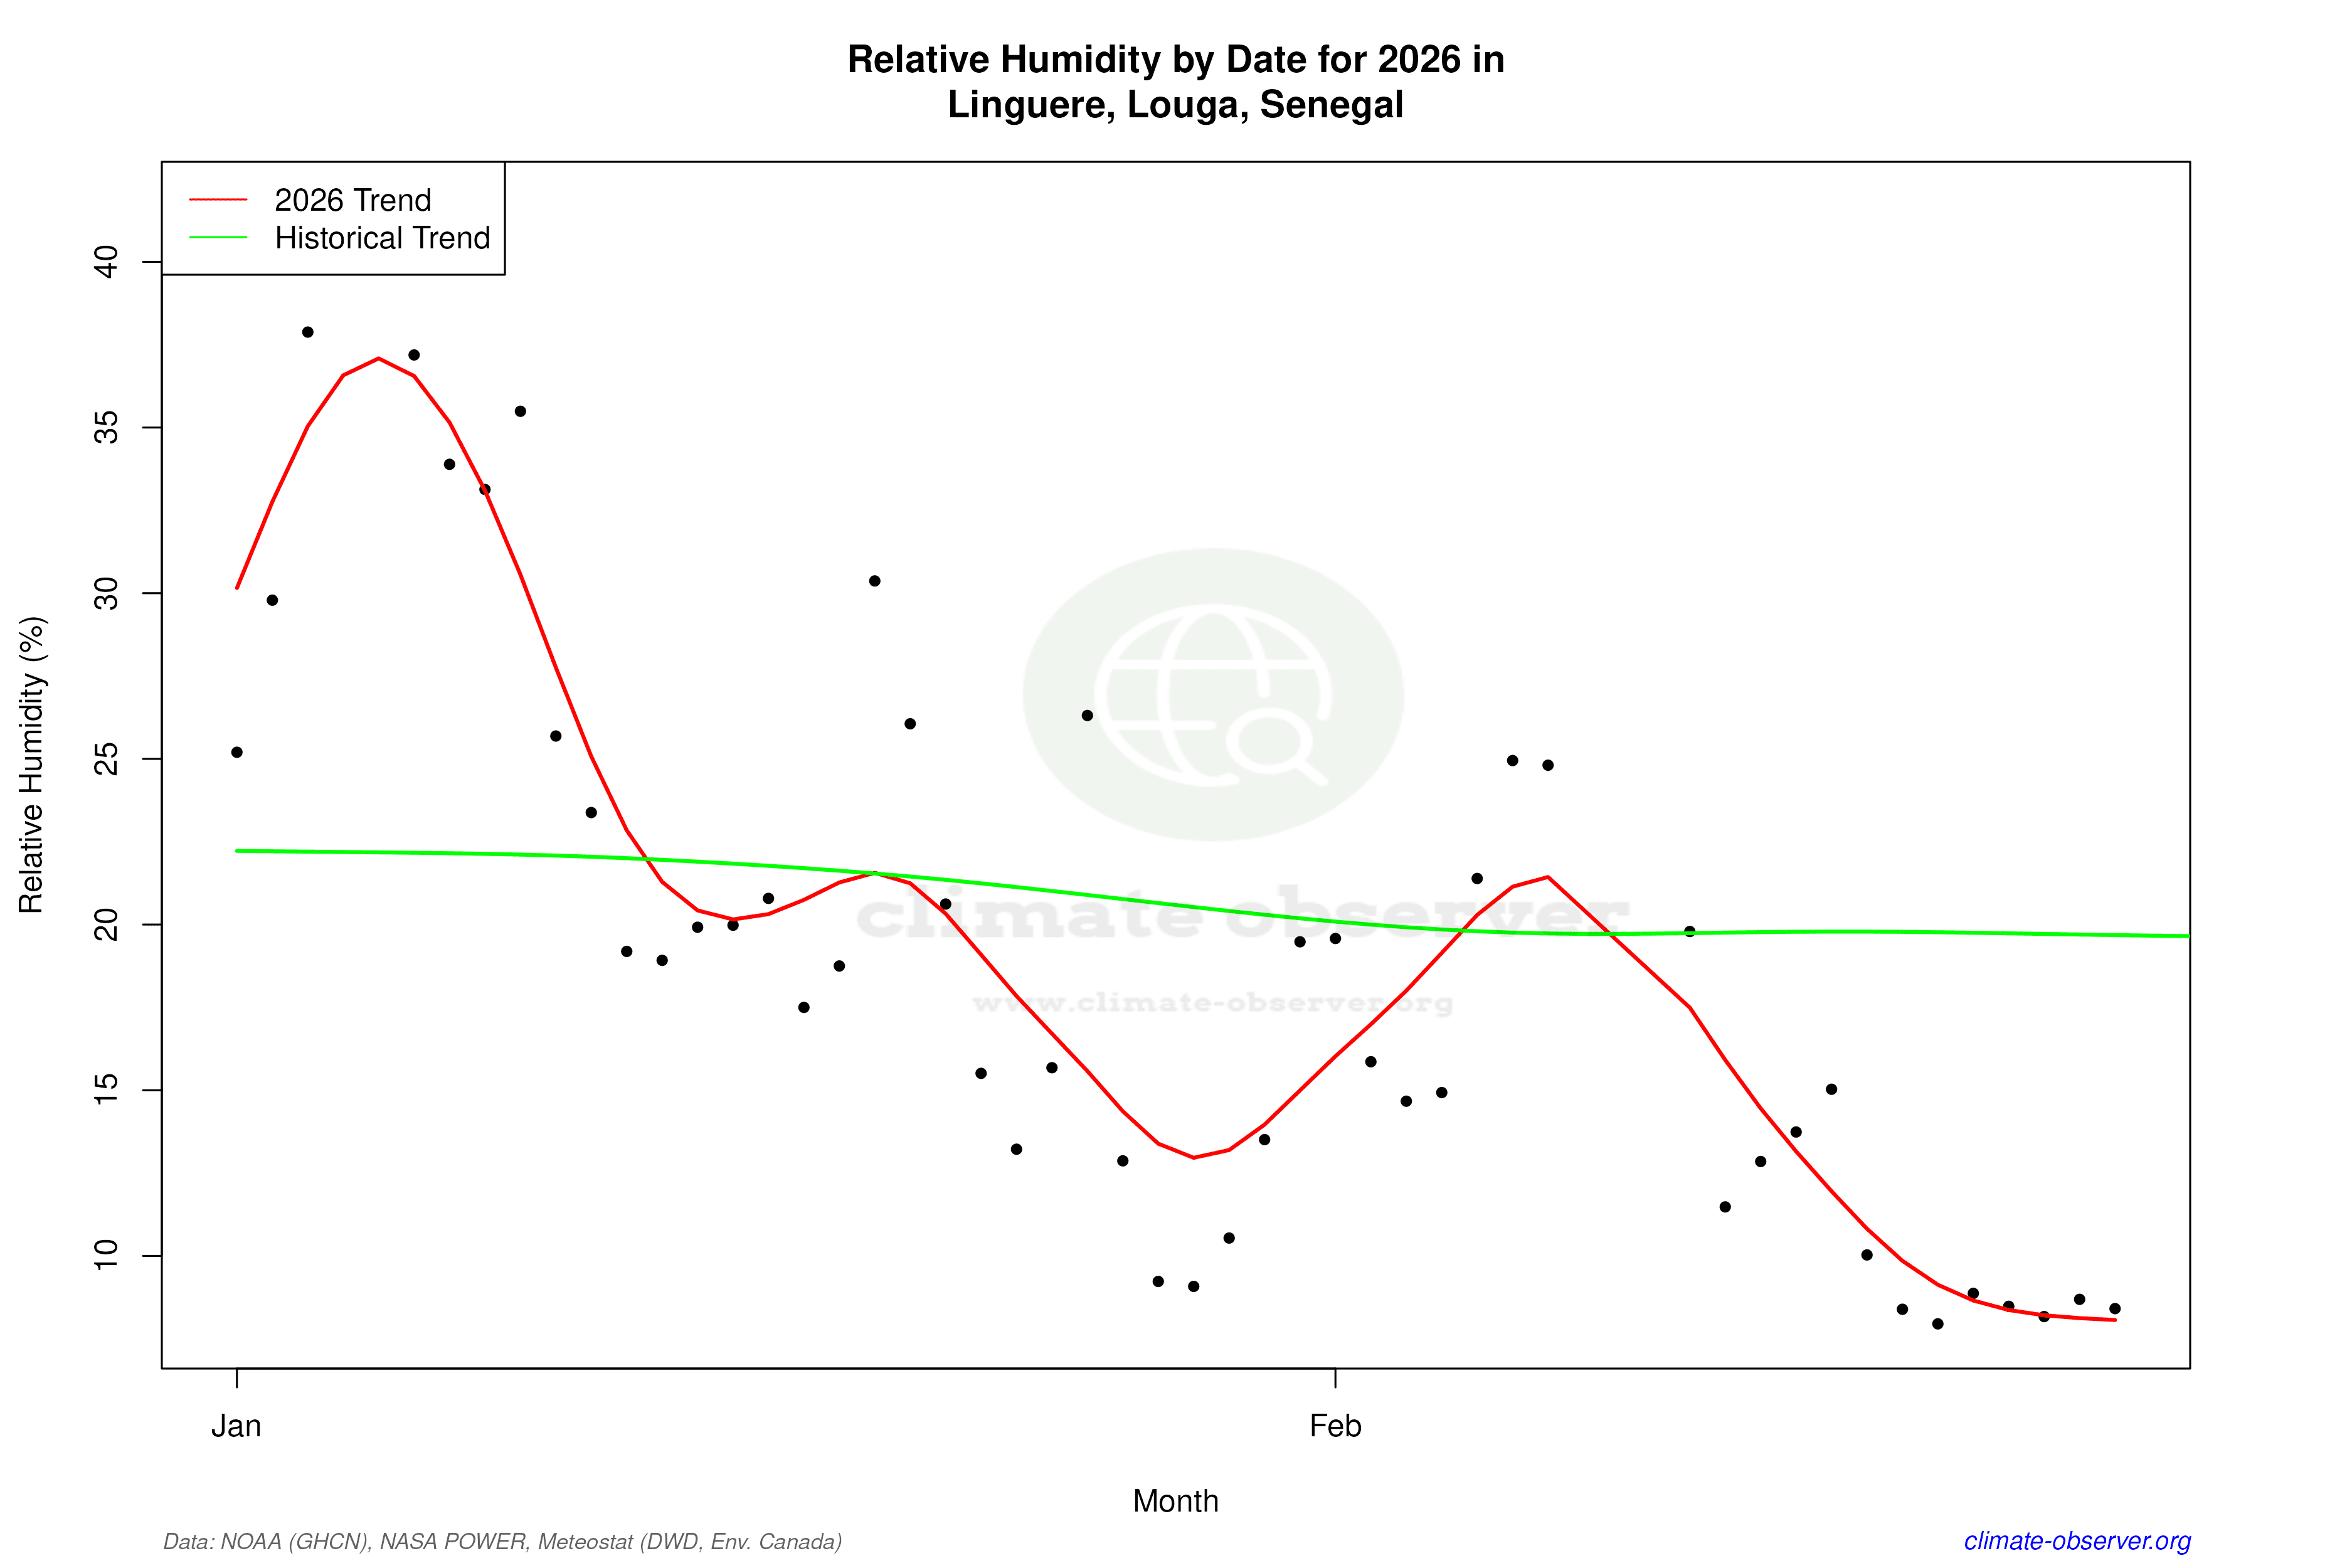
Remove WatermarksCurrent Year Climate Trends vs Historical
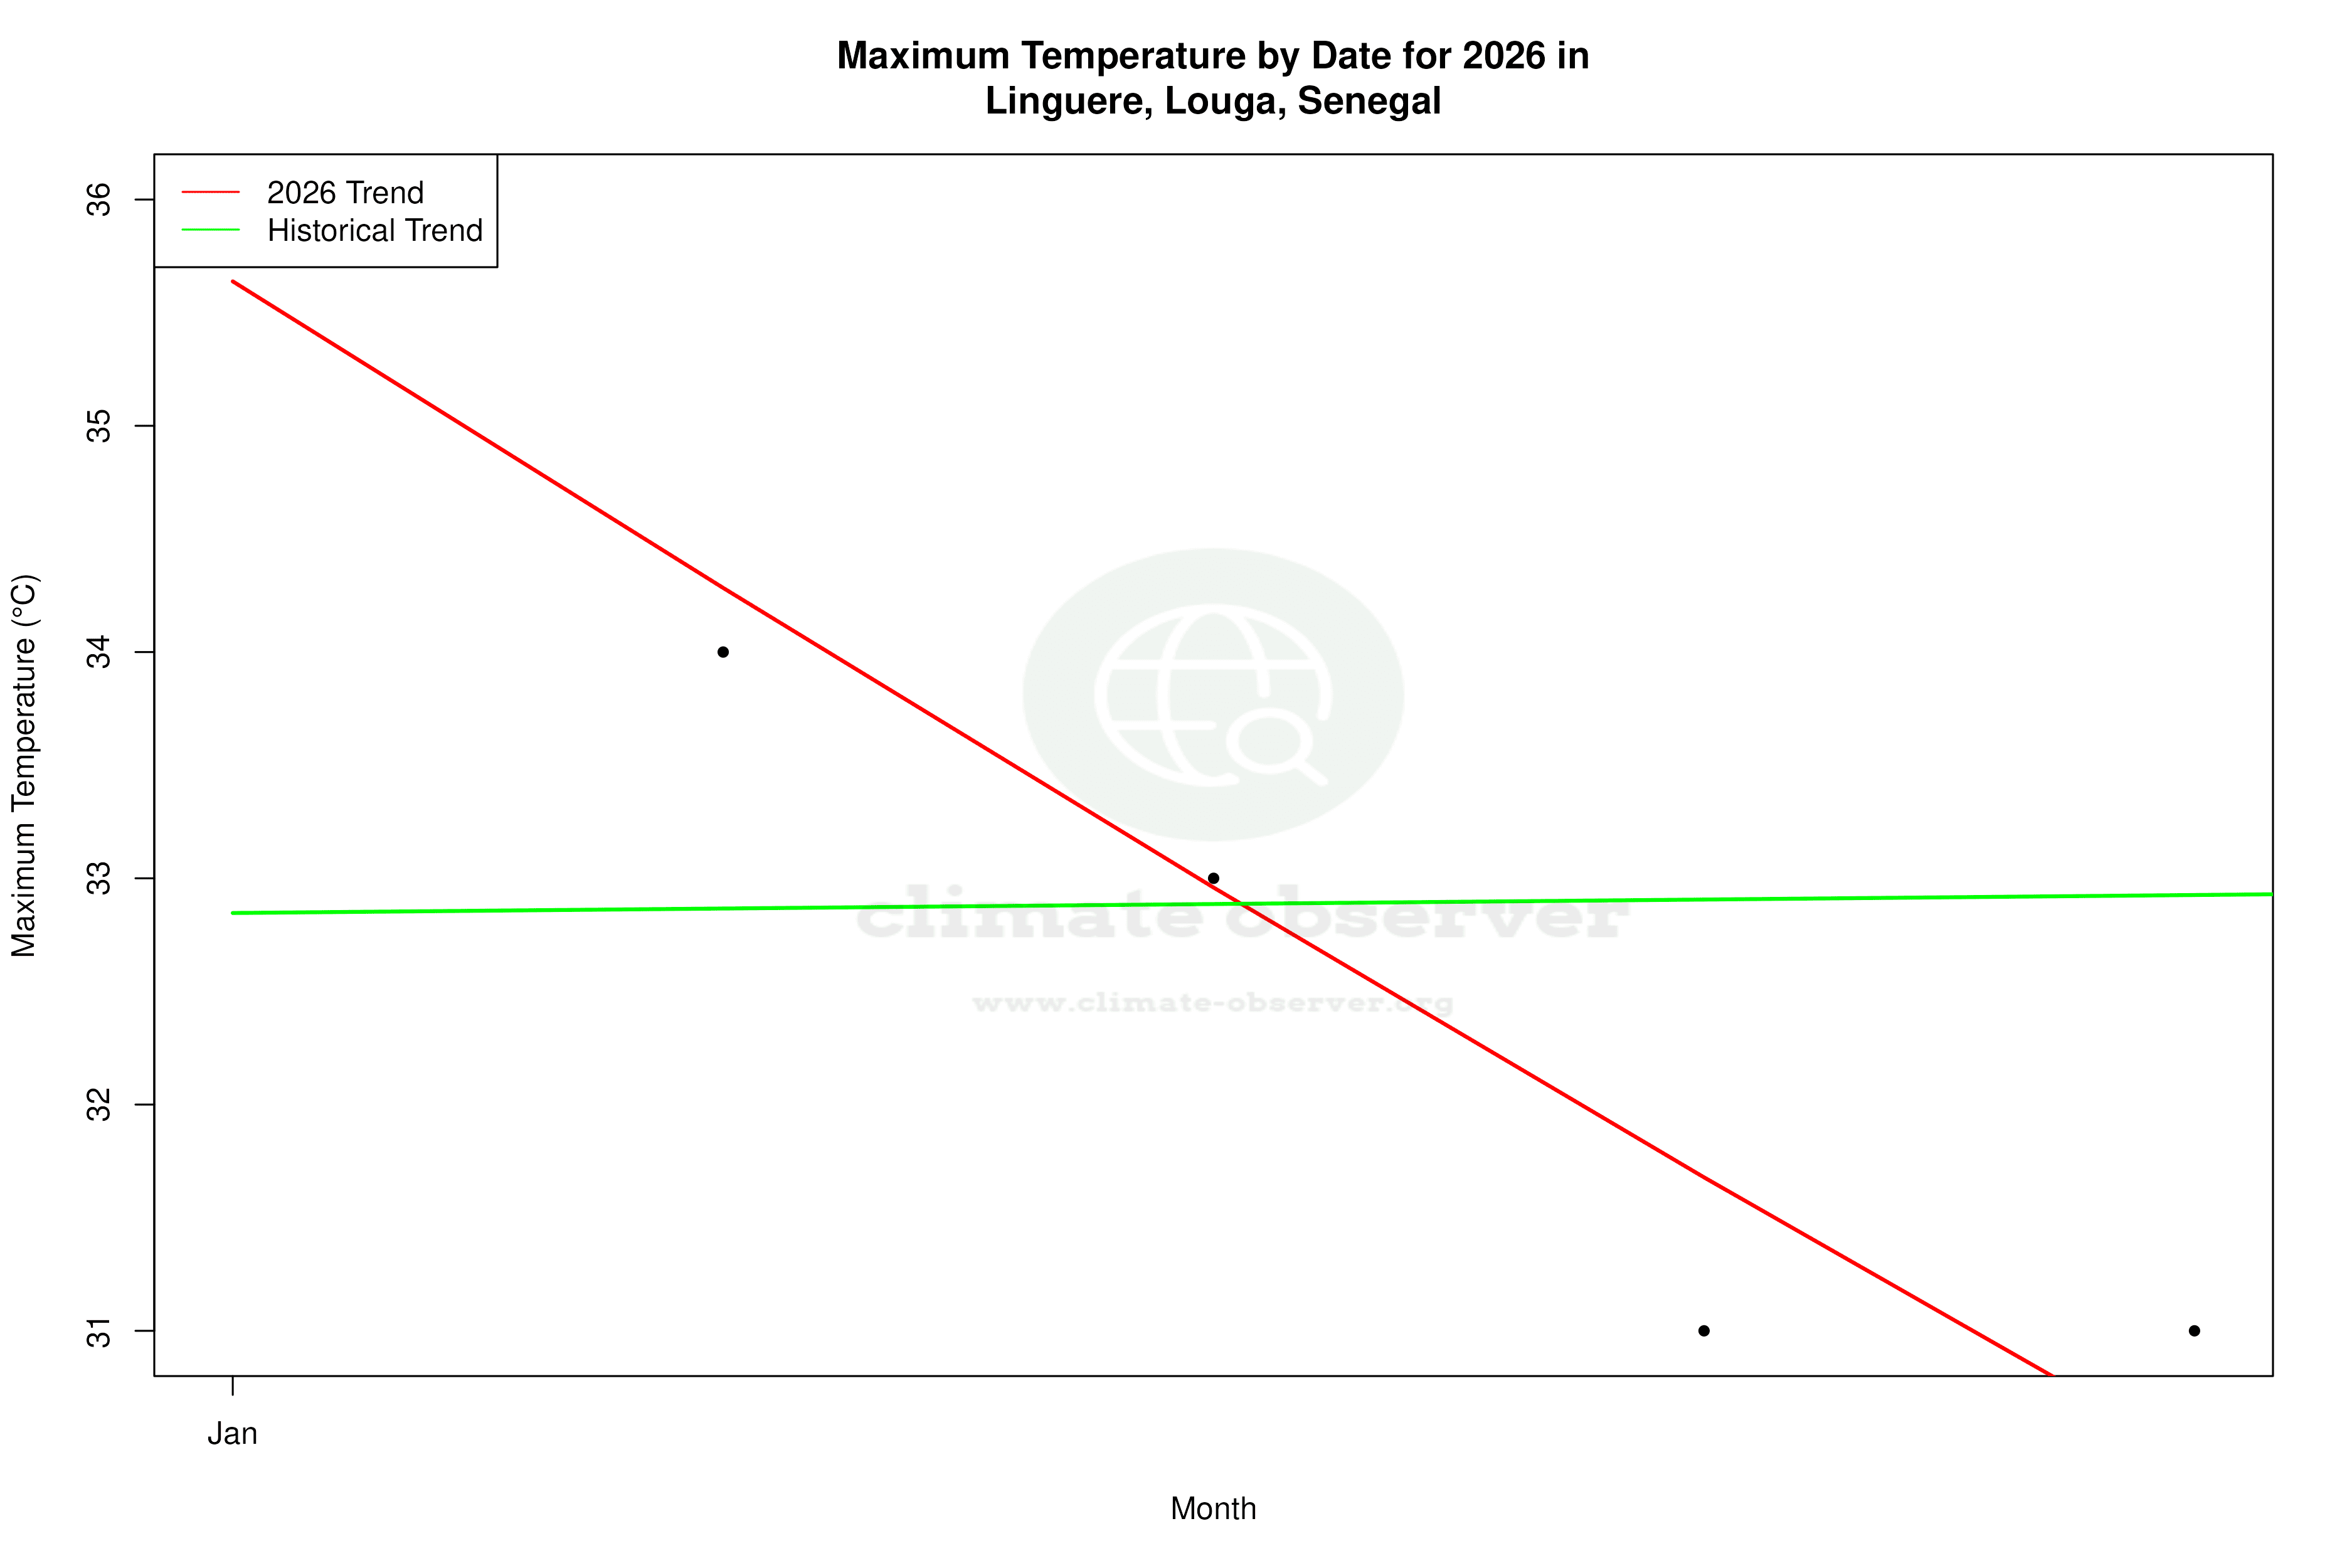


Max Temperature this Year | 1 of 6
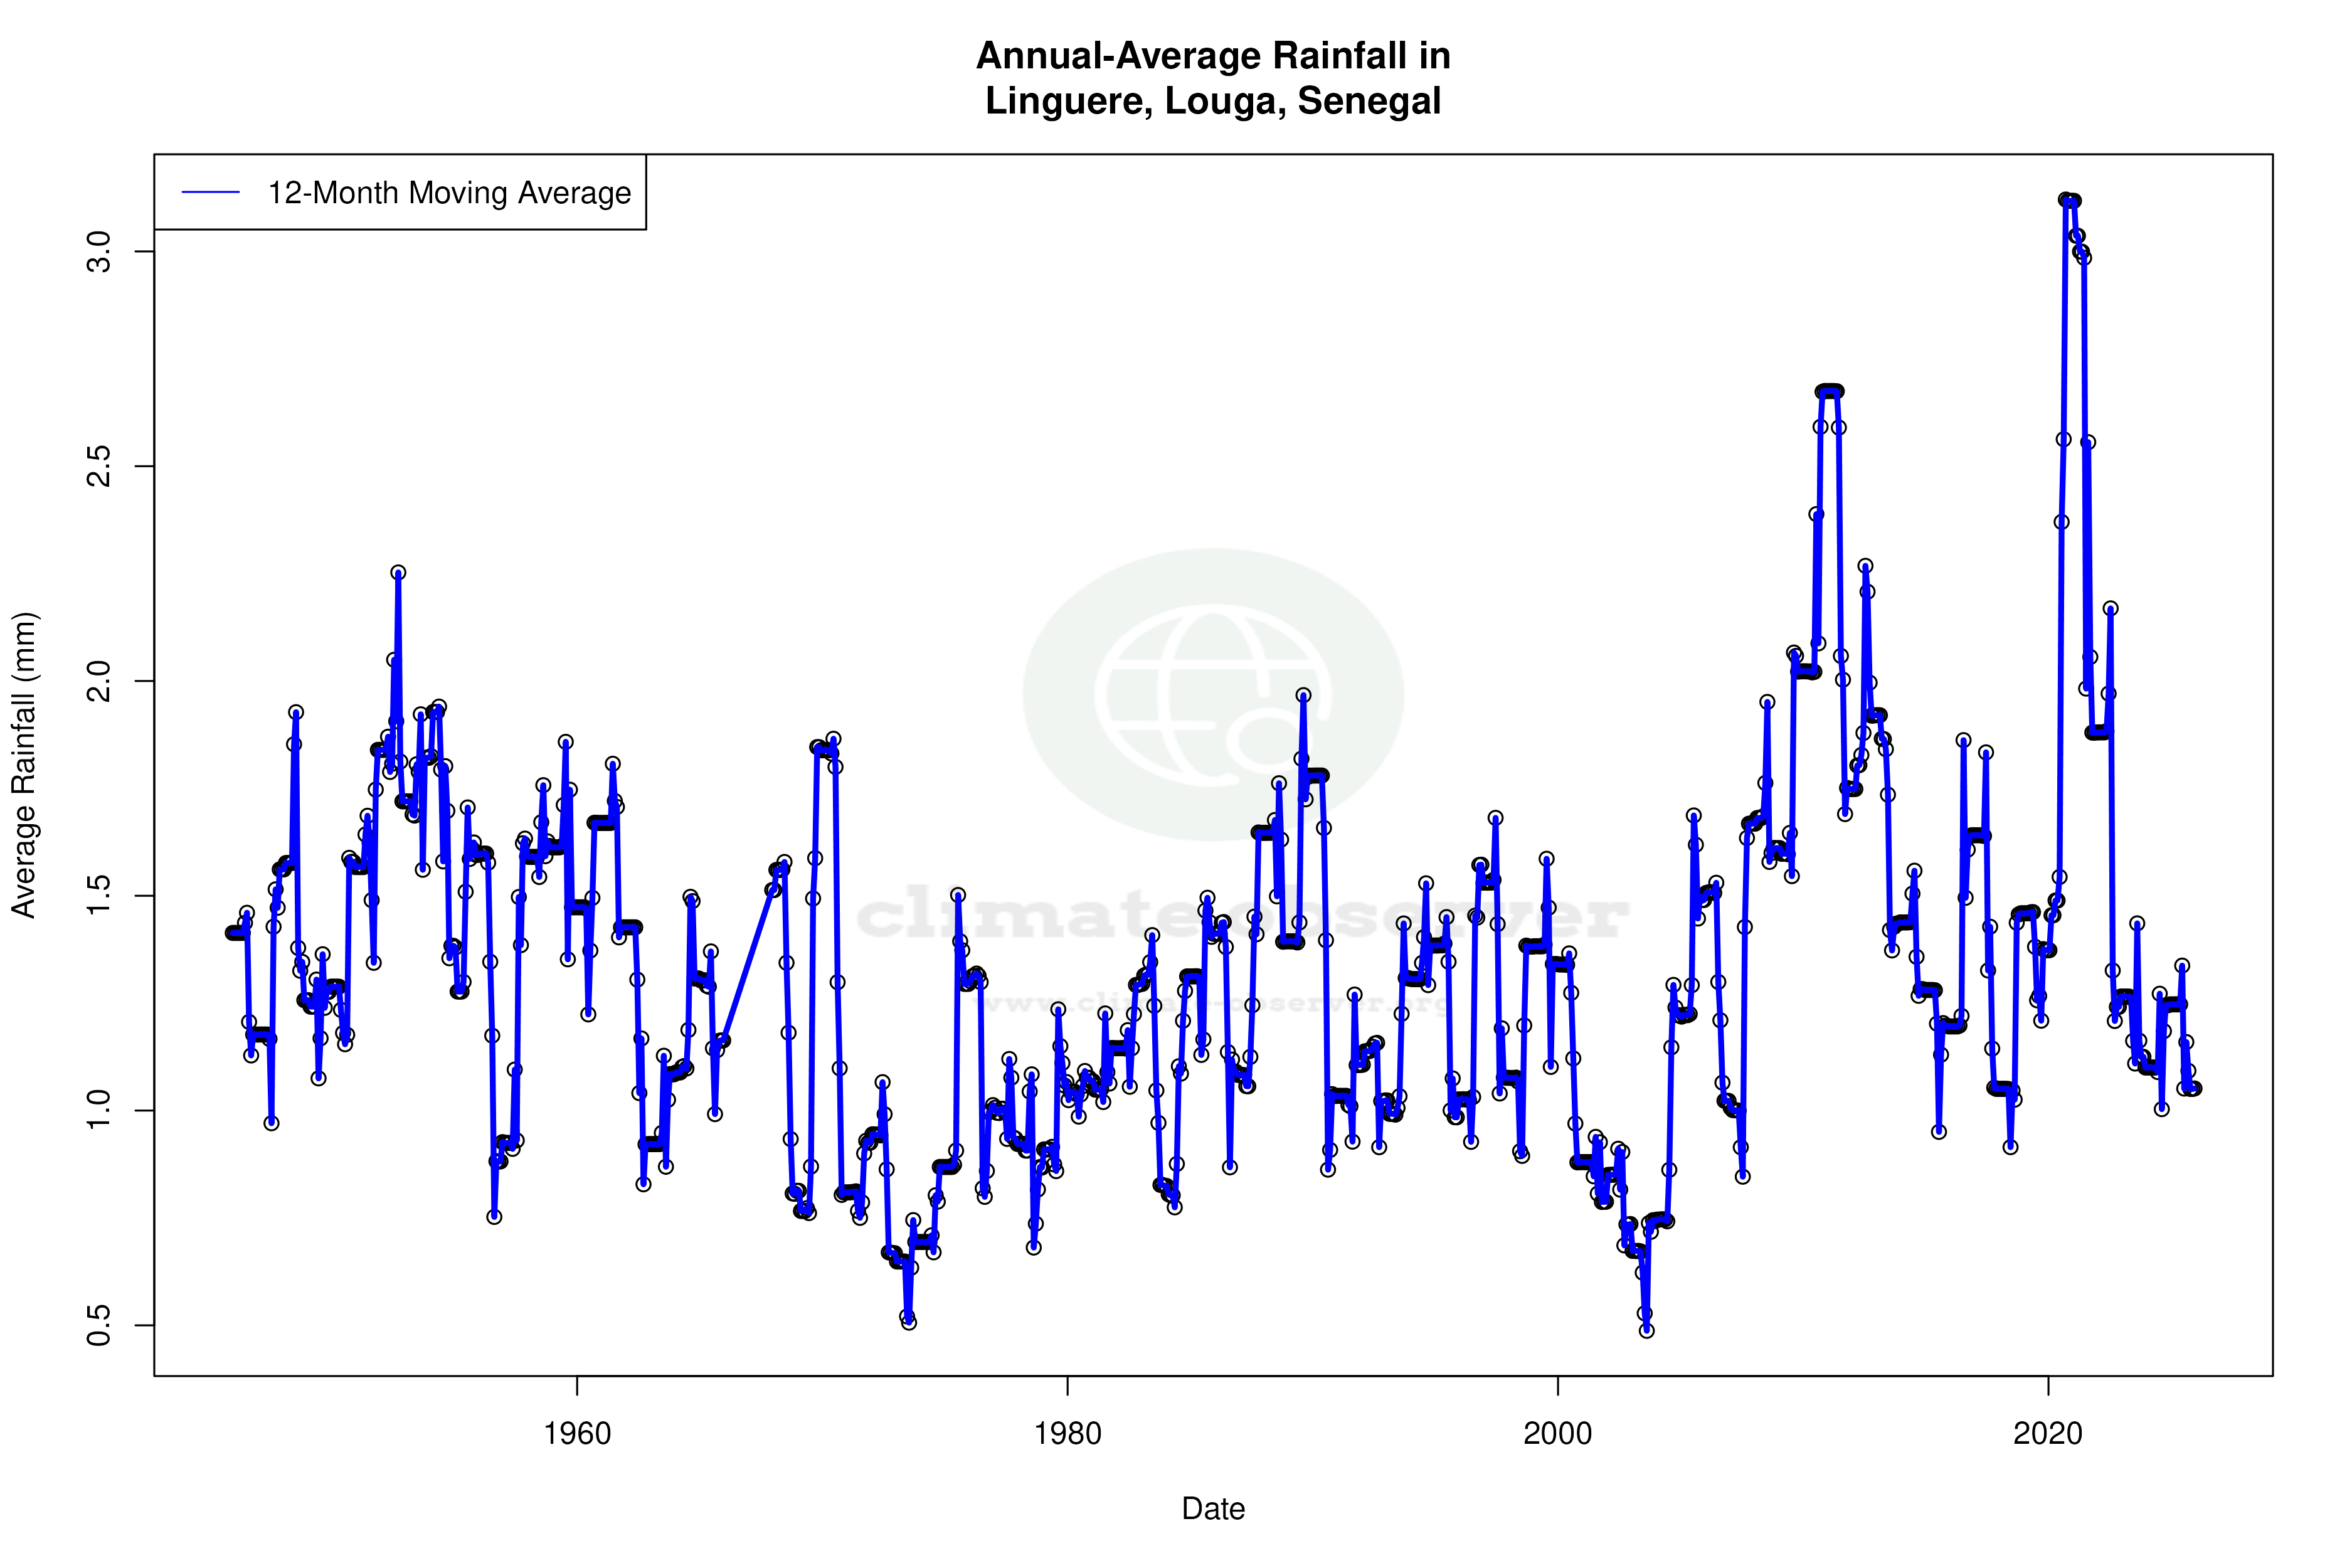
Climate 12-Month Moving Averages


Max Temperature 12-Month MA | 1 of 6
Daily Data Points and Averages Throughout the Year


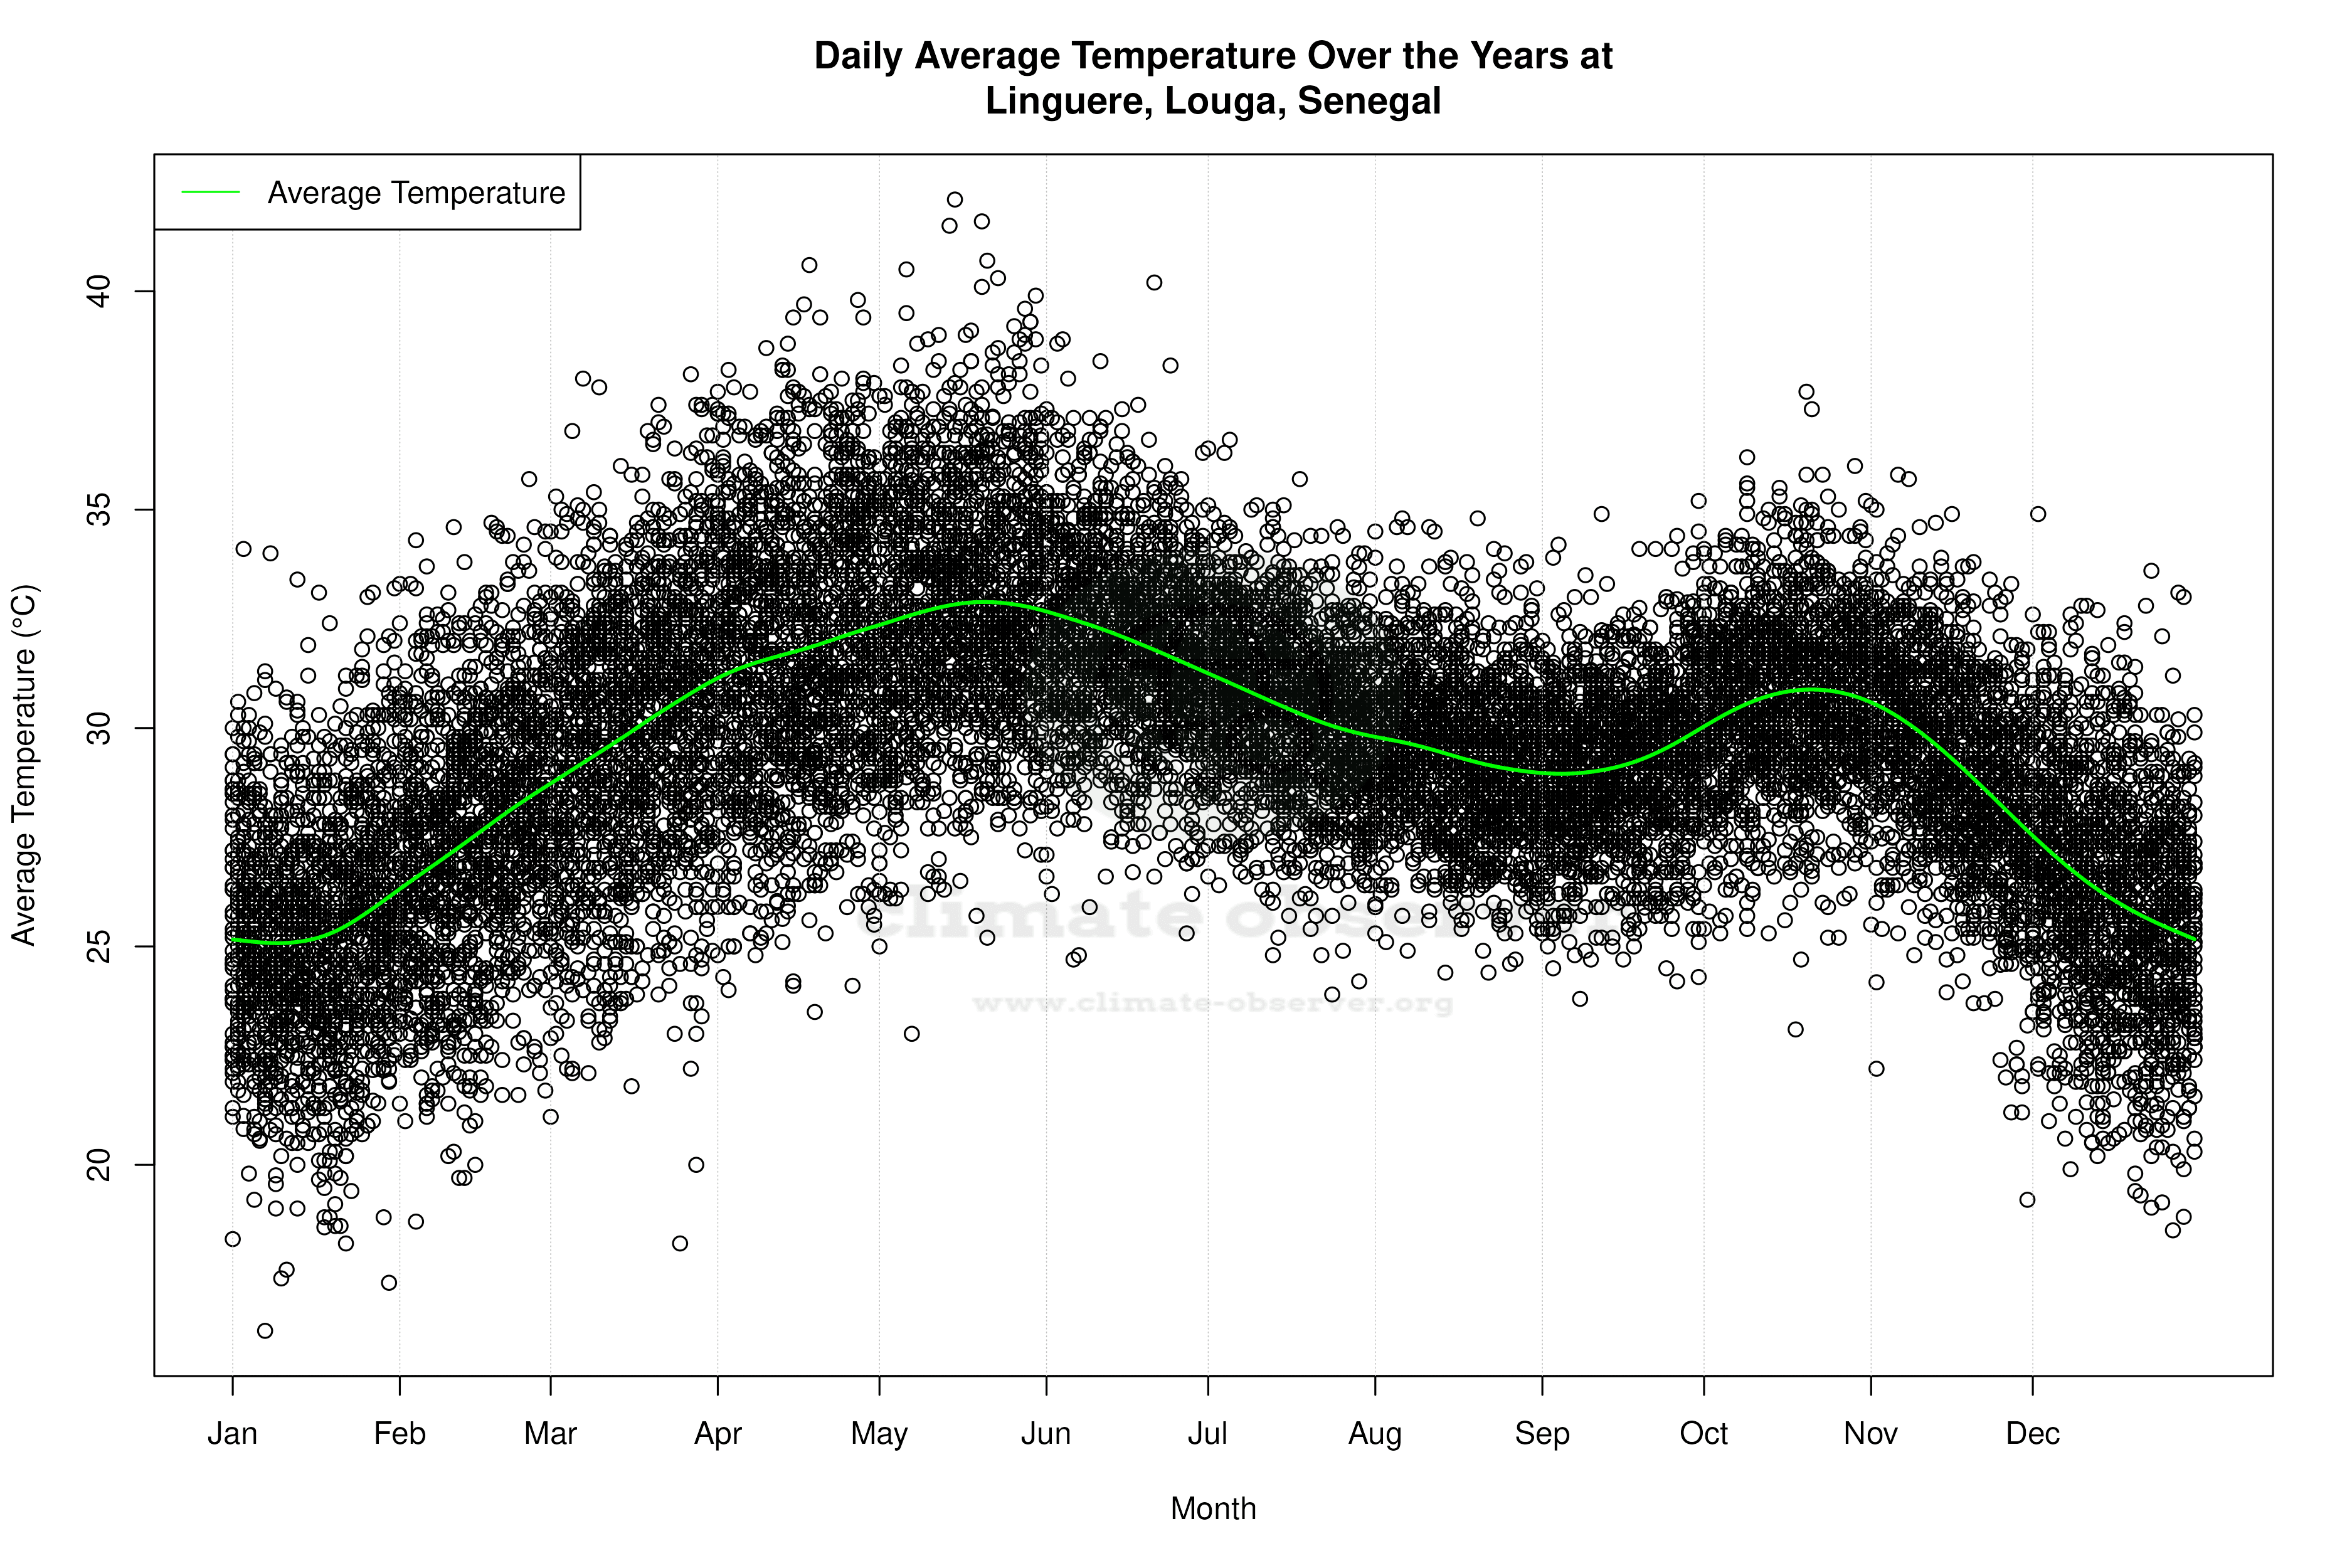


Average Max Temperature Throughout Year | 1 of 5
