Climate for Station: Madrid - Retiro, Madrid, Spain
Loading live weather...
Climate Analysis & Overview
Madrid's climate is experiencing a warming trend, with both highs and lows increasing over the past decade and all-time. The precipitation pattern has become slightly more concentrated, reflecting a shift in weather dynamics. These changes align with broader regional climate goals to address variability and extremes.
Mediterranean Climate Dynamics
Madrid - Retiro is situated in a region classified under the Köppen climate system as Csa, indicating a Mediterranean climate with hot, dry summers and mild, wet winters. The city's inland location, shielded by the Sierra de Guadarrama mountain range to the northwest, influences its weather patterns, contributing to the marked seasonal temperature variations and limited precipitation.
Temperature Trends: A Warming Narrative
Over the past decade, Madrid has witnessed a notable warming trend. The average high temperatures have risen by 0.36°C (0.65°F), while the lows have increased even more significantly by 0.68°C (1.22°F). When examining the all-time data, the warming is consistent, albeit slightly less pronounced, with highs increasing by 0.24°C (0.43°F) and lows by 0.28°C (0.50°F). These trends highlight a consistent warming pattern, which is crucial for understanding the broader impacts of climate change on urban environments.
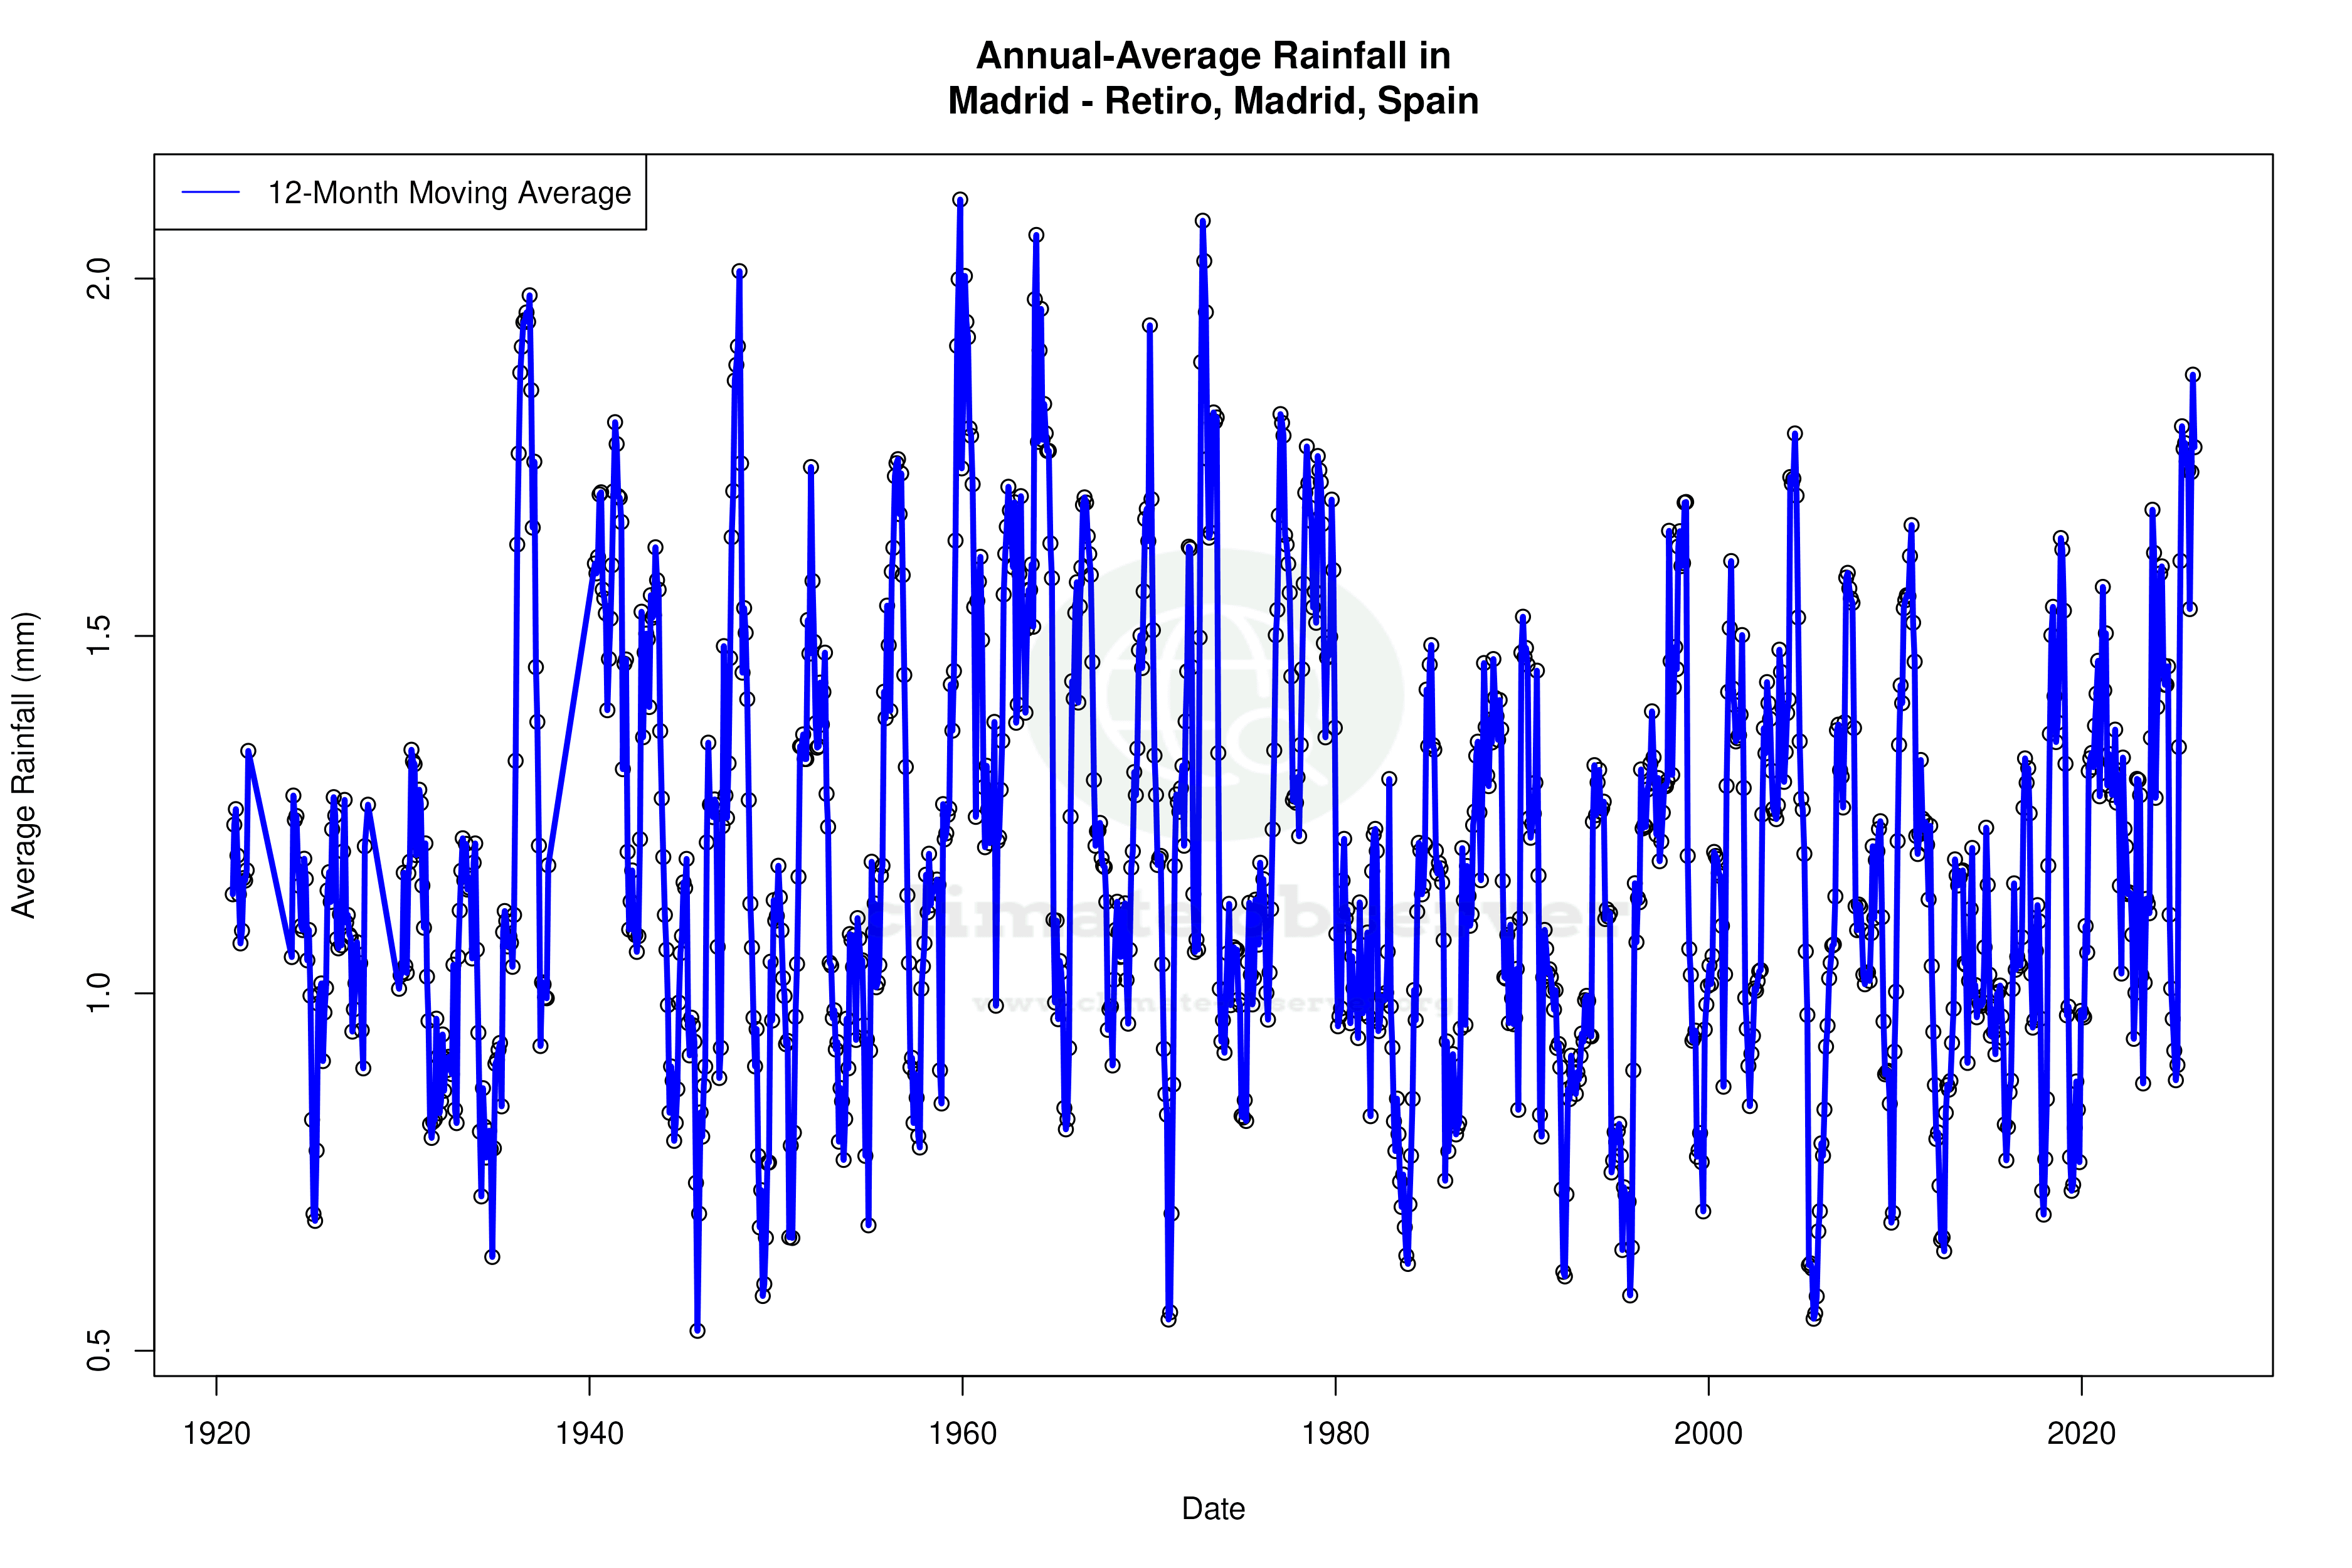
Precipitation Patterns: Slight Concentration Increase
The Precipitation Concentration Index (PCI) offers insights into how rainfall is distributed throughout the year. For Madrid, the PCI has increased from a baseline of 14.23 to a current value of 14.77. This marginal rise suggests that precipitation events are becoming slightly more concentrated, meaning that rainfall is occurring in fewer, more intense episodes rather than being evenly distributed. This shift can affect water management strategies and urban planning, particularly in a city that already experiences dry summers.
Temperature Extremes: Record Observations
Madrid has recorded temperature extremes that underscore its climatic variability. The highest recorded temperature is 40.7°C (105.3°F), while the lowest is -10.1°C (13.8°F). These extremes are reflective of the city's continental influences, which can lead to significant temperature fluctuations between seasons.
Regional Implications and Climate Goals
Spain has been proactive in setting regional climate goals aimed at reducing greenhouse gas emissions and adapting to climate change impacts. Madrid's warming trends and changing precipitation patterns are critical data points in this broader strategy. Understanding these shifts helps in crafting policies that aim to mitigate climate impacts, enhance urban resilience, and ensure sustainable development in the face of ongoing climatic changes.
Station Statistics
10-Year Trend
High: +0.46 °C/decade
Low: +0.62 °C/decade
Rain: +0.43 mm/decade
25-Year Trend
High: +0.74 °C/decade
Low: +0.54 °C/decade
Rain: +0.07 mm/decade
50-Year Trend
High: +0.48 °C/decade
Low: +0.39 °C/decade
Rain: +0.01 mm/decade
All-Time Trend
High: +0.24 °C/decade
Low: +0.28 °C/decade
Rain: -0.00 mm/decade
Percentage Above-Average Days
Last 12 Months: 51.8%
This Year: 67.9%
Precipitation Concentration Index (PCI) ℹ️
Last 12 Months: 14.0
Historical Average: 16.1
Percentile Rank of Last 12 Months ℹ️
High: 96th percentile
Low: 95th percentile
Rain: 92nd percentile
Change in Variance ℹ️
High: +15.0%
Low: +13.5%
Intraday: +3.1%
Data Coverage
86.8%
First Year of Data
1920
Station Location
Historical Weather Records
| Max High | Avg High | Min High | Max Avg | Avg Avg | Min Avg | Max Low | Avg Low | Min Low | Max Precipitation | Avg Precipitation | Max Snow | Avg Snow | |
|---|---|---|---|---|---|---|---|---|---|---|---|---|---|
| Record | 40.7 °C | — | -3.0 °C | 34.5 °C | — | -3.2 °C | 26.2 °C | — | -10.1 °C | 87.0 mm | — | — | — |
| January | 19.9 °C | 9.4 °C | -3.0 °C | 15.3 °C | 6.2 °C | -3.2 °C | 11.1 °C | 2.3 °C | -10.1 °C | 36.2 mm | 1.2 mm | — | — |
| February | 22.0 °C | 11.6 °C | -1.0 °C | 15.4 °C | 7.9 °C | -2.4 °C | 12.0 °C | 3.1 °C | -9.1 °C | 42.2 mm | 1.3 mm | — | — |
| March | 26.7 °C | 15.1 °C | 0.8 °C | 21.6 °C | 10.9 °C | 0.2 °C | 13.7 °C | 5.4 °C | -5.1 °C | 51.7 mm | 1.3 mm | — | — |
| April | 30.9 °C | 18.2 °C | 5.8 °C | 24.2 °C | 13.3 °C | 3.2 °C | 18.7 °C | 7.5 °C | -1.6 °C | 46.0 mm | 1.6 mm | — | — |
| May | 35.5 °C | 22.1 °C | 9.2 °C | 29.5 °C | 17.6 °C | 5.8 °C | 20.6 °C | 10.9 °C | 0.6 °C | 44.2 mm | 1.4 mm | — | — |
| June | 40.7 °C | 27.5 °C | 11.6 °C | 34.4 °C | 23.3 °C | 8.2 °C | 25.7 °C | 15.3 °C | 4.4 °C | 32.8 mm | 0.9 mm | — | — |
| July | 40.7 °C | 31.5 °C | 17.5 °C | 34.5 °C | 26.9 °C | 14.8 °C | 26.2 °C | 18.3 °C | 8.5 °C | 51.0 mm | 0.3 mm | — | — |
| August | 40.7 °C | 30.9 °C | 16.8 °C | 33.6 °C | 26.3 °C | 17.0 °C | 26.1 °C | 18.1 °C | 9.2 °C | 53.2 mm | 0.3 mm | — | — |
| September | 38.9 °C | 25.9 °C | 11.6 °C | 32.5 °C | 21.6 °C | 9.2 °C | 23.4 °C | 14.8 °C | 4.0 °C | 87.0 mm | 0.9 mm | — | — |
| October | 30.1 °C | 19.3 °C | 8.4 °C | 24.9 °C | 15.7 °C | 6.2 °C | 18.8 °C | 10.4 °C | -0.4 °C | 73.6 mm | 1.8 mm | — | — |
| November | 22.7 °C | 13.0 °C | 0.8 °C | 18.9 °C | 10.0 °C | 0.6 °C | 15.2 °C | 5.7 °C | -3.4 °C | 59.8 mm | 1.8 mm | — | — |
| December | 18.6 °C | 9.7 °C | -1.1 °C | 14.4 °C | 7.0 °C | -1.7 °C | 12.0 °C | 3.0 °C | -9.2 °C | 41.5 mm | 1.5 mm | — | — |
Data Visualisations
Remove WatermarksCurrent Year Climate Trends vs Historical


Max Temperature this Year | 1 of 6
Climate 12-Month Moving Averages


Max Temperature 12-Month MA | 1 of 6
Daily Data Points and Averages Throughout the Year


Average Max Temperature Throughout Year | 1 of 5
