Climate for Station: Badajoz/Talavera La Real, Extremadura, Spain
Loading live weather...
Climate Analysis & Overview
Badajoz/Talavera La Real is experiencing a nuanced climate narrative with a general warming trend in lows and a subtle cooling in highs over the last decade. This is set against a backdrop of more evenly distributed precipitation patterns, aligning with Spain's regional climate adaptation goals.
Mediterranean Climate Dynamics
Badajoz/Talavera La Real, located in the Extremadura region of Spain, falls under the Mediterranean climate classification. This climate is characterised by hot, dry summers and mild, wet winters. The geographical positioning, with the nearby Guadiana River and surrounding plains, plays a significant role in shaping the local climate patterns observed at the station.
Temperature Trends: A Mixed Bag
Over the last decade, the station has recorded a 0.53°C (0.95°F) rise in low temperatures, indicating a warming trend during cooler periods. Conversely, high temperatures have shown a slight cooling trend with a decrease of 0.08°C (0.14°F). However, when considering the all-time trends, both highs and lows have been warming, with highs rising by 0.35°C (0.63°F) and lows by 0.24°C (0.43°F). This suggests a long-term warming trend, albeit with recent short-term fluctuations.
Precipitation Patterns: A Shift Towards Evenness
The Precipitation Concentration Index (PCI) has decreased from a baseline of 17.30 to a current value of 13.53. This indicates that precipitation is becoming more evenly distributed throughout the year, a significant change from previous patterns where rain was concentrated in fewer events. Such a shift aligns with Spain's climate adaptation strategies, which aim to manage water resources more effectively in the face of climate change.
Record Extremes: A Tale of Contrasts
Badajoz/Talavera La Real has witnessed extreme temperatures, with a record high of 45.4°C (113.7°F) and a record low of -7.2°C (19.0°F). These extremes highlight the region's susceptibility to temperature variability, which can pose challenges for agriculture and water management, critical sectors in this primarily rural area.
Regional Climate Goals and Implications
The observed climate trends at Badajoz/Talavera La Real are reflective of broader regional climate goals in Spain, which focus on reducing greenhouse gas emissions and enhancing resilience to climate impacts. The more evenly distributed precipitation could aid in achieving these goals by improving water availability and reducing the risk of droughts, which are common in Mediterranean climates.
Station Statistics
10-Year Trend
High: +0.16 °C/decade
Low: +1.06 °C/decade
Rain: +0.76 mm/decade
25-Year Trend
High: +0.53 °C/decade
Low: +0.49 °C/decade
Rain: +0.06 mm/decade
50-Year Trend
High: +0.38 °C/decade
Low: +0.35 °C/decade
Rain: -0.04 mm/decade
All-Time Trend
High: +0.35 °C/decade
Low: +0.25 °C/decade
Rain: -0.05 mm/decade
Percentage Above-Average Days
Last 12 Months: 49.3%
This Year: 57.8%
Precipitation Concentration Index (PCI) ℹ️
Last 12 Months: 15.4
Historical Average: 17.9
Percentile Rank of Last 12 Months ℹ️
High: 91st percentile
Low: 97th percentile
Rain: 90th percentile
Change in Variance ℹ️
High: +7.4%
Low: +5.2%
Intraday: -2.4%
Data Coverage
93.4%
First Year of Data
1955
Station Location
Historical Weather Records
| Max High | Avg High | Min High | Max Avg | Avg Avg | Min Avg | Max Low | Avg Low | Min Low | Max Precipitation | Avg Precipitation | Max Snow | Avg Snow | |
|---|---|---|---|---|---|---|---|---|---|---|---|---|---|
| Record | 45.4 °C | — | 3.2 °C | 36.9 °C | — | 0.0 °C | 26.6 °C | — | -7.2 °C | 75.0 mm | — | — | — |
| January | 23.2 °C | 14.0 °C | 3.9 °C | 18.2 °C | 9.0 °C | 0.0 °C | 14.5 °C | 3.7 °C | -7.2 °C | 46.0 mm | 1.8 mm | — | — |
| February | 29.0 °C | 15.9 °C | 3.6 °C | 17.3 °C | 10.8 °C | 0.2 °C | 15.0 °C | 4.8 °C | -6.0 °C | 45.4 mm | 1.8 mm | — | — |
| March | 32.4 °C | 19.0 °C | 8.0 °C | 22.2 °C | 13.7 °C | 3.0 °C | 15.4 °C | 6.5 °C | -2.8 °C | 42.0 mm | 1.6 mm | — | — |
| April | 36.1 °C | 21.5 °C | 8.4 °C | 28.6 °C | 16.0 °C | 6.3 °C | 17.7 °C | 8.6 °C | -1.2 °C | 46.6 mm | 1.5 mm | — | — |
| May | 39.2 °C | 25.9 °C | 13.4 °C | 31.7 °C | 20.0 °C | 8.0 °C | 20.8 °C | 11.6 °C | 4.0 °C | 29.9 mm | 1.0 mm | — | — |
| June | 43.4 °C | 30.9 °C | 15.4 °C | 35.6 °C | 24.6 °C | 13.3 °C | 25.0 °C | 15.2 °C | 6.8 °C | 52.0 mm | 0.5 mm | — | — |
| July | 45.4 °C | 34.7 °C | 20.2 °C | 36.9 °C | 27.3 °C | 17.1 °C | 26.6 °C | 17.1 °C | 9.6 °C | 30.5 mm | 0.1 mm | — | — |
| August | 44.8 °C | 34.4 °C | 21.2 °C | 35.2 °C | 27.1 °C | 16.8 °C | 26.2 °C | 17.1 °C | 9.0 °C | 47.0 mm | 0.1 mm | — | — |
| September | 43.7 °C | 30.4 °C | 17.4 °C | 34.8 °C | 23.8 °C | 15.2 °C | 22.9 °C | 15.1 °C | 6.0 °C | 75.0 mm | 0.8 mm | — | — |
| October | 36.9 °C | 24.3 °C | 13.0 °C | 29.6 °C | 18.6 °C | 8.0 °C | 20.7 °C | 11.5 °C | -2.2 °C | 62.8 mm | 2.0 mm | — | — |
| November | 29.2 °C | 17.9 °C | 9.2 °C | 22.3 °C | 13.1 °C | 1.7 °C | 18.2 °C | 7.0 °C | -4.4 °C | 70.5 mm | 2.0 mm | — | — |
| December | 25.6 °C | 14.3 °C | 3.2 °C | 18.9 °C | 9.9 °C | 1.4 °C | 16.4 °C | 4.5 °C | -7.0 °C | 42.4 mm | 2.1 mm | — | — |
Data Visualisations
Remove WatermarksCurrent Year Climate Trends vs Historical


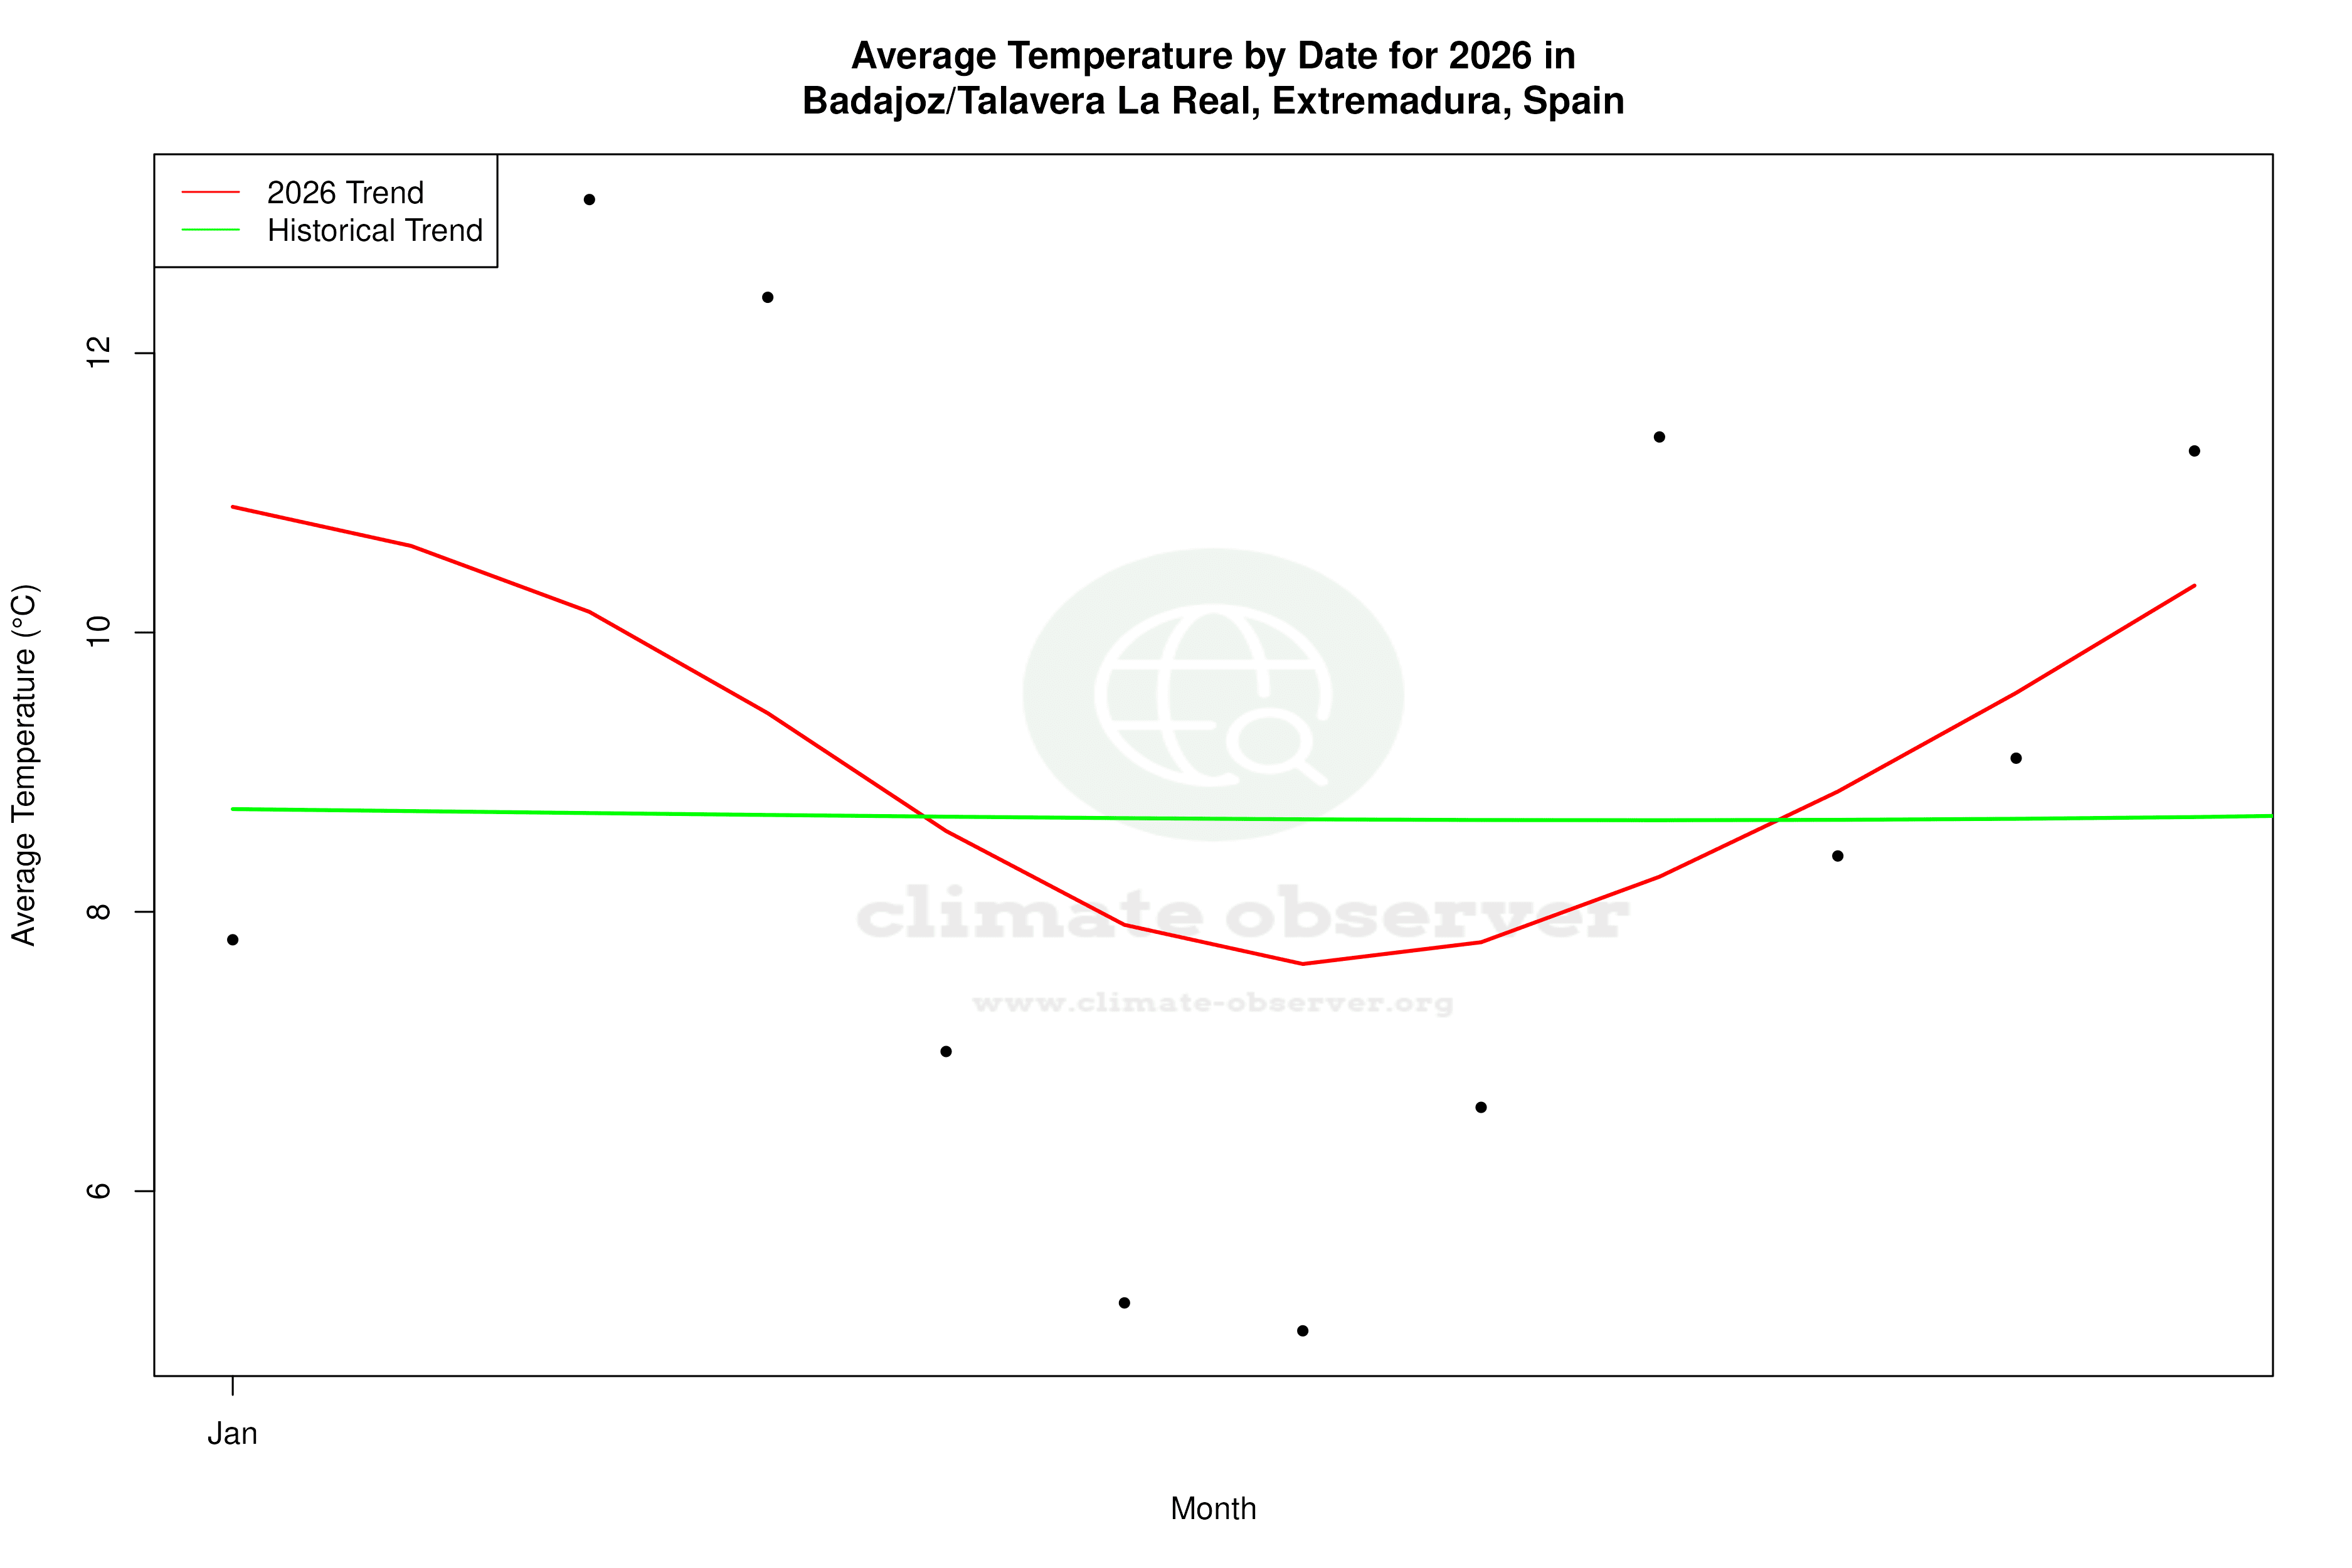


Max Temperature this Year | 1 of 6
Climate 12-Month Moving Averages


Max Temperature 12-Month MA | 1 of 6
Daily Data Points and Averages Throughout the Year


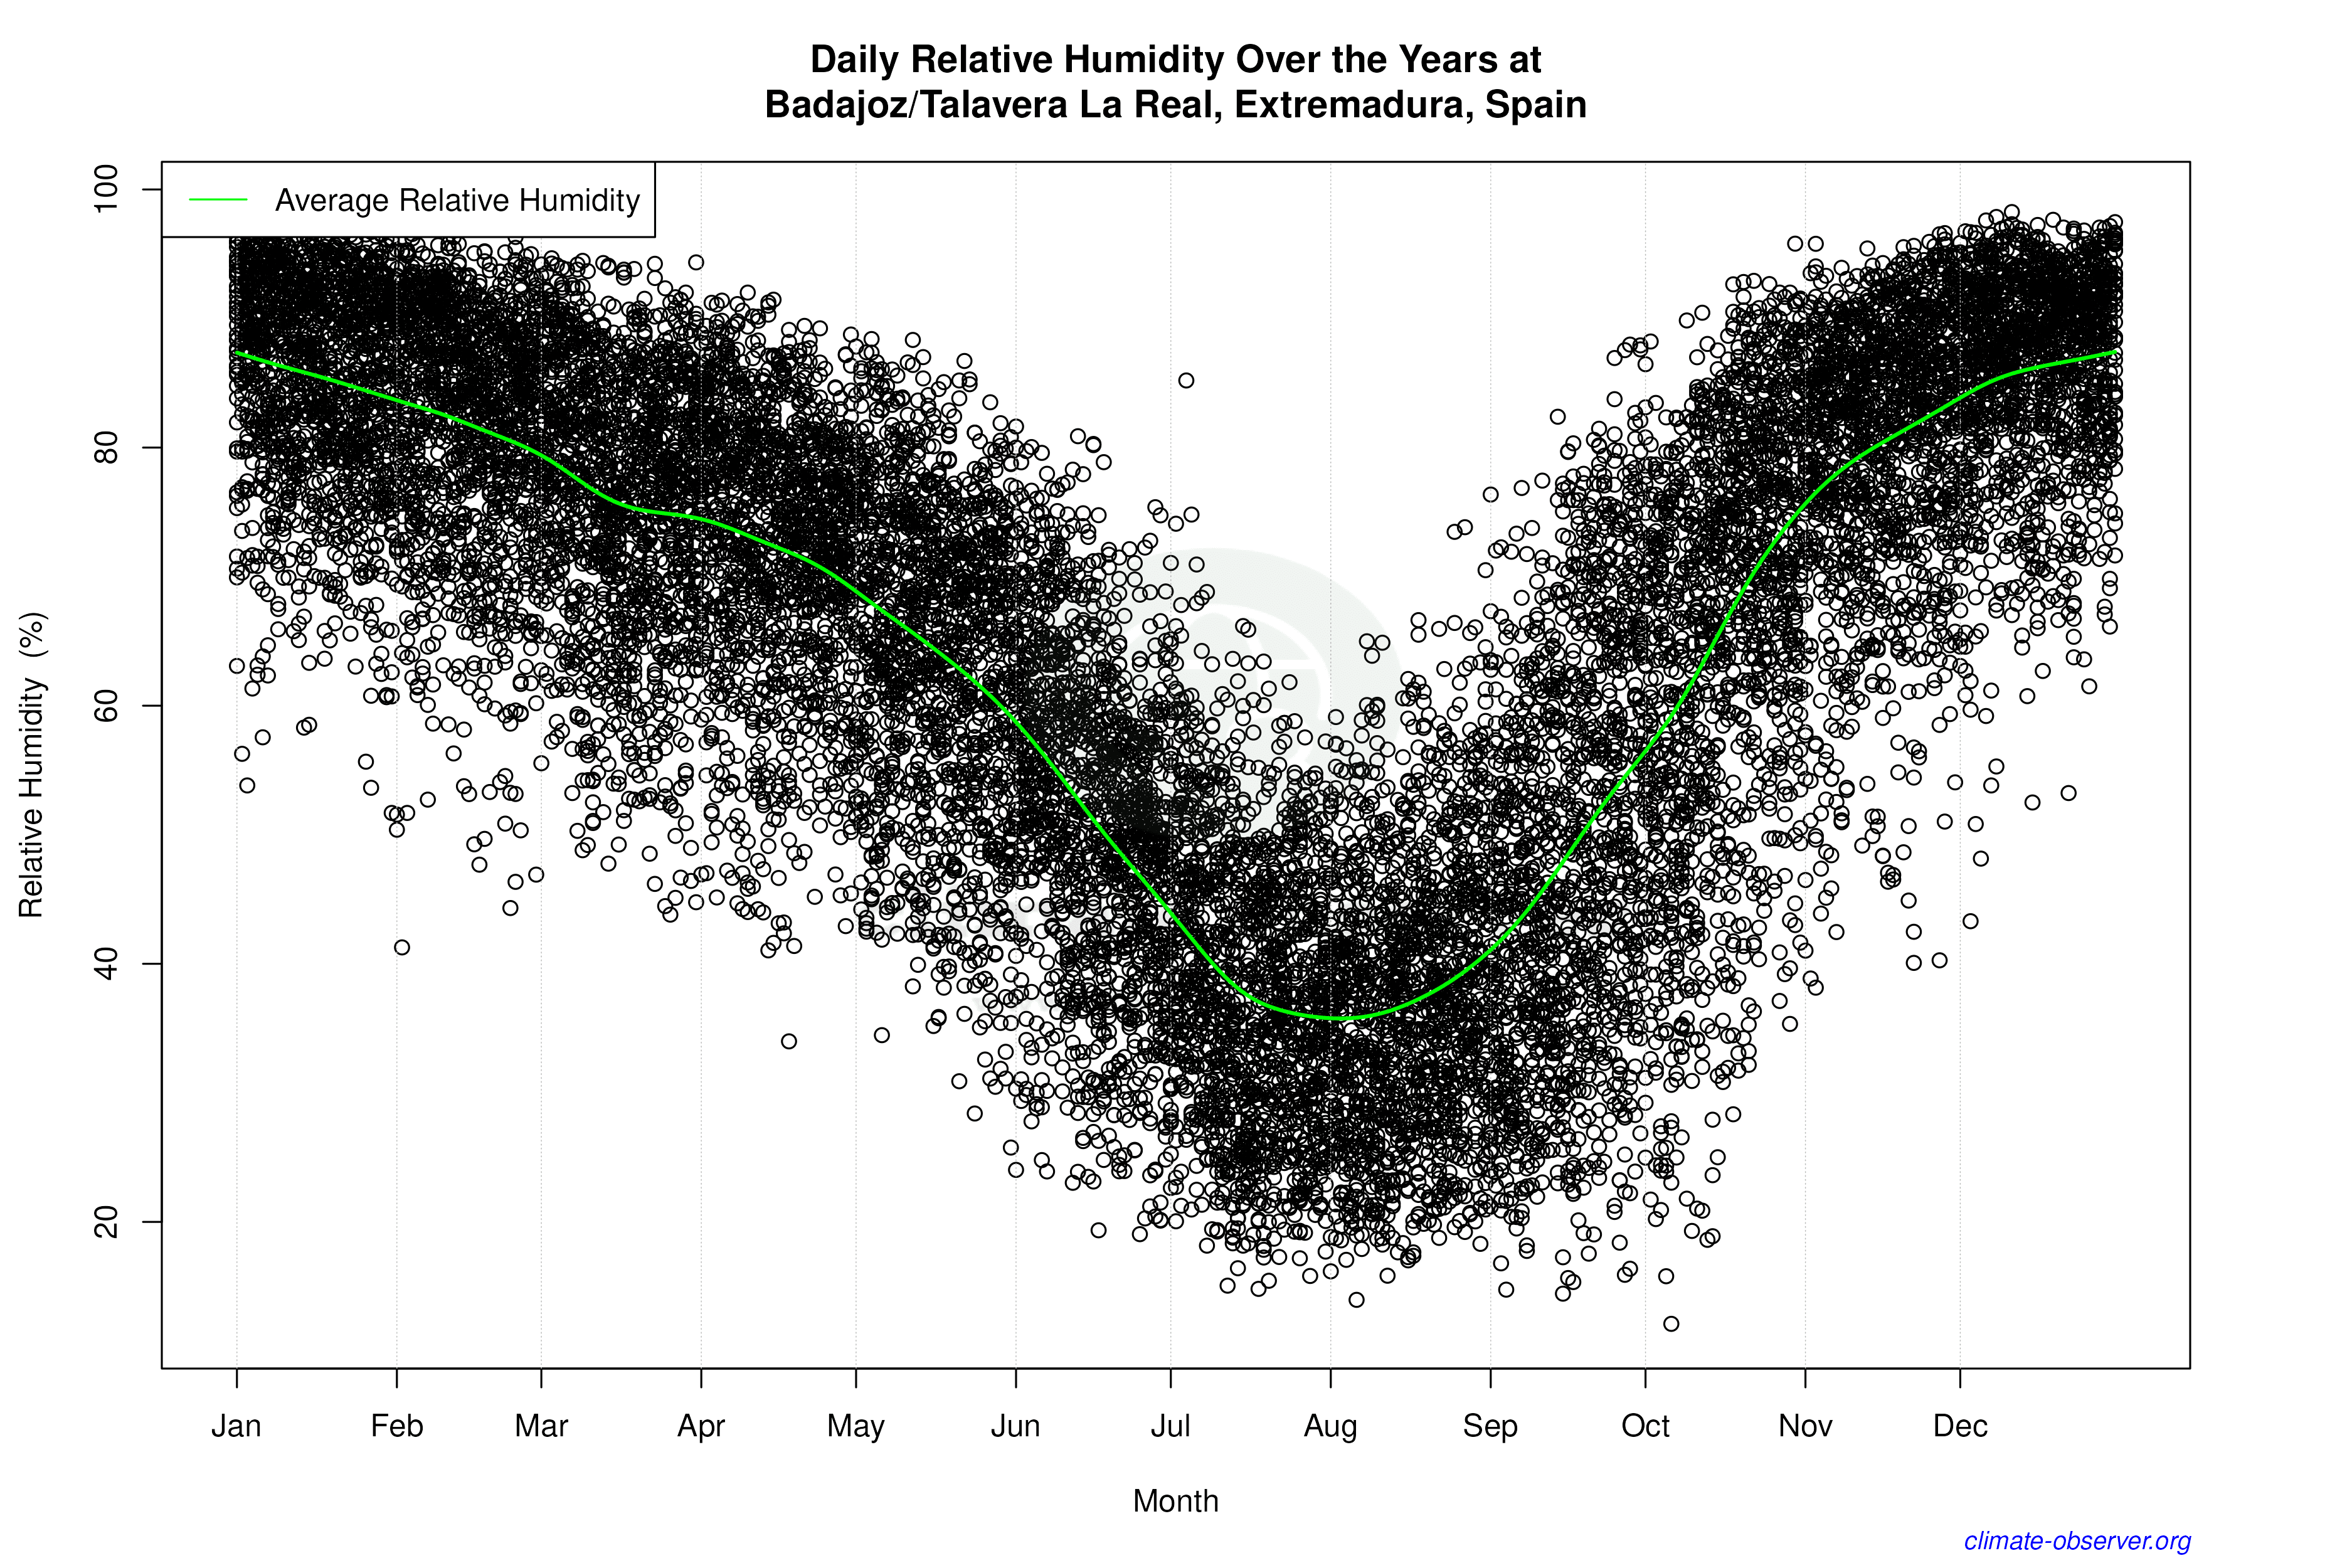

Average Max Temperature Throughout Year | 1 of 5
