Climate for Station: Malaga Aeropuerto, Andalusia, Spain
Loading live weather...
Climate Analysis & Overview
Málaga Aeropuerto is experiencing a warming trend, with both highs and lows rising over the past decade and all-time. The Precipitation Concentration Index indicates more evenly distributed rainfall, aligning with Spain's climate adaptation goals. This suggests a shift towards a more balanced climate pattern in the region.
Mediterranean Climate Dynamics
Málaga Aeropuerto, situated at 36.6667°N, 4.4881°W, falls under the Mediterranean climate classification, characterised by hot, dry summers and mild, wet winters. The proximity to the coast and the Sierra de Mijas mountain range influences local weather patterns, often moderating temperatures and affecting precipitation distribution. Over the past decade, the area has seen a notable warming trend, with high temperatures increasing by 1.15°C (2.07°F) and lows by 0.94°C (1.68°F). This recent trend is more pronounced than the all-time warming, where highs have risen by 0.23°C (0.41°F) and lows by 0.20°C (0.36°F). These changes suggest an acceleration in warming, consistent with broader regional climate patterns.
Temperature Extremes and Records
Málaga Aeropuerto has recorded a maximum temperature of 44.2°C (111.6°F) and a minimum of -2.6°C (27.3°F). These extremes highlight the variability inherent in Mediterranean climates, where summer temperatures can soar, and winter nights occasionally dip below freezing. The increasing trend in both high and low temperatures over time reflects the impact of global warming, with potential implications for local agriculture, water resources, and energy consumption.
Precipitation Patterns and Distribution
The Precipitation Concentration Index (PCI) at Málaga Aeropuerto has decreased from a baseline of 18.92 to a current value of 17.20. This indicates a shift towards more evenly distributed rainfall throughout the year, as opposed to being concentrated in fewer, more intense events. Such a trend is beneficial for water management and agriculture, reducing the risk of flooding and drought. This aligns with Spain's climate adaptation goals, which aim to enhance resilience against extreme weather events.
Regional Climate Adaptation
Spain has been actively pursuing climate adaptation strategies to mitigate the effects of climate change. The observed trends at Málaga Aeropuerto, including the warming temperatures and more evenly distributed precipitation, provide valuable insights into the effectiveness of these strategies. As the region continues to adapt, understanding these localised changes is crucial for planning and implementing future climate resilience measures.
Station Statistics
10-Year Trend
High: +1.07 °C/decade
Low: +0.93 °C/decade
Rain: +0.00 mm/decade
25-Year Trend
High: +0.59 °C/decade
Low: +0.51 °C/decade
Rain: -0.16 mm/decade
50-Year Trend
High: +0.40 °C/decade
Low: +0.55 °C/decade
Rain: -0.04 mm/decade
All-Time Trend
High: +0.22 °C/decade
Low: +0.19 °C/decade
Rain: -0.04 mm/decade
Percentage Above-Average Days
Last 12 Months: 55.6%
This Year: 35.0%
Precipitation Concentration Index (PCI) ℹ️
Last 12 Months: 18.1
Historical Average: 23.0
Percentile Rank of Last 12 Months ℹ️
High: 93rd percentile
Low: 96th percentile
Rain: 74th percentile
Change in Variance ℹ️
High: +5.5%
Low: +12.3%
Intraday: -12.0%
Data Coverage
90.6%
First Year of Data
1971
Station Location
Historical Weather Records
| Max High | Avg High | Min High | Max Avg | Avg Avg | Min Avg | Max Low | Avg Low | Min Low | Max Precipitation | Avg Precipitation | Max Snow | Avg Snow | |
|---|---|---|---|---|---|---|---|---|---|---|---|---|---|
| Record | 44.2 °C | — | 4.6 °C | 35.6 °C | — | 4.1 °C | 30.3 °C | — | -2.6 °C | 164.0 mm | — | — | — |
| January | 26.8 °C | 16.7 °C | 4.6 °C | 19.6 °C | 11.9 °C | 4.5 °C | 16.4 °C | 7.9 °C | -2.6 °C | 121.5 mm | 2.3 mm | — | — |
| February | 30.0 °C | 17.6 °C | 5.0 °C | 20.3 °C | 12.8 °C | 4.1 °C | 16.8 °C | 8.4 °C | -1.6 °C | 151.0 mm | 2.1 mm | — | — |
| March | 31.4 °C | 19.3 °C | 9.4 °C | 24.2 °C | 14.3 °C | 5.5 °C | 20.1 °C | 9.8 °C | -1.2 °C | 77.2 mm | 2.2 mm | — | — |
| April | 34.3 °C | 21.4 °C | 11.4 °C | 25.6 °C | 16.1 °C | 9.6 °C | 19.7 °C | 11.4 °C | 2.8 °C | 45.5 mm | 1.3 mm | — | — |
| May | 35.6 °C | 24.4 °C | 15.0 °C | 27.3 °C | 19.2 °C | 11.9 °C | 23.8 °C | 14.3 °C | 5.0 °C | 44.0 mm | 0.8 mm | — | — |
| June | 41.0 °C | 27.9 °C | 17.4 °C | 31.7 °C | 22.9 °C | 16.4 °C | 26.0 °C | 17.9 °C | 9.8 °C | 72.5 mm | 0.2 mm | — | — |
| July | 44.2 °C | 30.4 °C | 20.8 °C | 35.6 °C | 25.3 °C | 19.4 °C | 28.8 °C | 20.5 °C | 10.0 °C | 22.2 mm | 0.0 mm | — | — |
| August | 44.0 °C | 30.8 °C | 23.4 °C | 34.8 °C | 25.8 °C | 19.6 °C | 30.3 °C | 21.2 °C | 12.2 °C | 36.2 mm | 0.1 mm | — | — |
| September | 40.0 °C | 28.1 °C | 19.4 °C | 30.2 °C | 23.3 °C | 15.2 °C | 26.9 °C | 18.8 °C | 10.2 °C | 52.8 mm | 0.5 mm | — | — |
| October | 36.3 °C | 24.1 °C | 13.0 °C | 27.3 °C | 19.2 °C | 11.1 °C | 24.4 °C | 15.1 °C | 5.6 °C | 79.0 mm | 1.7 mm | — | — |
| November | 30.4 °C | 19.9 °C | 9.6 °C | 24.1 °C | 15.2 °C | 7.4 °C | 20.6 °C | 11.3 °C | 1.4 °C | 164.0 mm | 2.8 mm | — | — |
| December | 29.4 °C | 17.3 °C | 7.0 °C | 19.3 °C | 12.9 °C | 5.9 °C | 17.8 °C | 8.8 °C | -0.8 °C | 97.2 mm | 2.7 mm | — | — |
Data Visualisations
Remove WatermarksCurrent Year Climate Trends vs Historical


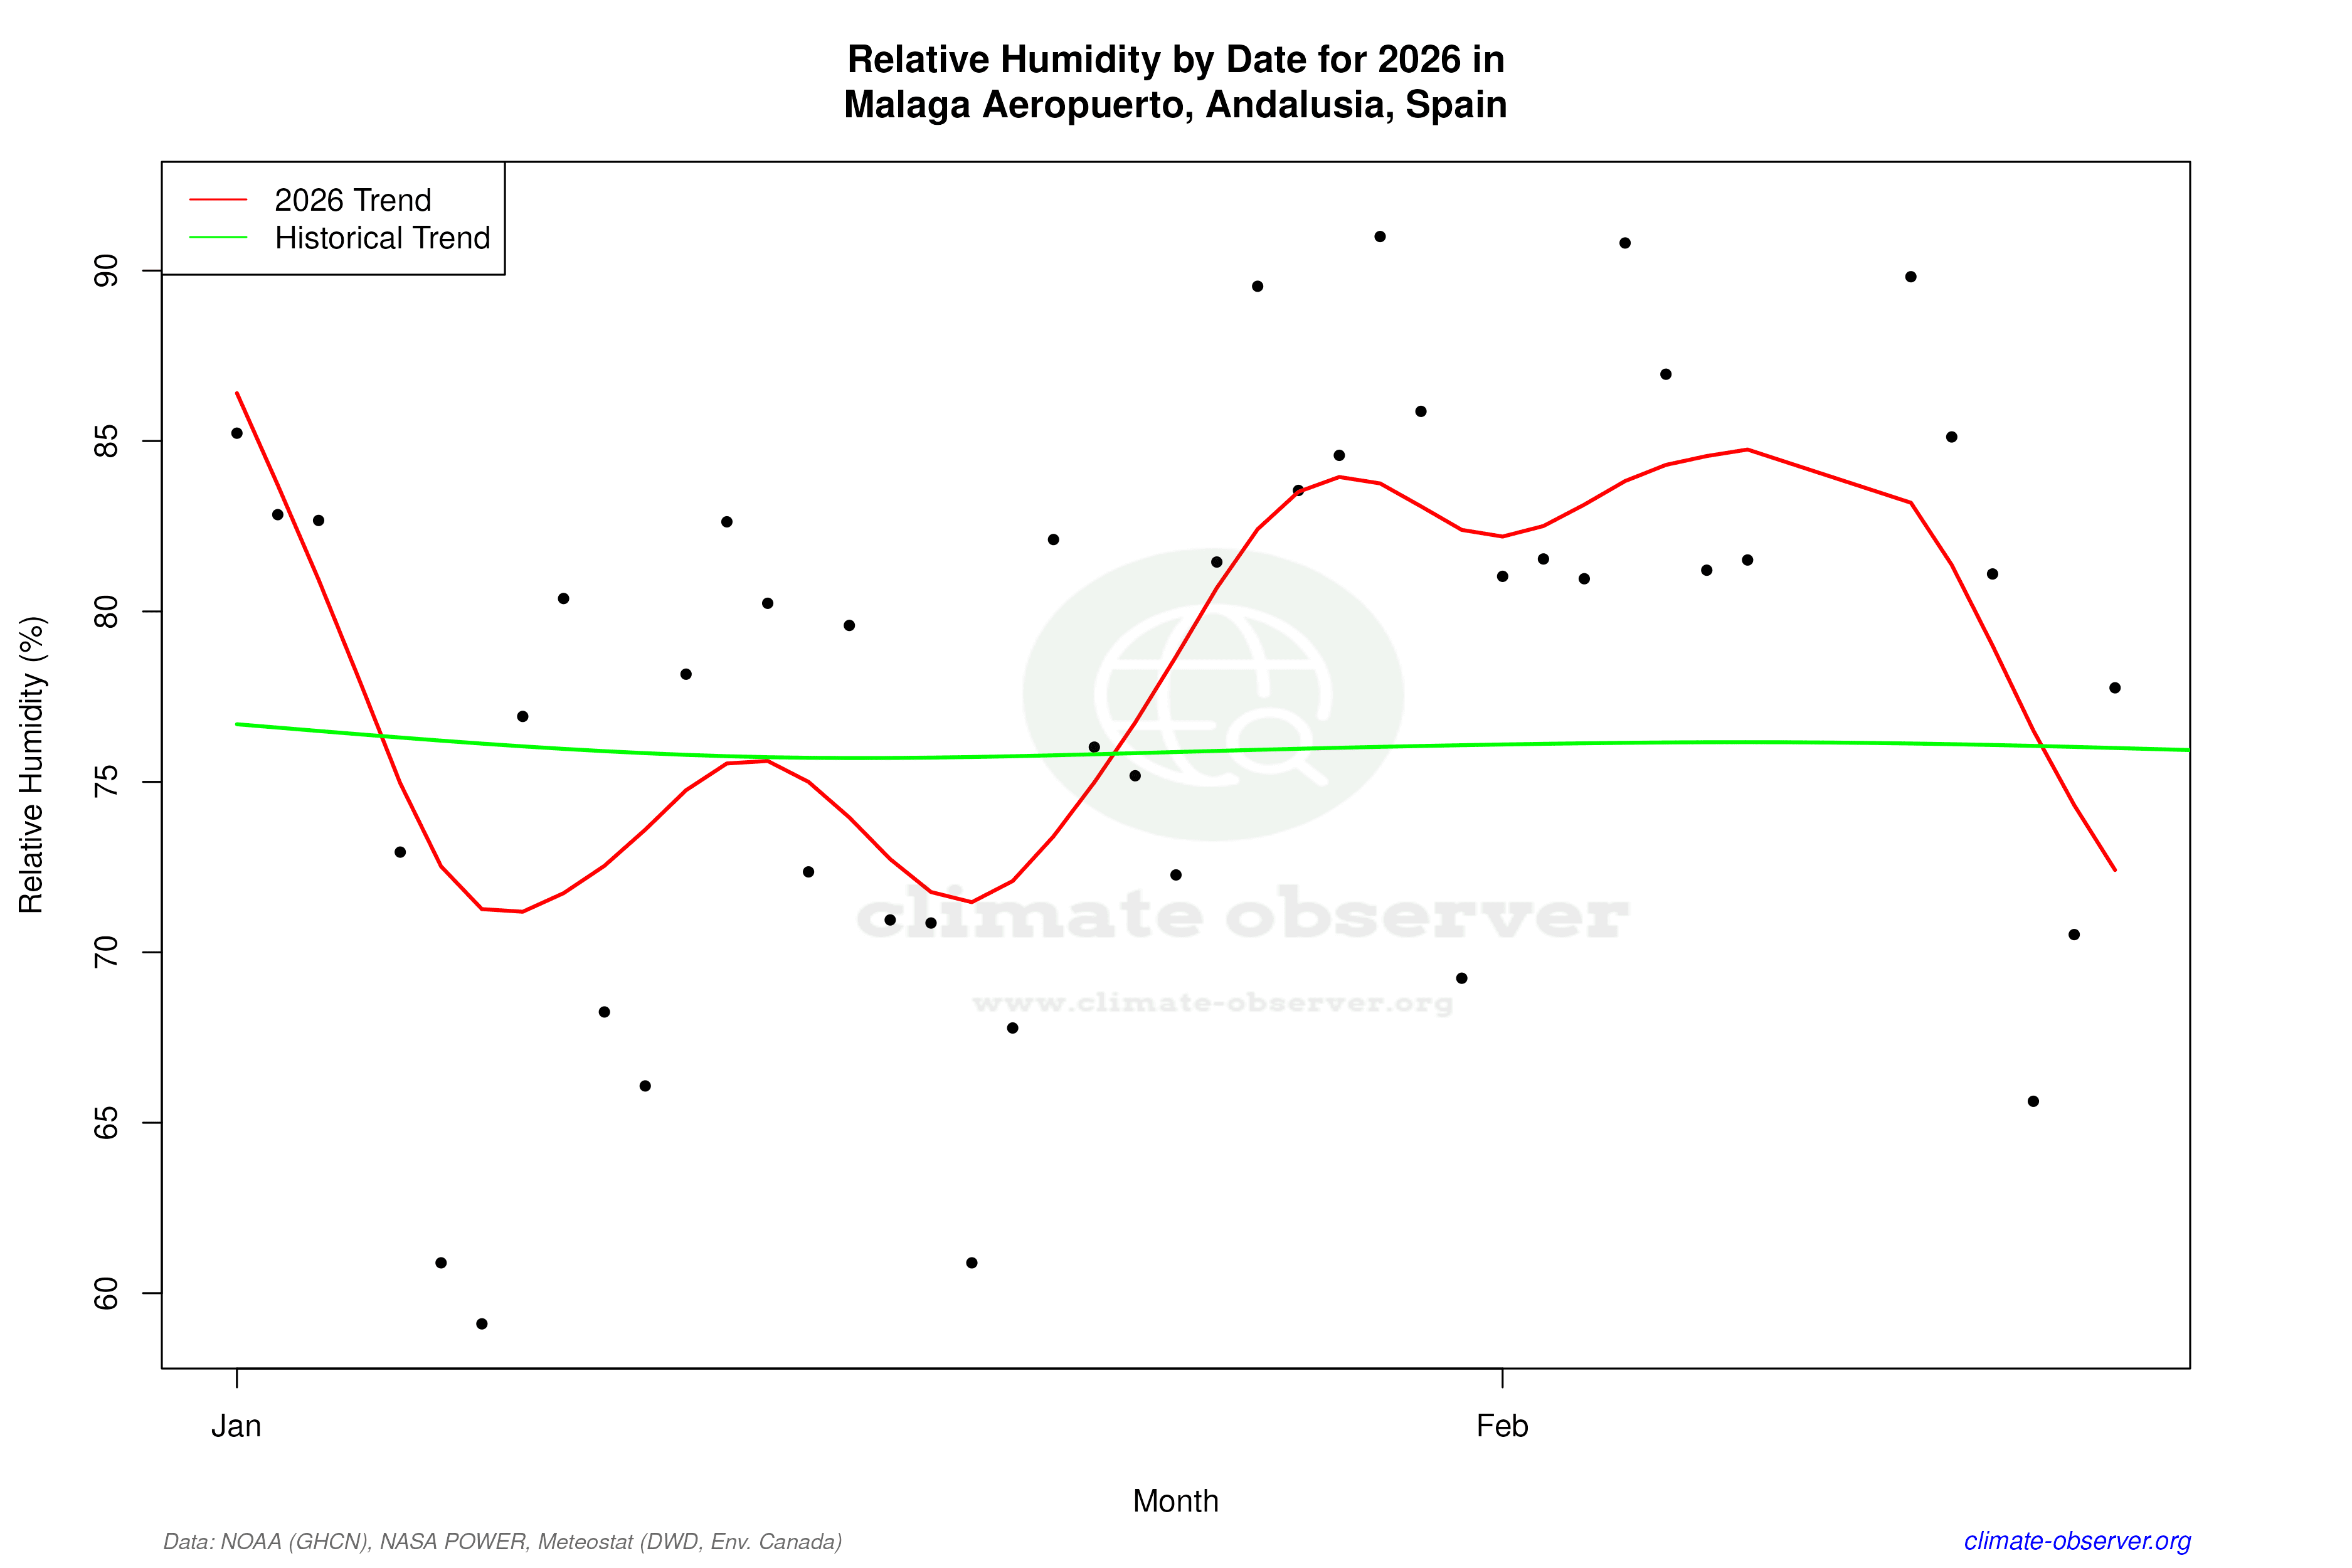

Max Temperature this Year | 1 of 6
Climate 12-Month Moving Averages


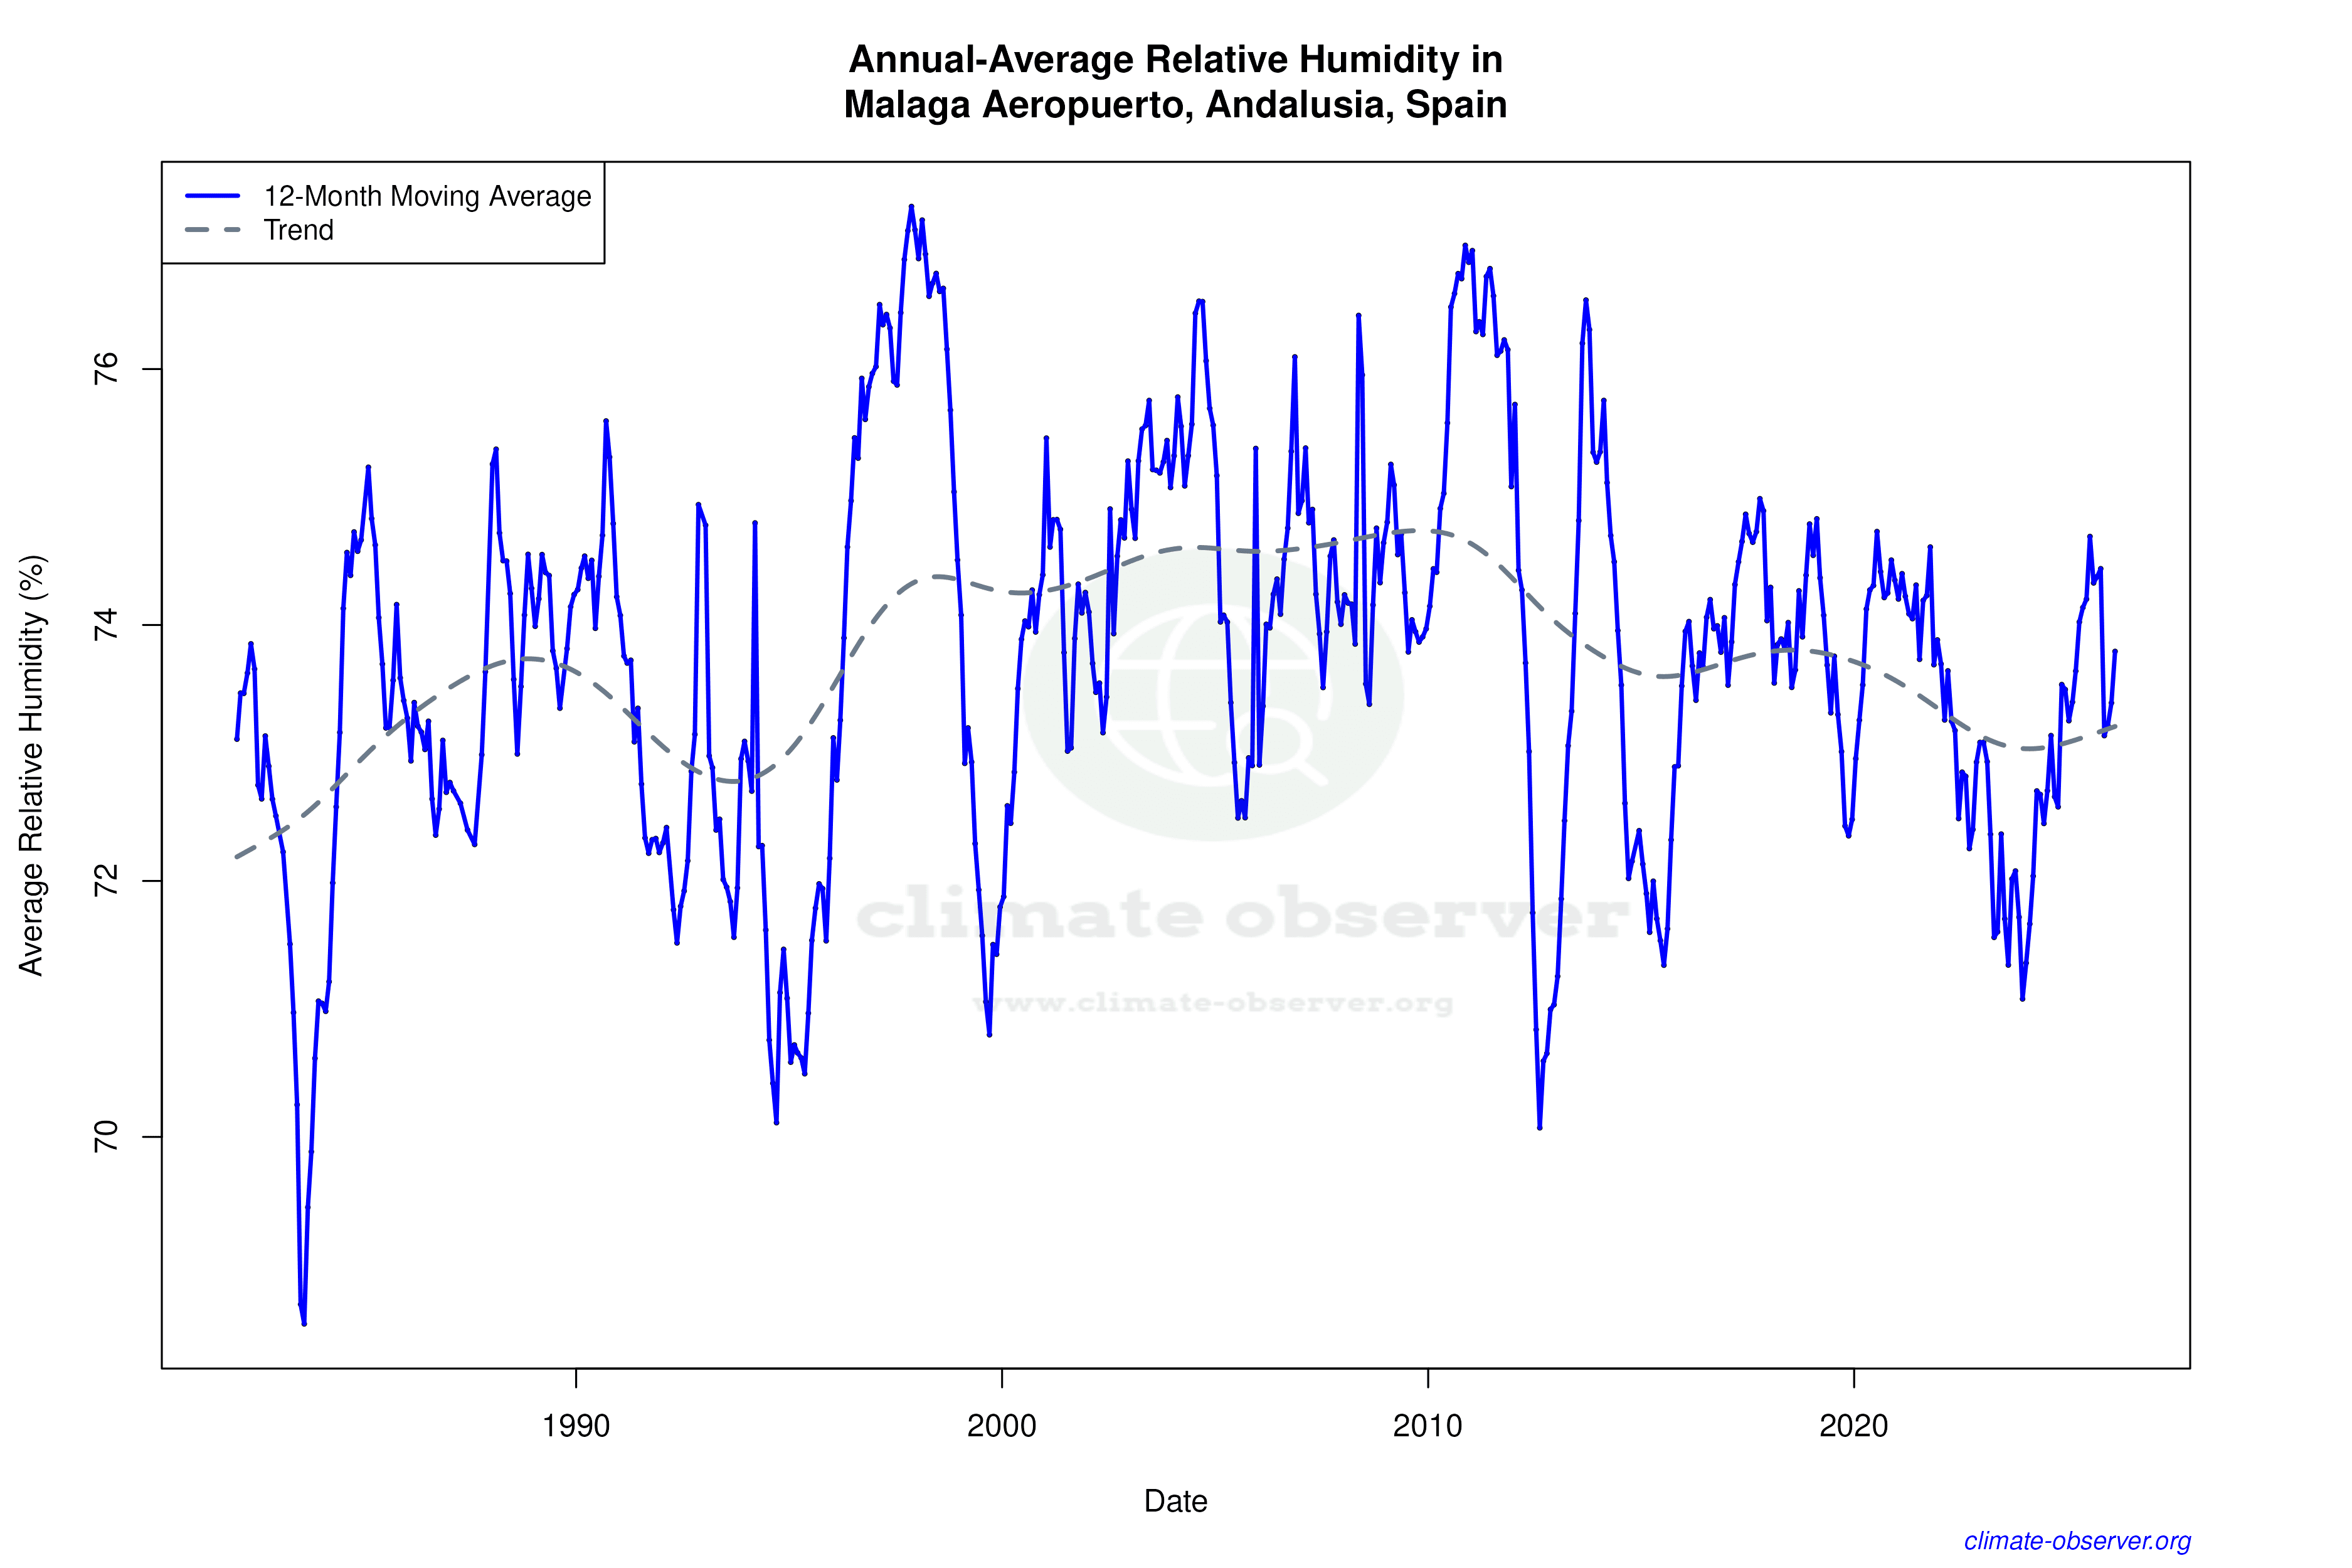

Max Temperature 12-Month MA | 1 of 6
Daily Data Points and Averages Throughout the Year


Average Max Temperature Throughout Year | 1 of 5
