Climate for Station: Juba, Central Equatoria, Sudan
Loading live weather...
Climate Analysis & Overview
Juba, South Sudan, has experienced a notable cooling trend over the past decade, with significant decreases in both high and low temperatures. Meanwhile, the distribution of precipitation has become more even, indicating a shift in local weather patterns. These changes may have implications for the region's climate resilience strategies.
Cooling Trends Amidst a Warming World
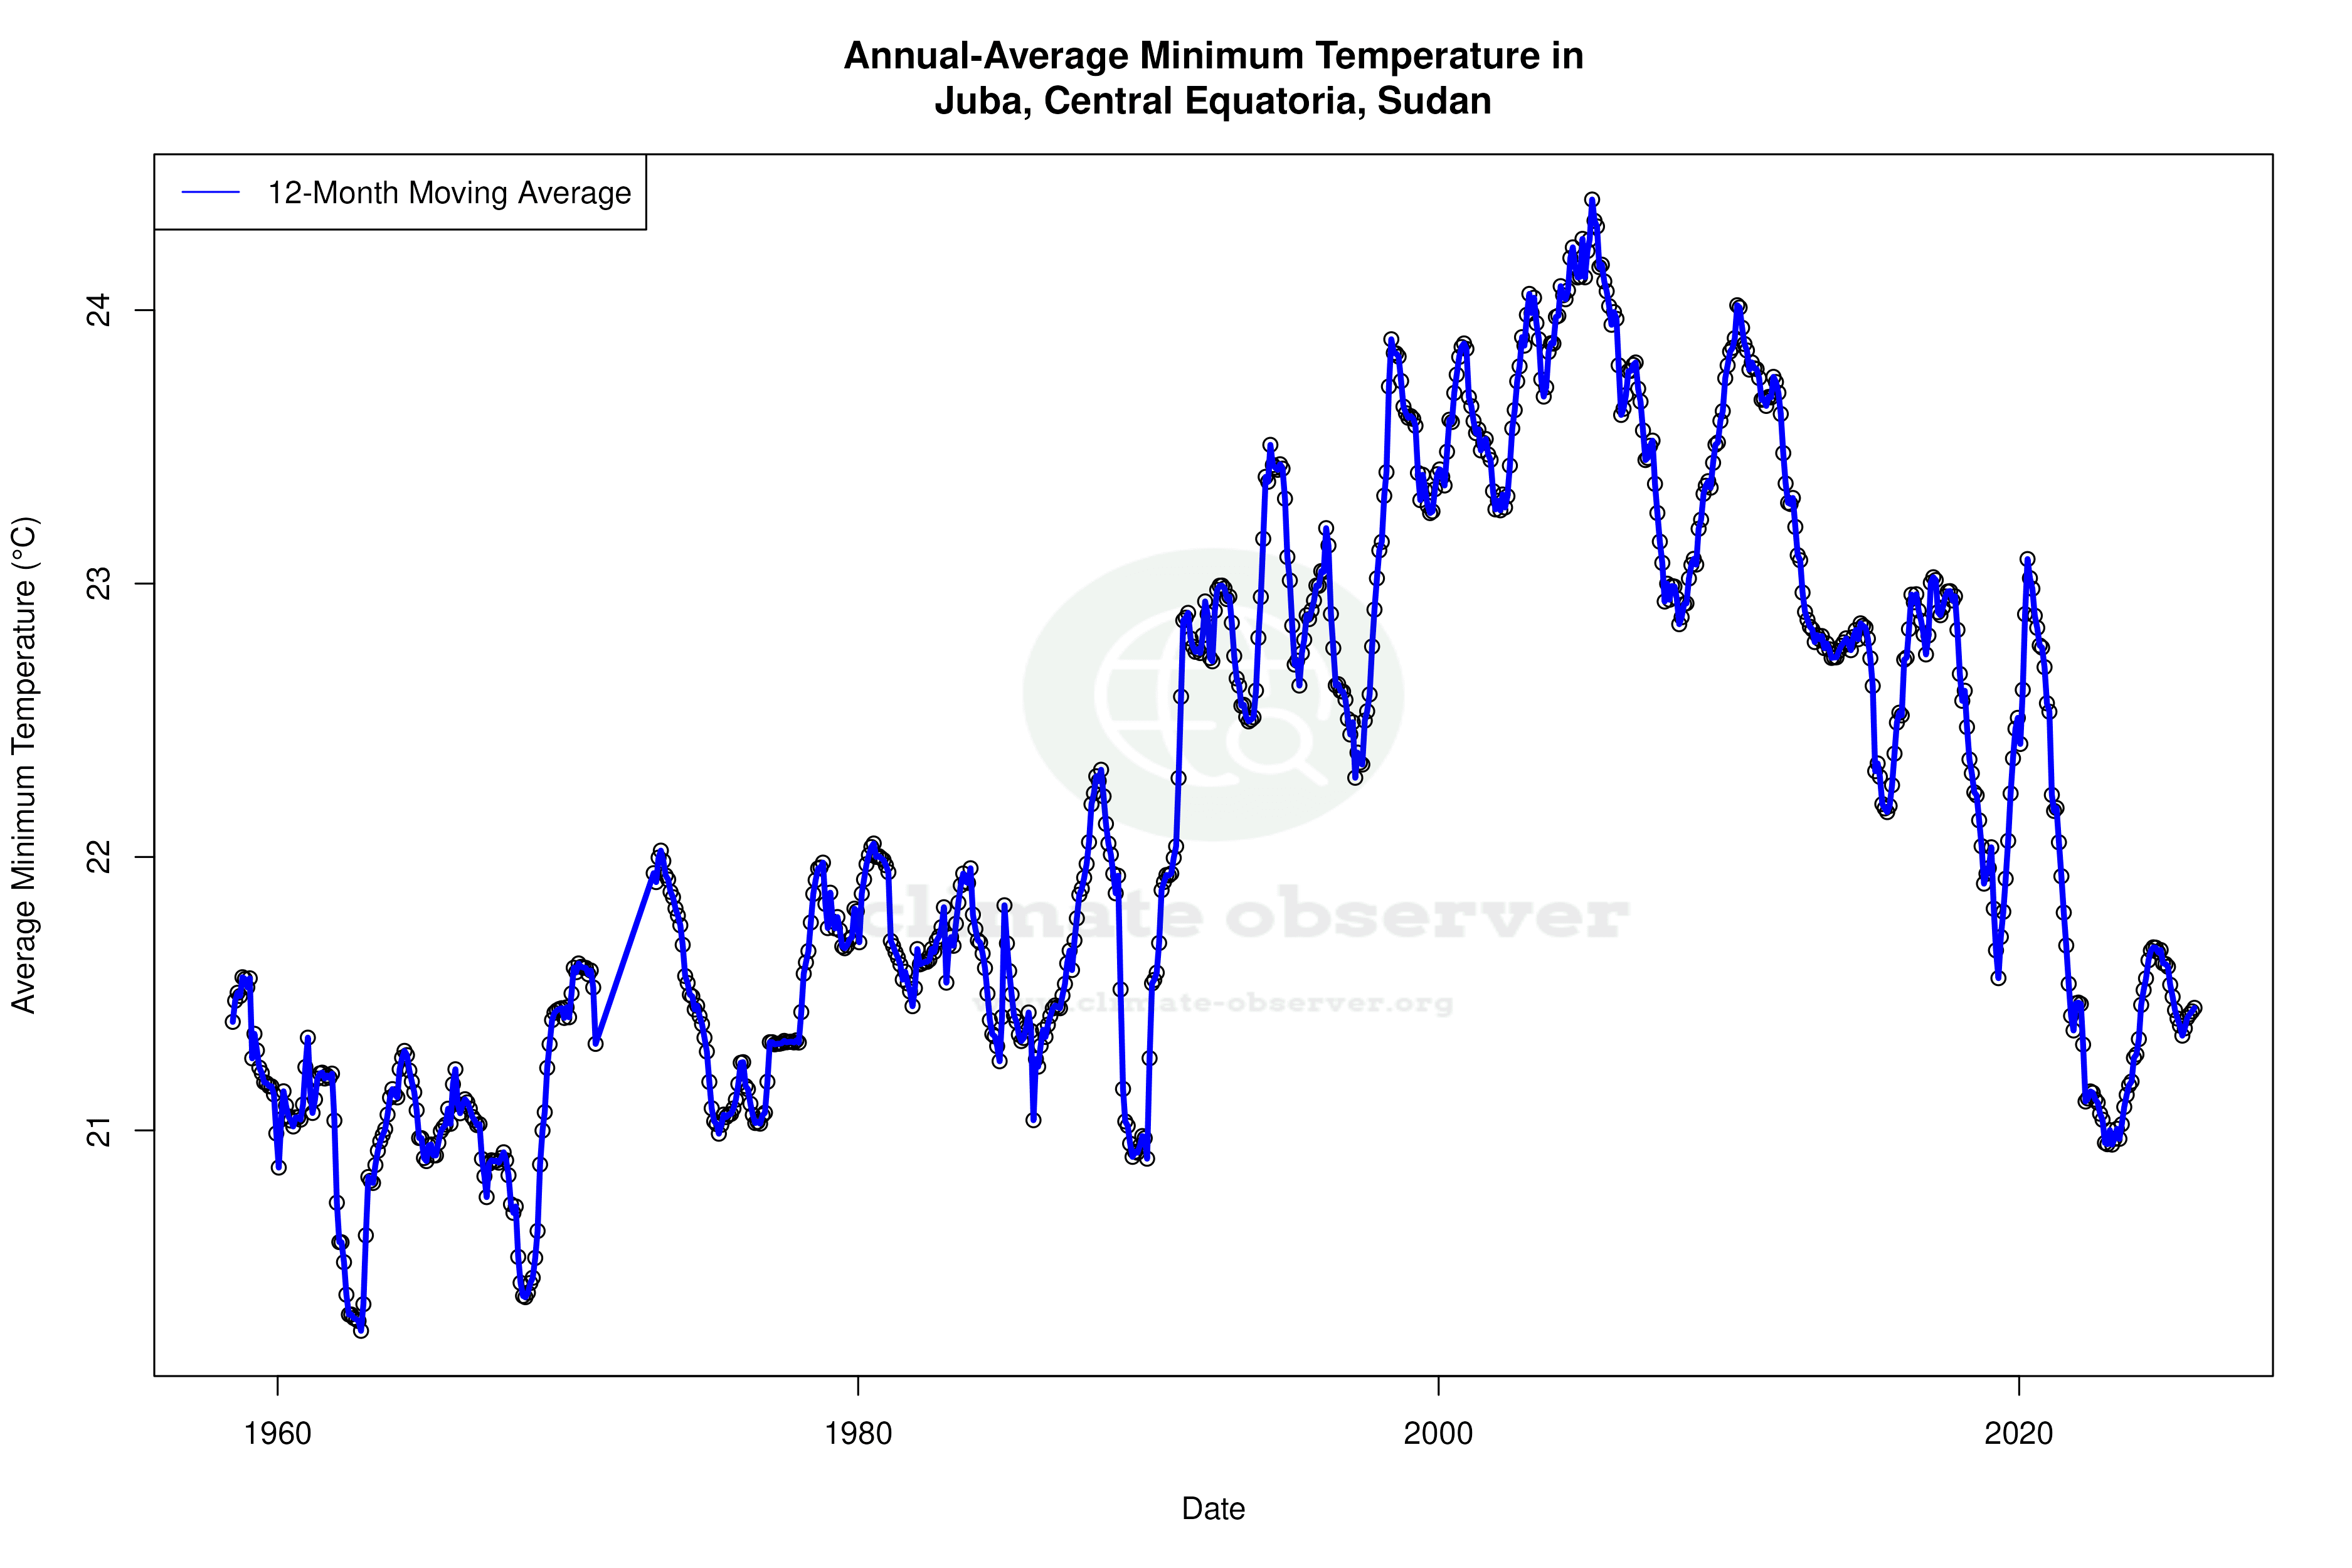
Juba, located in Central Equatoria, South Sudan, falls under the Köppen climate classification of tropical wet and dry (Aw). Over the past decade, Juba has experienced a significant cooling trend, with high temperatures dropping by 2.49°C (4.49°F) and low temperatures by 1.88°C (3.38°F). This localised cooling is in contrast to global warming trends and may be influenced by regional factors such as changes in land use or vegetation cover. Despite these recent trends, the all-time data reveals a more modest cooling of high temperatures by 0.15°C (0.27°F), while low temperatures have seen a slight warming of 0.30°C (0.54°F). These mixed signals highlight the complex nature of climate dynamics in Juba.
Precipitation Patterns: A Shift Towards Evenness
The Precipitation Concentration Index (PCI) in Juba has shown a decrease from a baseline of 14.97 to a current value of 11.90. This indicates that precipitation is now more evenly distributed throughout the year, reducing the likelihood of intense, concentrated rainfall events. Such a shift could have positive implications for agriculture and water management in the region, as it may lead to more reliable water availability and reduced flood risks.
Temperature Extremes: Record Highs and Lows
Juba's climate is marked by its temperature extremes, with a record high of 44.74°C (112.53°F) and a record low of 12.00°C (53.60°F). These extremes underscore the variability and potential challenges faced by the local population in adapting to such conditions. Understanding how these extremes interact with the broader cooling trends is crucial for developing effective climate adaptation strategies.
Regional Implications and Climate Goals
As South Sudan navigates its climate goals, the trends observed in Juba provide valuable insights. The cooling trend, coupled with a more even distribution of precipitation, suggests potential shifts in local climate patterns that could impact agriculture, water resources, and overall climate resilience. These changes should be considered in the context of regional climate initiatives and policies aimed at enhancing sustainability and adaptation in the face of climate change.
Geographical Influences on Climate Dynamics
Juba's geographical position, near the White Nile and surrounded by savannah, plays a significant role in shaping its climate. The interplay between local geography and broader climatic forces may contribute to the observed cooling trends and changes in precipitation patterns. As South Sudan continues to develop its climate strategies, the unique geographical and climatic characteristics of Juba will be essential considerations in planning for a resilient future.
Station Statistics
10-Year Trend
High: -2.37 °C/decade
Low: -1.72 °C/decade
Rain: -1.53 mm/decade
25-Year Trend
High: -2.14 °C/decade
Low: -1.15 °C/decade
Rain: +0.30 mm/decade
50-Year Trend
High: -0.44 °C/decade
Low: +0.14 °C/decade
Rain: +0.02 mm/decade
All-Time Trend
High: -0.16 °C/decade
Low: +0.29 °C/decade
Rain: -0.02 mm/decade
Percentage Above-Average Days
Last 12 Months: 32.6%
This Year: 39.0%
Precipitation Concentration Index (PCI) ℹ️
Last 12 Months: 12.3
Historical Average: 14.3
Percentile Rank of Last 12 Months ℹ️
High: 1st percentile
Low: 32nd percentile
Rain: 18th percentile
Change in Variance ℹ️
High: -5.5%
Low: -50.7%
Intraday: -15.3%
Data Coverage
92.5%
First Year of Data
1957
Station Location
Historical Weather Records
| Max High | Avg High | Min High | Max Avg | Avg Avg | Min Avg | Max Low | Avg Low | Min Low | Max Precipitation | Avg Precipitation | Max Snow | Avg Snow | |
|---|---|---|---|---|---|---|---|---|---|---|---|---|---|
| Record | 44.7 °C | — | 21.4 °C | 39.3 °C | — | 20.4 °C | 31.0 °C | — | 12.0 °C | 116.0 mm | — | — | — |
| January | 42.5 °C | 36.9 °C | 26.0 °C | 38.3 °C | 29.2 °C | 21.0 °C | 28.5 °C | 21.4 °C | 12.0 °C | 21.9 mm | 0.2 mm | — | — |
| February | 44.7 °C | 37.9 °C | 26.8 °C | 37.0 °C | 30.5 °C | 23.1 °C | 29.8 °C | 22.9 °C | 12.8 °C | 40.2 mm | 0.3 mm | — | — |
| March | 44.5 °C | 37.5 °C | 23.7 °C | 39.3 °C | 31.0 °C | 22.7 °C | 30.9 °C | 24.4 °C | 16.1 °C | 47.0 mm | 1.1 mm | — | — |
| April | 44.1 °C | 35.6 °C | 22.3 °C | 36.4 °C | 29.5 °C | 22.1 °C | 31.0 °C | 24.0 °C | 16.5 °C | 107.0 mm | 2.6 mm | — | — |
| May | 42.1 °C | 33.3 °C | 23.5 °C | 34.6 °C | 27.7 °C | 21.9 °C | 29.0 °C | 23.0 °C | 16.8 °C | 103.8 mm | 4.4 mm | — | — |
| June | 39.7 °C | 32.0 °C | 23.2 °C | 32.8 °C | 26.5 °C | 22.3 °C | 26.7 °C | 22.1 °C | 17.5 °C | 84.0 mm | 3.9 mm | — | — |
| July | 38.7 °C | 30.6 °C | 21.4 °C | 32.2 °C | 25.3 °C | 21.1 °C | 26.3 °C | 21.3 °C | 16.8 °C | 81.0 mm | 4.3 mm | — | — |
| August | 38.5 °C | 30.7 °C | 22.5 °C | 31.8 °C | 25.2 °C | 21.2 °C | 24.8 °C | 21.1 °C | 16.7 °C | 112.0 mm | 4.6 mm | — | — |
| September | 40.3 °C | 32.2 °C | 23.8 °C | 32.5 °C | 26.1 °C | 21.0 °C | 26.7 °C | 21.4 °C | 17.8 °C | 78.0 mm | 3.8 mm | — | — |
| October | 40.4 °C | 33.1 °C | 23.7 °C | 32.7 °C | 26.6 °C | 20.7 °C | 27.4 °C | 21.7 °C | 17.2 °C | 116.0 mm | 3.4 mm | — | — |
| November | 40.0 °C | 34.1 °C | 23.5 °C | 33.9 °C | 27.3 °C | 22.1 °C | 26.1 °C | 21.5 °C | 15.8 °C | 59.5 mm | 1.6 mm | — | — |
| December | 42.8 °C | 35.7 °C | 23.7 °C | 34.5 °C | 28.3 °C | 20.4 °C | 28.5 °C | 21.2 °C | 13.9 °C | 81.2 mm | 0.5 mm | — | — |
Data Visualisations
Remove WatermarksCurrent Year Climate Trends vs Historical


Max Temperature this Year | 1 of 6
Climate 12-Month Moving Averages
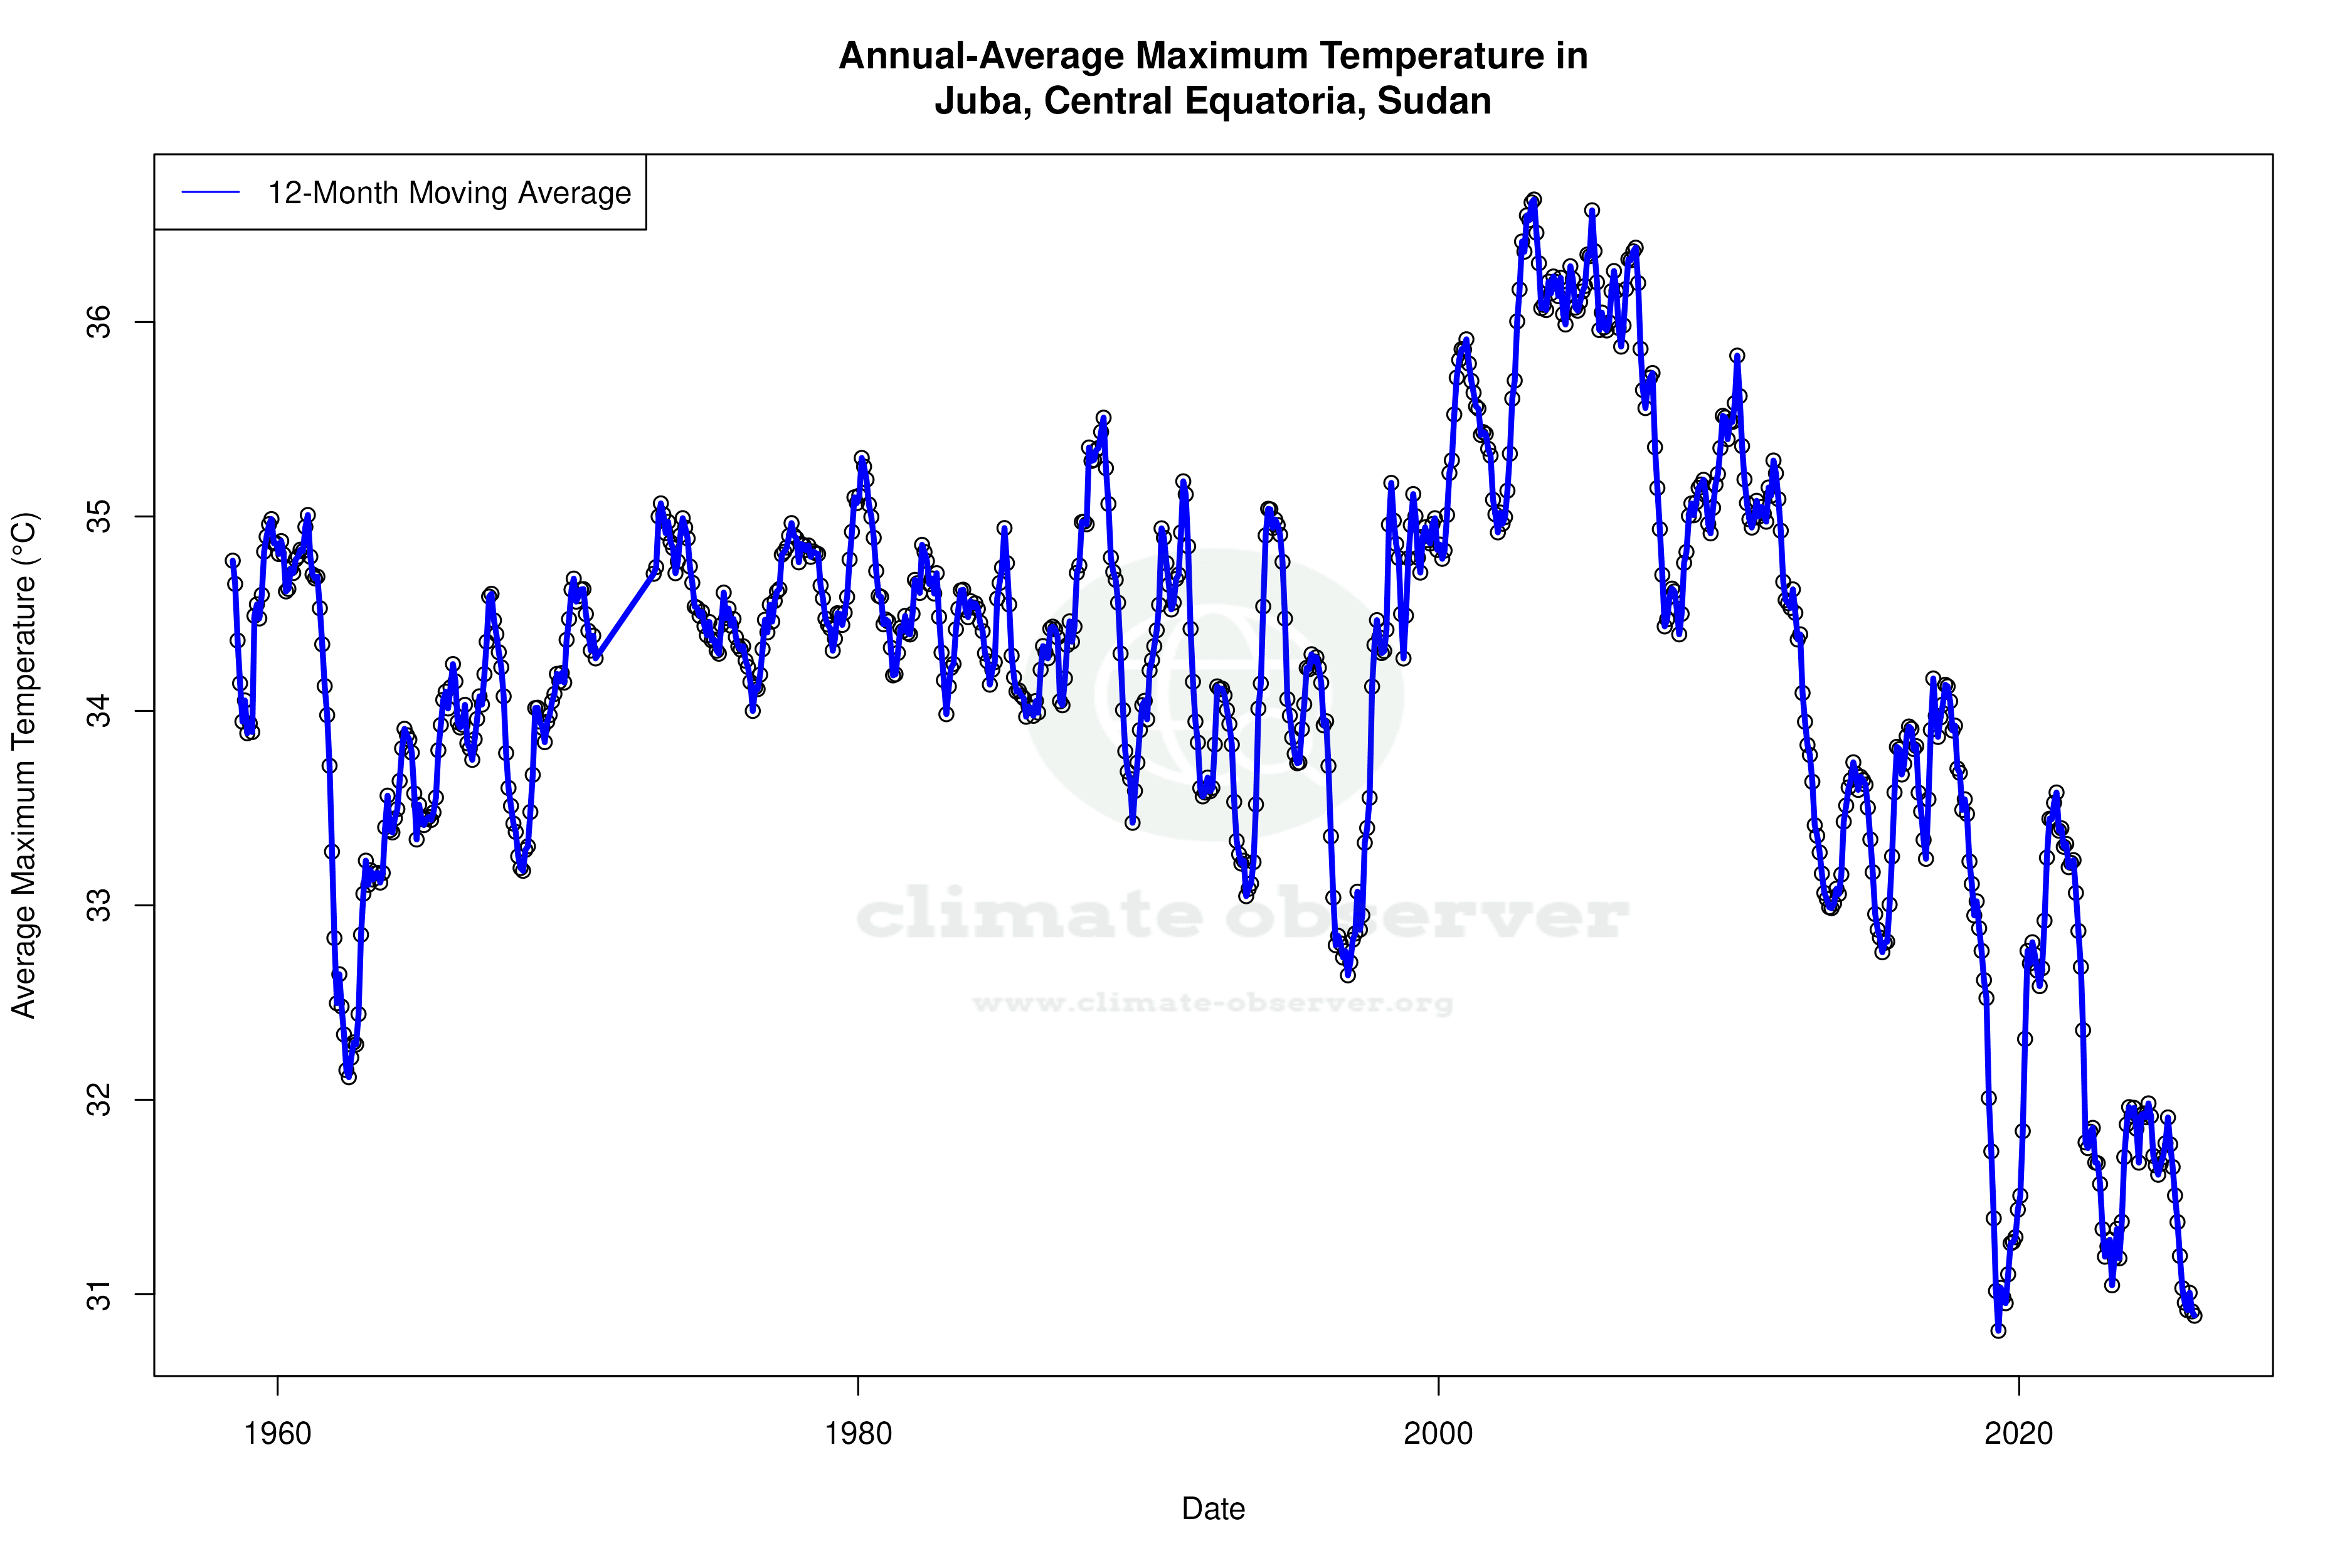


Max Temperature 12-Month MA | 1 of 6
Daily Data Points and Averages Throughout the Year


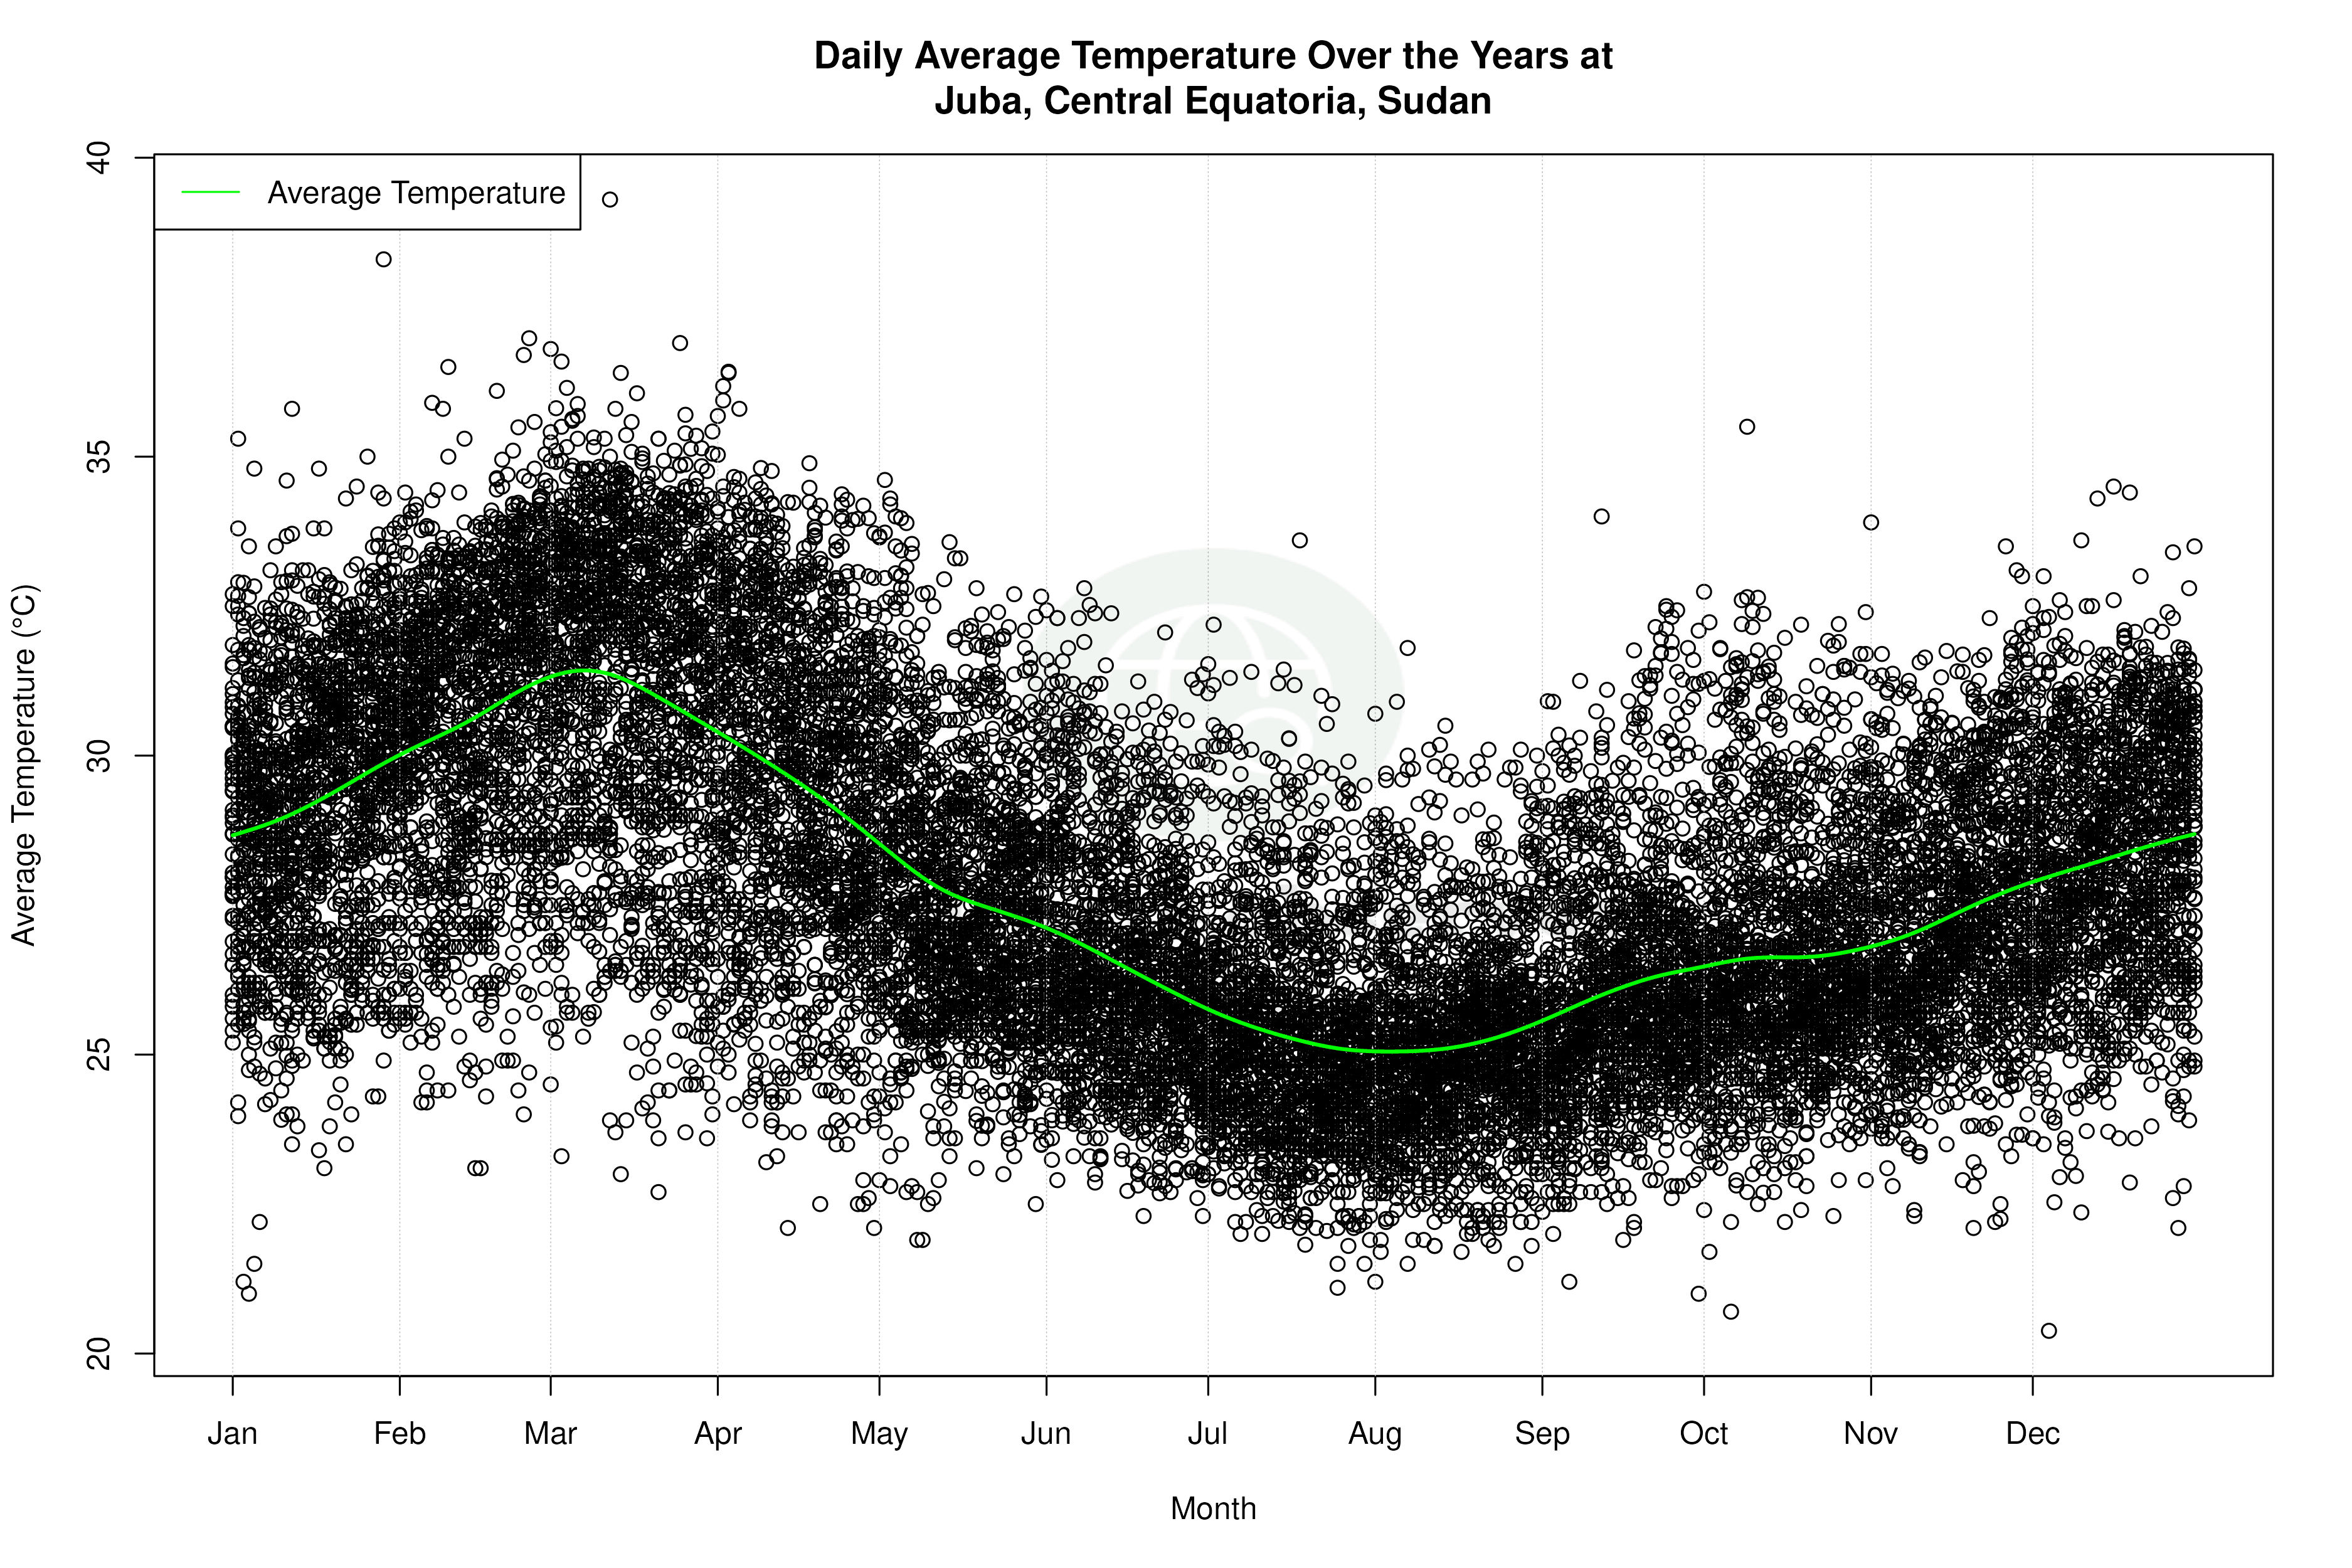


Average Max Temperature Throughout Year | 1 of 5
