Climate for Station: Stockholm, Sweden
Loading live weather...
Climate Analysis & Overview
Stockholm's climate profile reveals a complex interplay of historical warming trends with recent cooling intervals, reflecting a nuanced climatic shift. The city experiences a more even distribution of precipitation, aligning with Sweden's goals for climate resilience and adaptation.
Stockholm's Climatic Identity
Stockholm, located at 59.35°N, 18.05°E, is characterised by a humid continental climate, classified as Dfb in the Köppen system. This climate type is defined by cold winters and mild to warm summers, influenced by the Baltic Sea's moderating effects. The city's proximity to water bodies tempers extreme temperatures, contributing to its relatively stable climate profile. The all-time temperature trends show a warming pattern, with highs increasing by 0.17°C (0.31°F) and lows by 0.23°C (0.41°F), indicative of a long-term rise in temperatures.
Recent Cooling Anomalies
Despite the long-term warming, the past decade has seen a surprising cooling trend in Stockholm. High temperatures have decreased by 0.34°C (0.61°F) and lows by 0.06°C (0.11°F). This recent cooling may be attributed to regional climate variability and short-term atmospheric patterns. It serves as a reminder of the complex dynamics at play in local climate systems, where short-term trends can diverge from long-term trajectories.
Temperature Extremes and Records
Stockholm has recorded a maximum temperature of 35.4°C (95.7°F) and a minimum of -28.2°C (-18.8°F). These extremes highlight the city's potential for significant temperature fluctuations, although such events are moderated by its geographical setting. The historical data underscores the importance of preparing for both heatwaves and severe cold spells, which can impact infrastructure and public health.
Precipitation Patterns and Distribution
The Precipitation Concentration Index (PCI) for Stockholm has decreased from a baseline of 12.04 to a current value of 9.91. This change indicates a more even distribution of rainfall throughout the year, reducing the risk of intense, concentrated rain events that can lead to flooding. Such a trend aligns with Sweden's regional climate goals of enhancing resilience to climate change impacts by promoting water resource management and infrastructure adaptation.
Climate Goals and Future Outlook
Sweden is committed to ambitious climate goals, aiming for a fossil-free welfare state by 2045. Stockholm's evolving climate profile, with its recent cooling trend and more evenly distributed precipitation, provides valuable insights for policymakers. These trends can inform strategies to mitigate climate risks and enhance urban resilience, ensuring that Stockholm continues to thrive in a changing climate.
Station Statistics
10-Year Trend
High: -0.65 °C/decade
Low: -0.12 °C/decade
Rain: -0.24 mm/decade
25-Year Trend
High: +0.33 °C/decade
Low: +0.35 °C/decade
Rain: -0.13 mm/decade
50-Year Trend
High: +0.53 °C/decade
Low: +0.49 °C/decade
Rain: -0.04 mm/decade
All-Time Trend
High: +0.17 °C/decade
Low: +0.23 °C/decade
Rain: +0.01 mm/decade
Percentage Above-Average Days
Last 12 Months: 52.6%
This Year: 74.9%
Precipitation Concentration Index (PCI) ℹ️
Last 12 Months: 8.9
Historical Average: 11.4
Percentile Rank of Last 12 Months ℹ️
High: 83rd percentile
Low: 97th percentile
Rain: 9th percentile
Change in Variance ℹ️
High: -0.7%
Low: -12.3%
Intraday: +11.7%
Data Coverage
75.2%
First Year of Data
1859
Station Location
Historical Weather Records
| Max High | Avg High | Min High | Max Avg | Avg Avg | Min Avg | Max Low | Avg Low | Min Low | Max Precipitation | Avg Precipitation | Max Snow | Avg Snow | |
|---|---|---|---|---|---|---|---|---|---|---|---|---|---|
| Record | 35.4 °C | — | -21.2 °C | 26.9 °C | — | -25.1 °C | 23.0 °C | — | -28.2 °C | 77.8 mm | — | — | — |
| January | 11.0 °C | -0.2 °C | -21.2 °C | 8.0 °C | -2.4 °C | -25.1 °C | 6.8 °C | -4.5 °C | -28.2 °C | 26.6 mm | 1.1 mm | — | — |
| February | 12.2 °C | -0.1 °C | -18.9 °C | 9.4 °C | -2.4 °C | -20.8 °C | 8.8 °C | -5.0 °C | -25.5 °C | 23.0 mm | 1.0 mm | — | — |
| March | 17.8 °C | 3.2 °C | -12.0 °C | 11.8 °C | 0.7 °C | -14.9 °C | 9.0 °C | -2.8 °C | -22.5 °C | 20.6 mm | 0.8 mm | — | — |
| April | 26.1 °C | 8.7 °C | -4.4 °C | 17.7 °C | 5.1 °C | -3.2 °C | 12.2 °C | 1.0 °C | -12.0 °C | 37.2 mm | 1.0 mm | — | — |
| May | 29.0 °C | 15.2 °C | 0.0 °C | 20.9 °C | 10.8 °C | 1.4 °C | 17.3 °C | 5.9 °C | -4.5 °C | 46.8 mm | 1.1 mm | — | — |
| June | 32.2 °C | 19.8 °C | 6.0 °C | 24.7 °C | 15.3 °C | 5.8 °C | 20.3 °C | 10.7 °C | 0.0 °C | 45.8 mm | 1.6 mm | — | — |
| July | 34.6 °C | 22.2 °C | 9.0 °C | 26.9 °C | 17.8 °C | 9.0 °C | 23.0 °C | 13.6 °C | 6.0 °C | 77.8 mm | 2.1 mm | — | — |
| August | 35.4 °C | 20.4 °C | 9.9 °C | 26.0 °C | 16.6 °C | 8.6 °C | 22.8 °C | 12.8 °C | 3.5 °C | 68.3 mm | 2.2 mm | — | — |
| September | 27.9 °C | 15.5 °C | 5.8 °C | 20.5 °C | 12.1 °C | 2.7 °C | 18.4 °C | 9.0 °C | -1.5 °C | 44.4 mm | 1.7 mm | — | — |
| October | 20.2 °C | 9.6 °C | -1.6 °C | 15.8 °C | 7.1 °C | -3.8 °C | 14.0 °C | 4.7 °C | -9.0 °C | 38.4 mm | 1.6 mm | — | — |
| November | 15.0 °C | 4.5 °C | -10.0 °C | 13.4 °C | 2.6 °C | -9.9 °C | 11.2 °C | 0.6 °C | -18.0 °C | 40.3 mm | 1.5 mm | — | — |
| December | 12.7 °C | 1.5 °C | -14.9 °C | 11.3 °C | -1.0 °C | -18.5 °C | 9.7 °C | -2.6 °C | -21.0 °C | 32.5 mm | 1.4 mm | — | — |
Data Visualisations
Remove WatermarksCurrent Year Climate Trends vs Historical

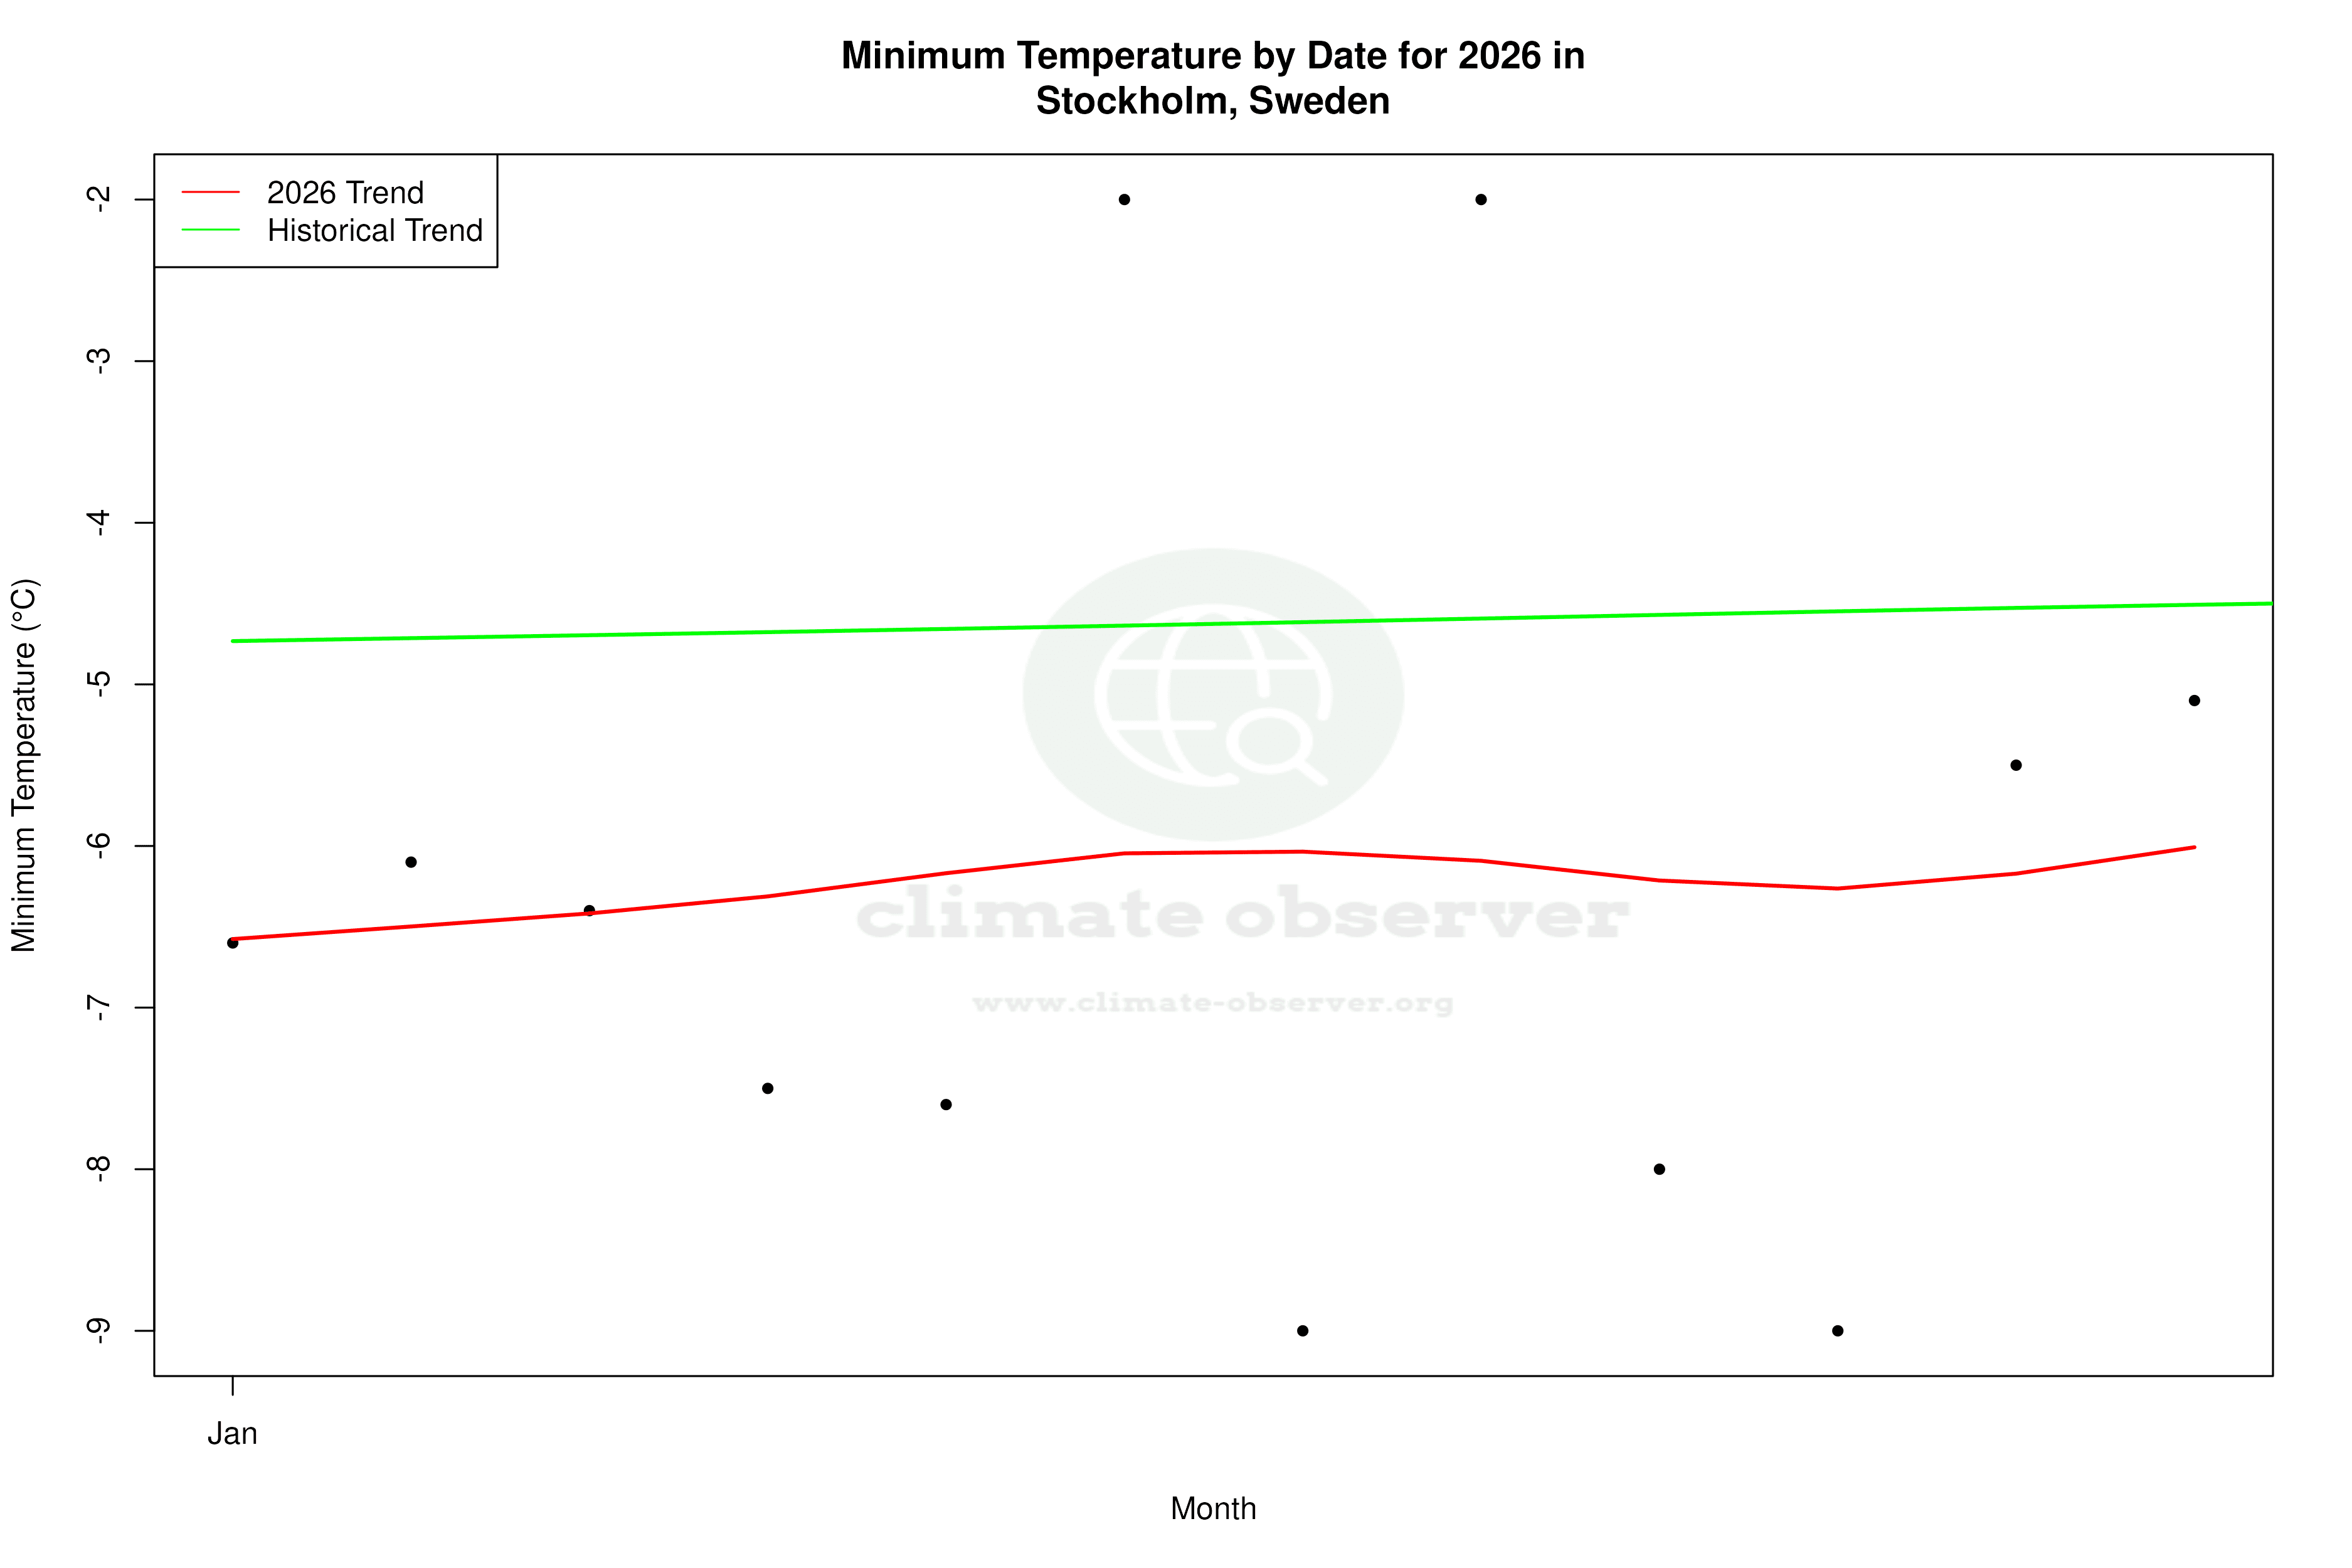


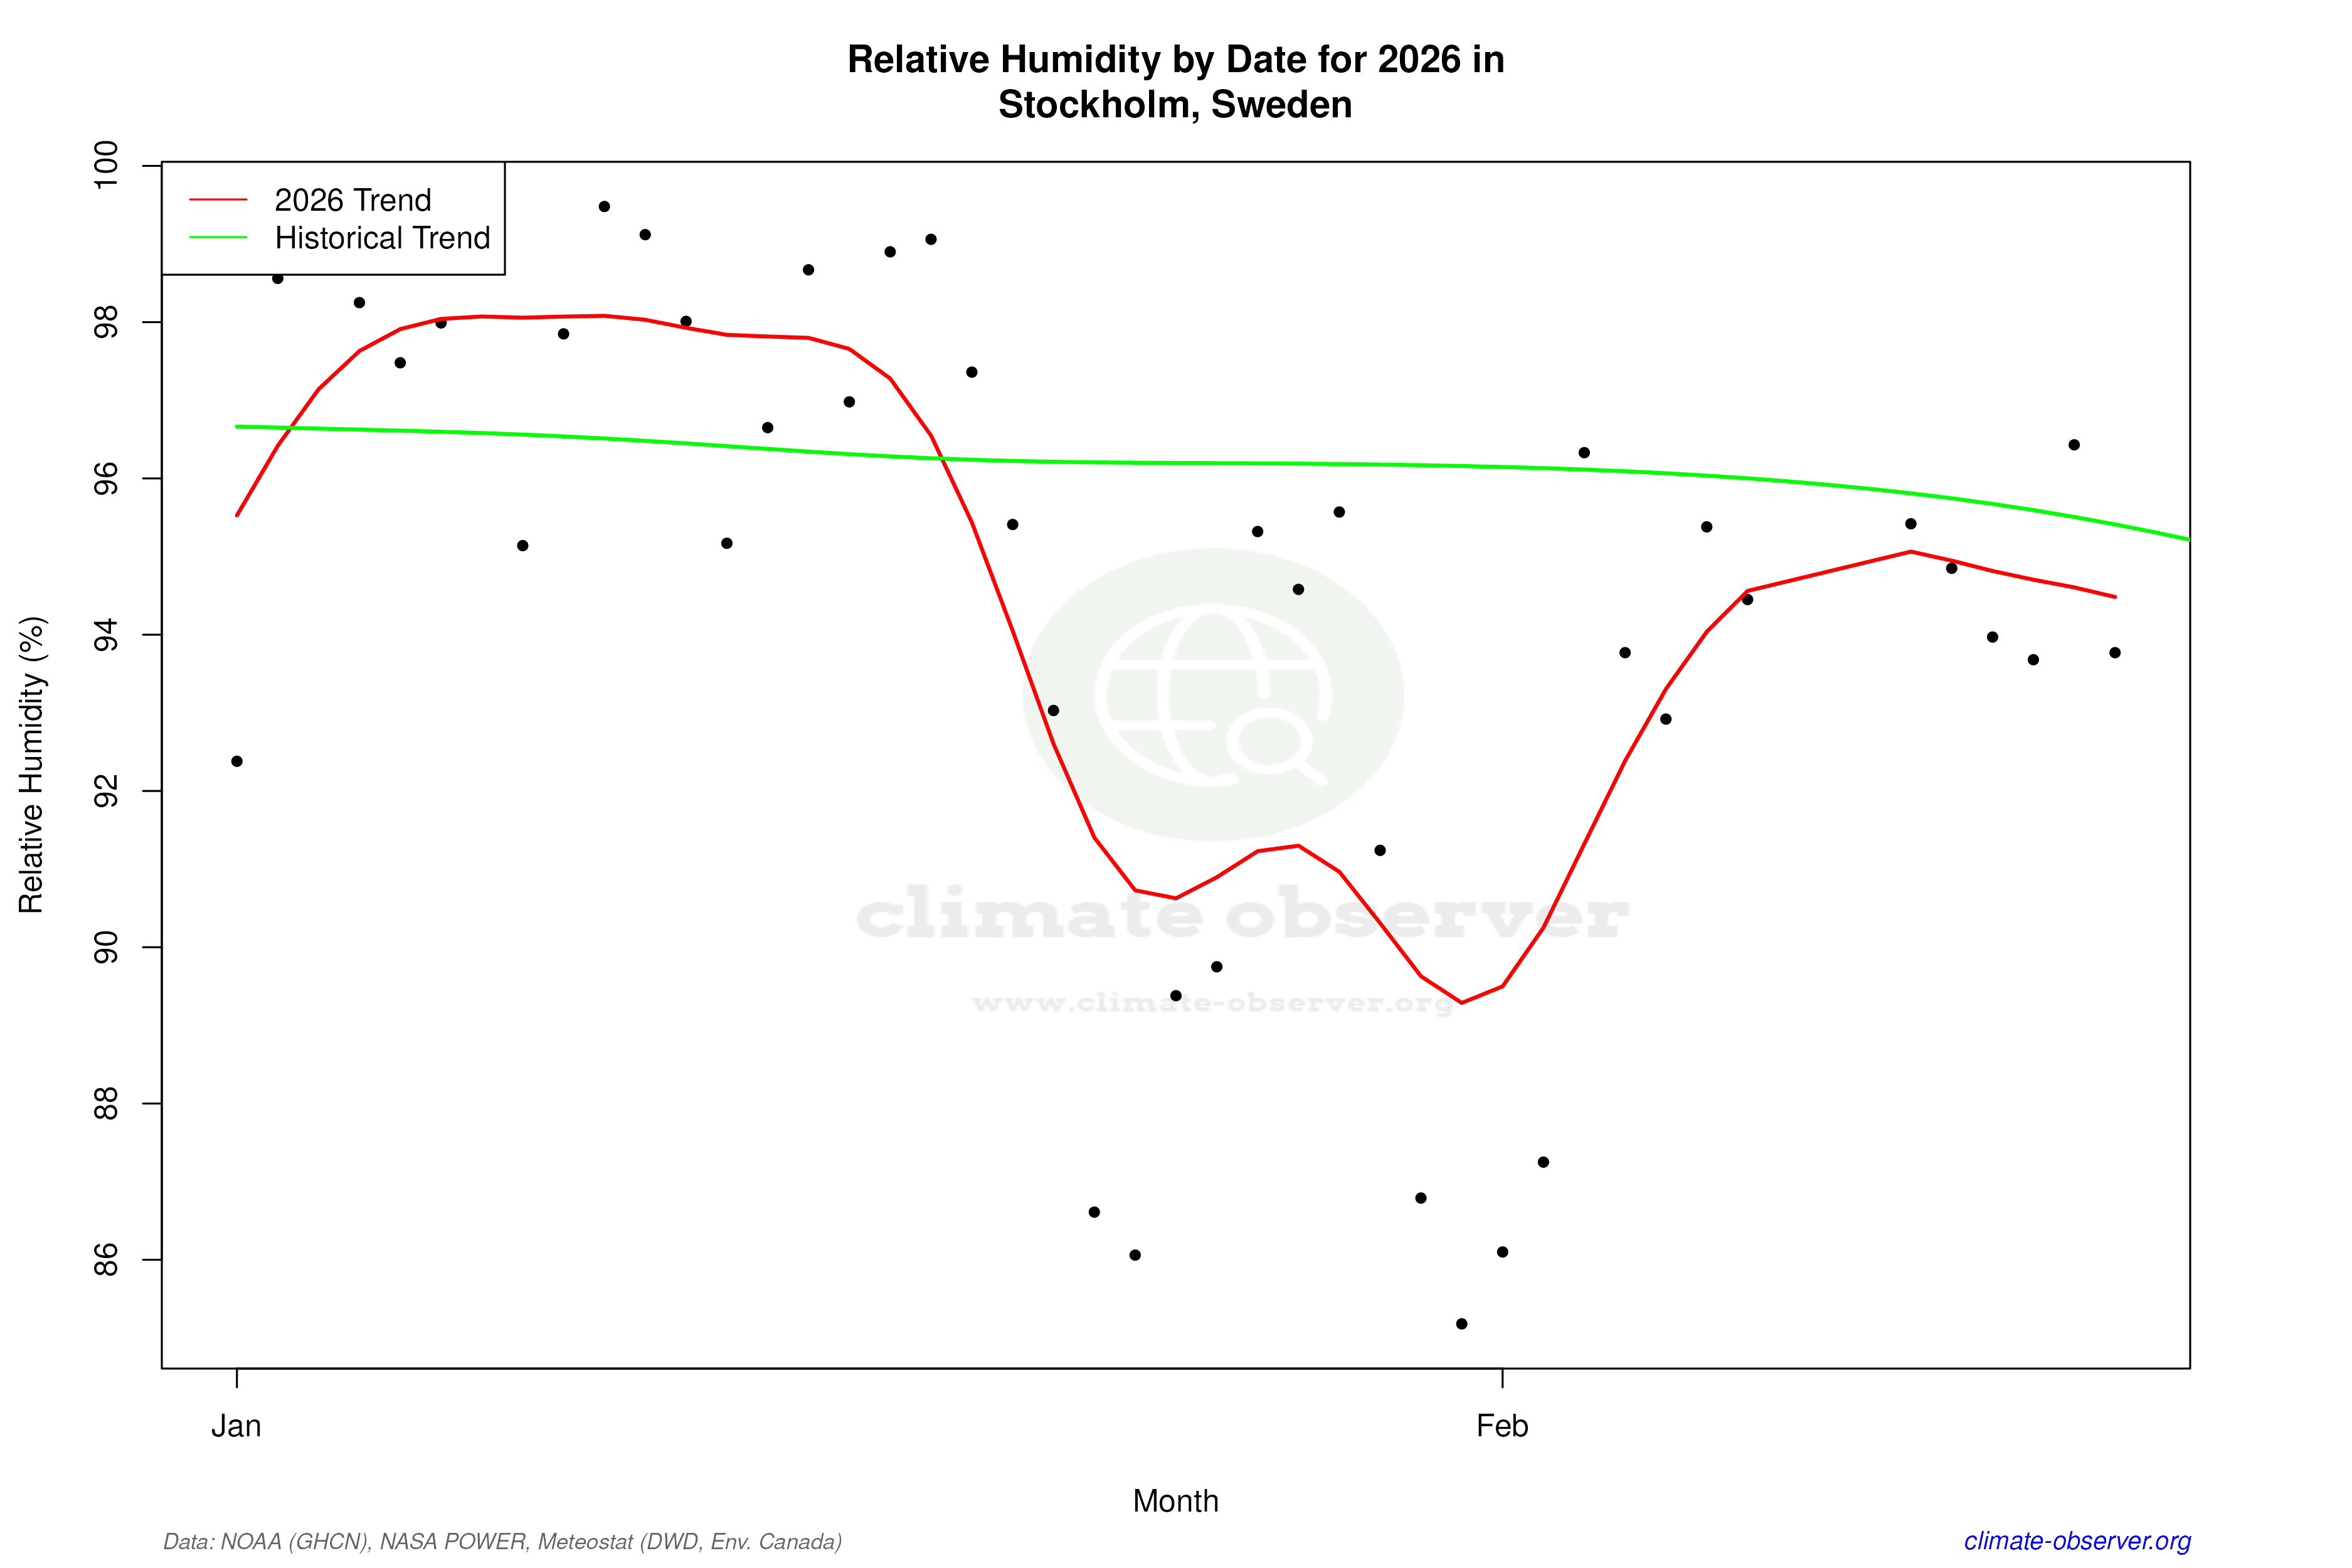

Max Temperature this Year | 1 of 6
Climate 12-Month Moving Averages


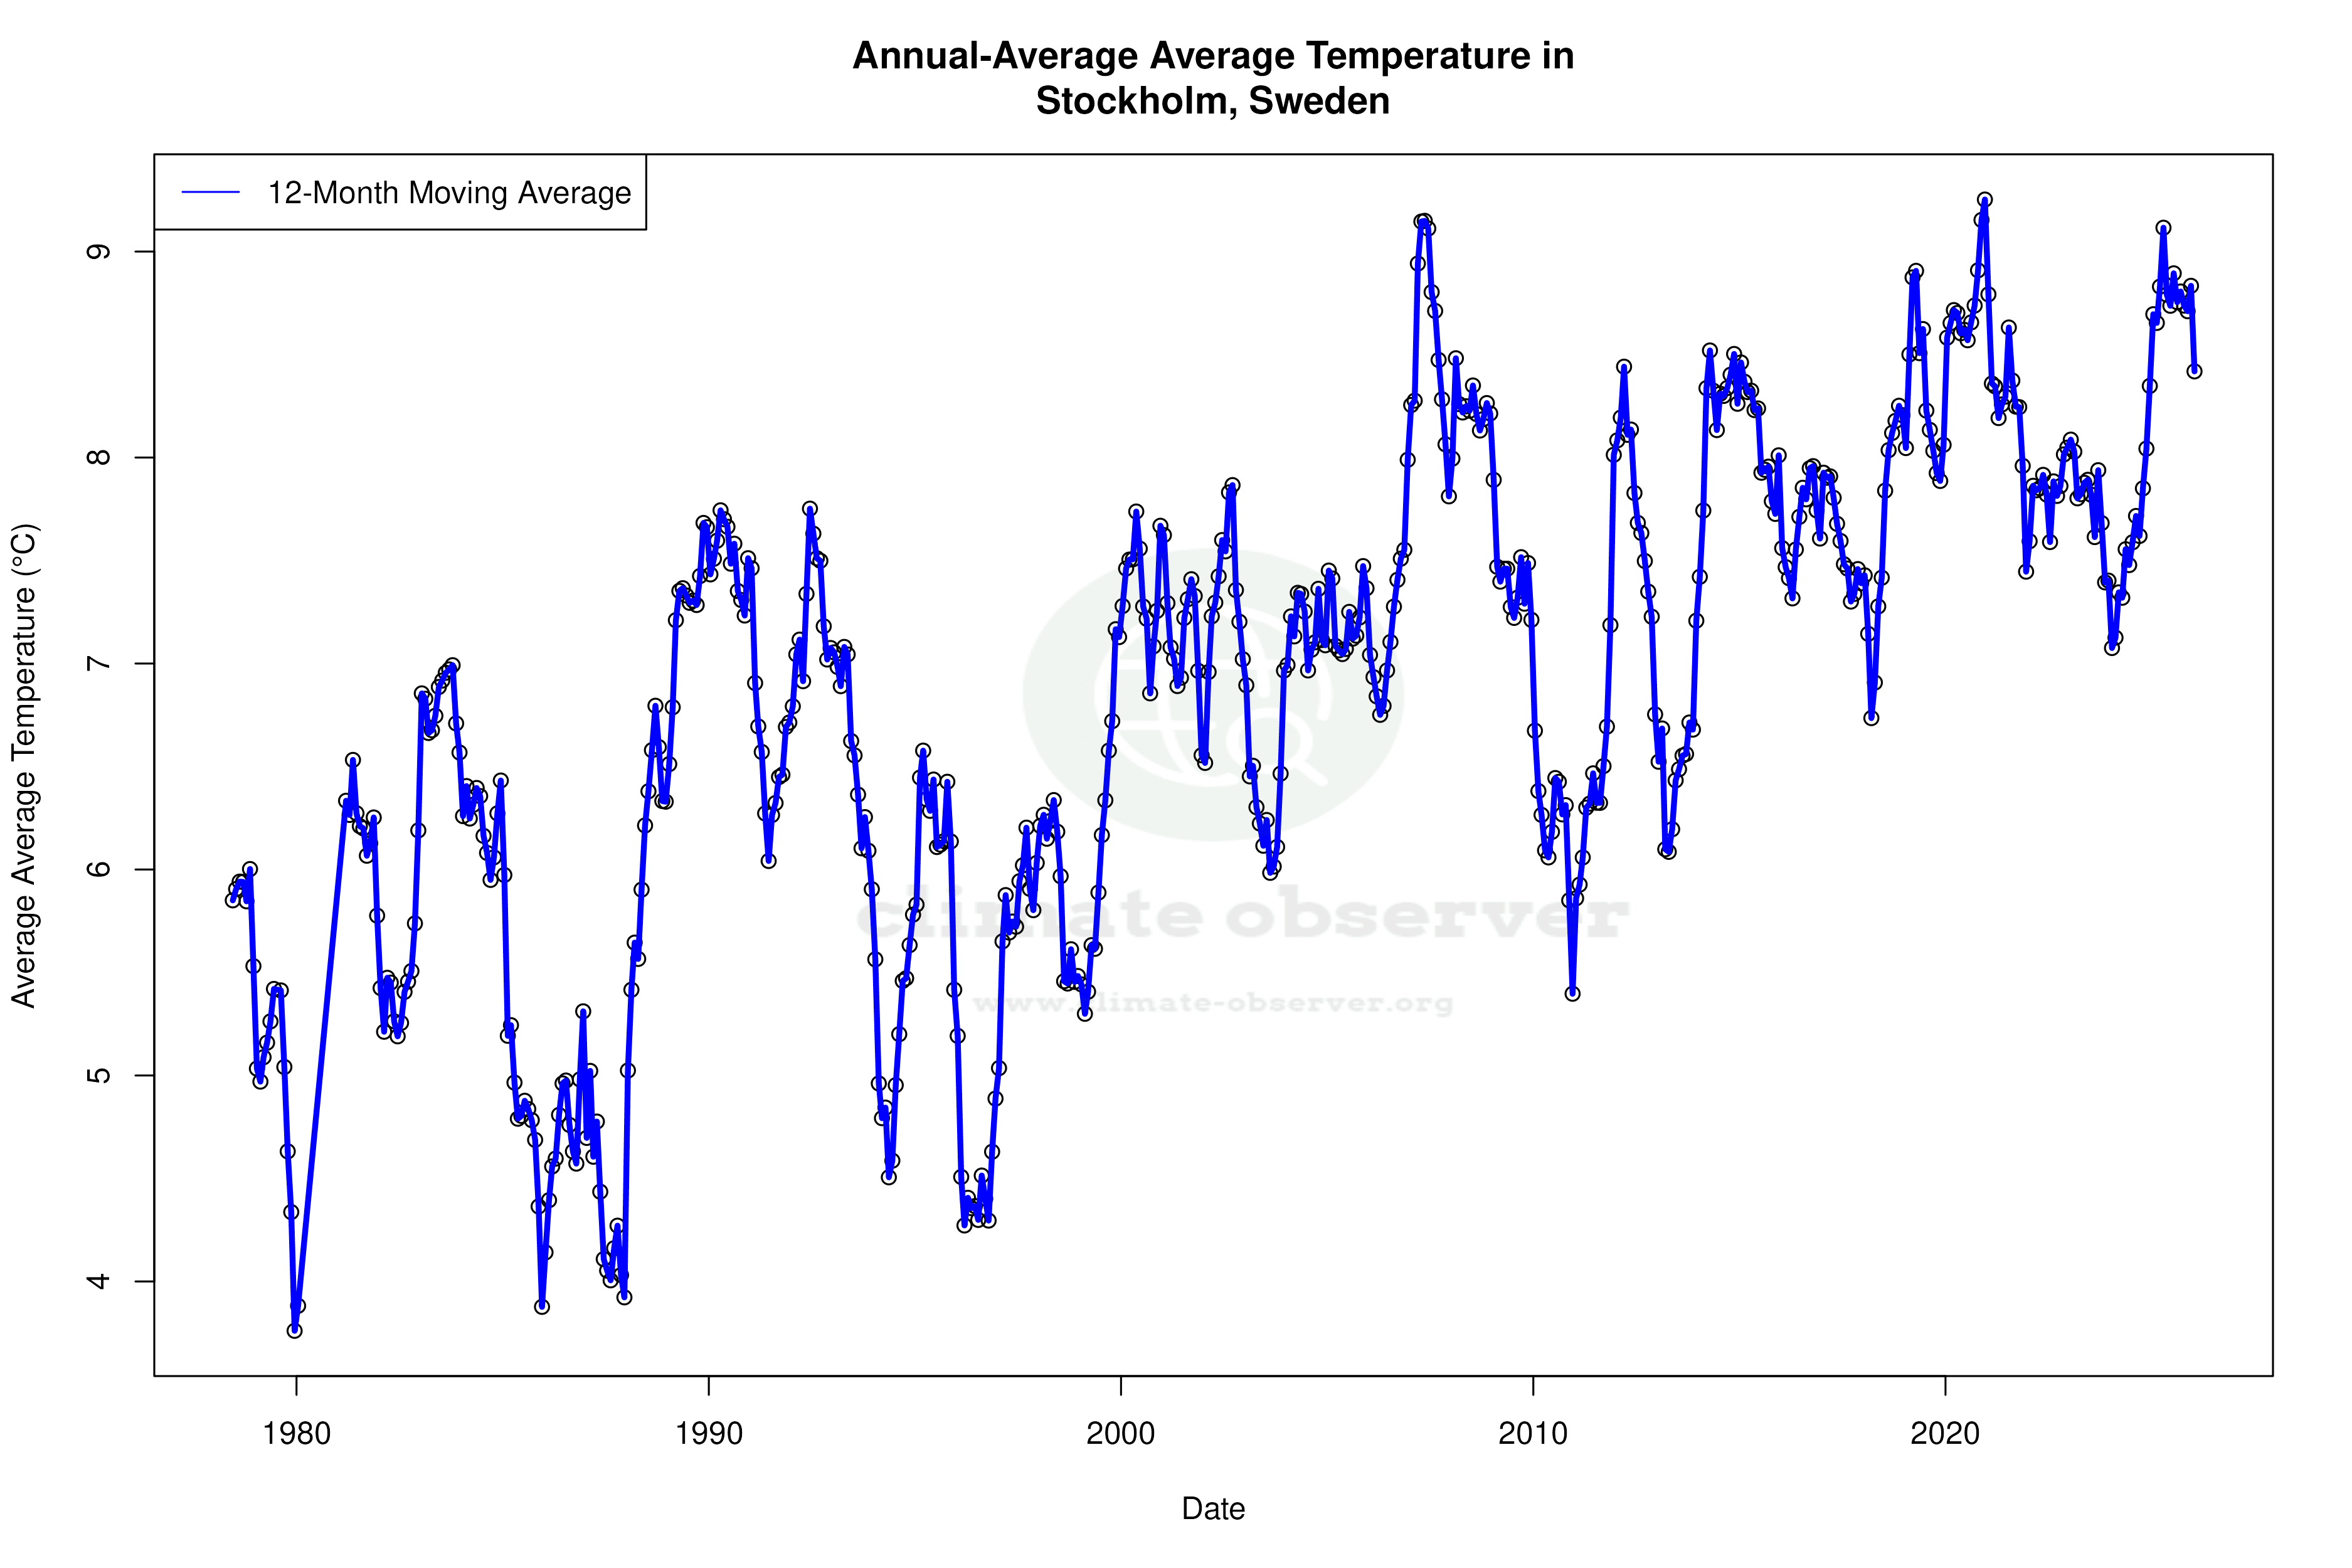


Max Temperature 12-Month MA | 1 of 6
Daily Data Points and Averages Throughout the Year


Average Max Temperature Throughout Year | 1 of 5
