Climate for Station: Kamishli, Al-Hasakah Governorate, Syria
Loading live weather...
Climate Analysis & Overview
Kamishli, located in northeastern Syria, is experiencing a complex climate narrative marked by a 0.36°C (0.65°F) all-time warming in high temperatures, contrasted by a marginal cooling in lows. Over the past decade, the city has seen a sharper decline in temperatures, especially in lows, with a 1.89°C (3.40°F) drop, indicating significant shifts in its temperature dynamics.
Climate Classification and Geographic Influence
Kamishli is classified under the Köppen climate system as having a semi-arid climate. This classification is characterised by hot summers and cool, wet winters. The city's geographical location in the northeastern part of Syria, away from coastal influences and nestled in a relatively flat region, contributes to its distinct temperature patterns. The absence of significant topographical barriers like mountains or large water bodies means that Kamishli's climate is largely influenced by continental air masses, leading to pronounced temperature variations.
Temperature Trends: A Tale of Two Metrics
The all-time temperature trends for Kamishli reveal a nuanced story. While high temperatures have shown a warming trend of 0.36°C (0.65°F), the lows have experienced a slight cooling of 0.02°C (0.04°F). This suggests that while the city is getting warmer during the day, the nights have not followed the same trajectory. This divergence could be attributed to regional atmospheric changes or shifts in land use patterns affecting nighttime cooling.
In contrast, the past decade has seen a more pronounced cooling in both high and low temperatures. Highs have decreased by 0.45°C (0.81°F), and lows have plummeted by 1.89°C (3.40°F). This recent cooling trend, especially in the lows, might indicate short-term climatic variability or changes in local environmental conditions.
Precipitation Patterns: A Subtle Shift
The Precipitation Concentration Index (PCI) for Kamishli has seen a marginal increase from a baseline of 18.61 to 19.56. The PCI measures how precipitation is distributed throughout the year, with higher values indicating more concentrated rainfall events. This slight increase suggests that rainfall in Kamishli is becoming marginally more concentrated, potentially leading to more intense but less frequent rain events. While not yet at a level of high concentration, this trend could impact water resource management and agricultural practices in the region.
Regional Implications and Future Outlook
Syria's ongoing efforts to adapt to climate change are critical, especially in light of these observed trends in Kamishli. The city's cooling lows and warming highs, coupled with changing precipitation patterns, present both challenges and opportunities for local adaptation strategies. Understanding these trends is vital for planning sustainable agricultural practices and ensuring water security in a region already vulnerable to climatic extremes.
Station Statistics
10-Year Trend
High: +0.06 °C/decade
Low: -1.52 °C/decade
Rain: +0.19 mm/decade
25-Year Trend
High: +0.70 °C/decade
Low: -0.24 °C/decade
Rain: +0.10 mm/decade
50-Year Trend
High: +0.44 °C/decade
Low: -0.19 °C/decade
Rain: -0.06 mm/decade
All-Time Trend
High: +0.29 °C/decade
Low: -0.08 °C/decade
Rain: -0.08 mm/decade
Percentage Above-Average Days
Last 12 Months: 51.2%
This Year: 22.5%
Precipitation Concentration Index (PCI) ℹ️
Last 12 Months: 18.3
Historical Average: 19.8
Percentile Rank of Last 12 Months ℹ️
High: 53rd percentile
Low: 18th percentile
Rain: 36th percentile
Change in Variance ℹ️
High: +2.6%
Low: +3.4%
Intraday: +41.4%
Data Coverage
90.9%
First Year of Data
1962
Station Location
Historical Weather Records
| Max High | Avg High | Min High | Max Avg | Avg Avg | Min Avg | Max Low | Avg Low | Min Low | Max Precipitation | Avg Precipitation | Max Snow | Avg Snow | |
|---|---|---|---|---|---|---|---|---|---|---|---|---|---|
| Record | 48.5 °C | — | -1.6 °C | 43.0 °C | — | -3.9 °C | 34.0 °C | — | -13.0 °C | 88.0 mm | — | — | — |
| January | 23.6 °C | 11.0 °C | 0.8 °C | 15.2 °C | 6.5 °C | -3.6 °C | 11.0 °C | 1.9 °C | -13.0 °C | 63.0 mm | 2.0 mm | — | — |
| February | 24.2 °C | 13.0 °C | -1.6 °C | 19.4 °C | 8.2 °C | -3.9 °C | 13.8 °C | 3.0 °C | -10.6 °C | 50.3 mm | 2.1 mm | — | — |
| March | 32.0 °C | 17.3 °C | 3.0 °C | 24.1 °C | 12.1 °C | -1.7 °C | 17.8 °C | 6.0 °C | -6.7 °C | 55.0 mm | 1.9 mm | — | — |
| April | 38.2 °C | 23.0 °C | 7.3 °C | 31.1 °C | 17.2 °C | 3.4 °C | 22.8 °C | 10.2 °C | -2.9 °C | 50.0 mm | 1.6 mm | — | — |
| May | 42.2 °C | 30.0 °C | 16.4 °C | 36.9 °C | 23.6 °C | 12.0 °C | 27.2 °C | 15.0 °C | 3.1 °C | 88.0 mm | 0.7 mm | — | — |
| June | 46.0 °C | 36.7 °C | 25.5 °C | 39.4 °C | 30.1 °C | 19.4 °C | 30.0 °C | 20.2 °C | 10.0 °C | 6.4 mm | 0.0 mm | — | — |
| July | 48.5 °C | 40.7 °C | 30.0 °C | 43.0 °C | 33.7 °C | 24.2 °C | 34.0 °C | 23.6 °C | 9.0 °C | 2.2 mm | 0.0 mm | — | — |
| August | 47.3 °C | 40.2 °C | 30.0 °C | 42.4 °C | 33.1 °C | 23.4 °C | 32.0 °C | 23.1 °C | 10.0 °C | 1.6 mm | 0.0 mm | — | — |
| September | 48.0 °C | 35.6 °C | 24.0 °C | 41.4 °C | 28.7 °C | 18.9 °C | 31.6 °C | 19.4 °C | 5.8 °C | 12.8 mm | 0.0 mm | — | — |
| October | 39.1 °C | 28.3 °C | 13.3 °C | 32.2 °C | 22.1 °C | 7.0 °C | 27.8 °C | 14.7 °C | 0.0 °C | 31.0 mm | 0.6 mm | — | — |
| November | 29.8 °C | 19.6 °C | 3.0 °C | 25.1 °C | 14.1 °C | -0.7 °C | 19.6 °C | 8.2 °C | -3.8 °C | 45.1 mm | 1.2 mm | — | — |
| December | 27.8 °C | 13.1 °C | 0.5 °C | 20.3 °C | 8.5 °C | -3.6 °C | 13.8 °C | 3.8 °C | -9.8 °C | 52.1 mm | 1.9 mm | — | — |
Data Visualisations
Remove WatermarksCurrent Year Climate Trends vs Historical


Max Temperature this Year | 1 of 6
Climate 12-Month Moving Averages


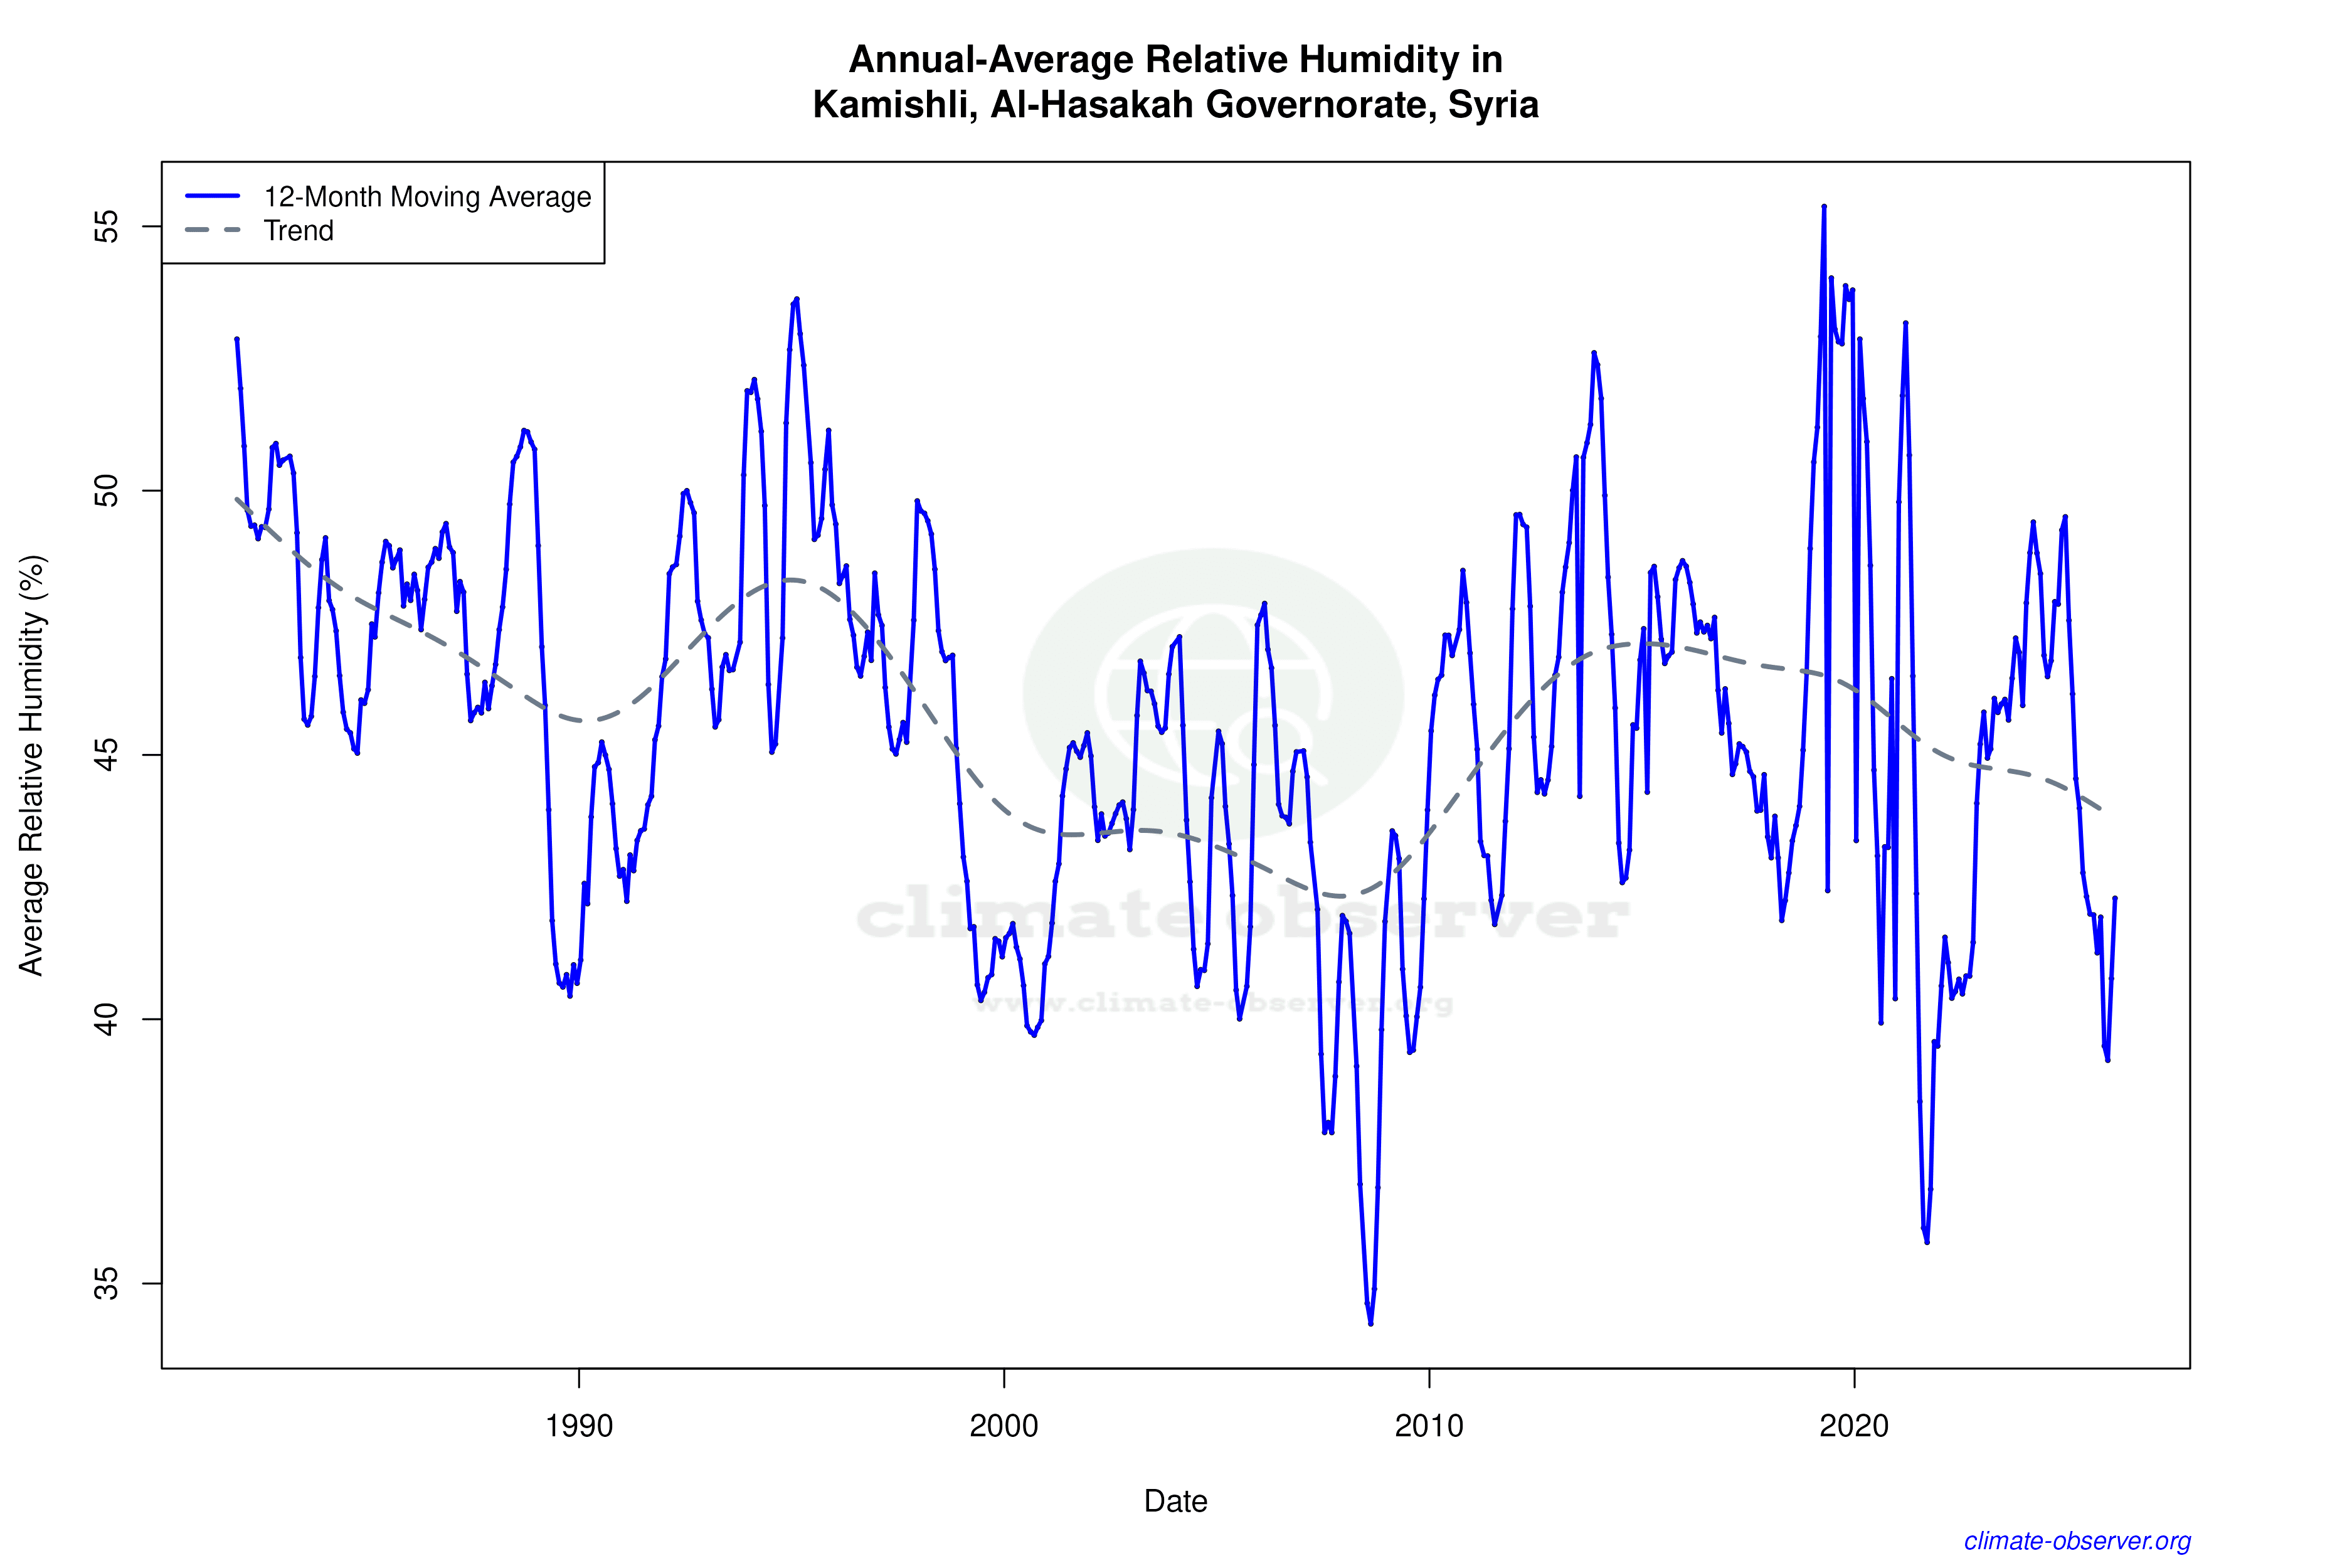

Max Temperature 12-Month MA | 1 of 6
Daily Data Points and Averages Throughout the Year


Average Max Temperature Throughout Year | 1 of 5
