Climate for Station: Lattakia, Latakia Governorate, Syria
Loading live weather...
Climate Analysis & Overview
Lattakia, located on Syria's Mediterranean coast, is experiencing a warming trend, with all-time high temperatures rising by 0.37°C (0.67°F). The precipitation pattern is becoming slightly more concentrated, indicating fewer but more intense rainfall events. This climate profile highlights the subtle yet impactful shifts in Lattakia's weather patterns amidst Syria's broader climate goals.
Mediterranean Climate Dynamics
Lattakia is characterised by a Mediterranean climate (Csa) with hot, dry summers and mild, wet winters. The city's coastal position along the Mediterranean Sea moderates temperature extremes, while the nearby coastal mountains influence precipitation patterns. Over the past decade, Lattakia's high temperatures have increased by 0.19°C (0.34°F), suggesting a warming trend that aligns with global climate patterns. However, the lows have decreased slightly by 0.09°C (0.16°F), indicating a complex interplay of local and regional atmospheric conditions.
Warming Trends and Temperature Extremes
The all-time temperature trends in Lattakia reveal a warming pattern, with high temperatures rising by 0.37°C (0.67°F). This suggests an overall increase in heat, which could affect local ecosystems and human activities. The record high temperature stands at 39.3°C (102.7°F), illustrating the potential for extreme heat events in the region. Conversely, the all-time low temperatures have risen by 0.18°C (0.32°F), indicating milder winters. The record low remains at -3.0°C (26.6°F), a testament to the region's generally mild winters.
Precipitation Patterns and Concentration
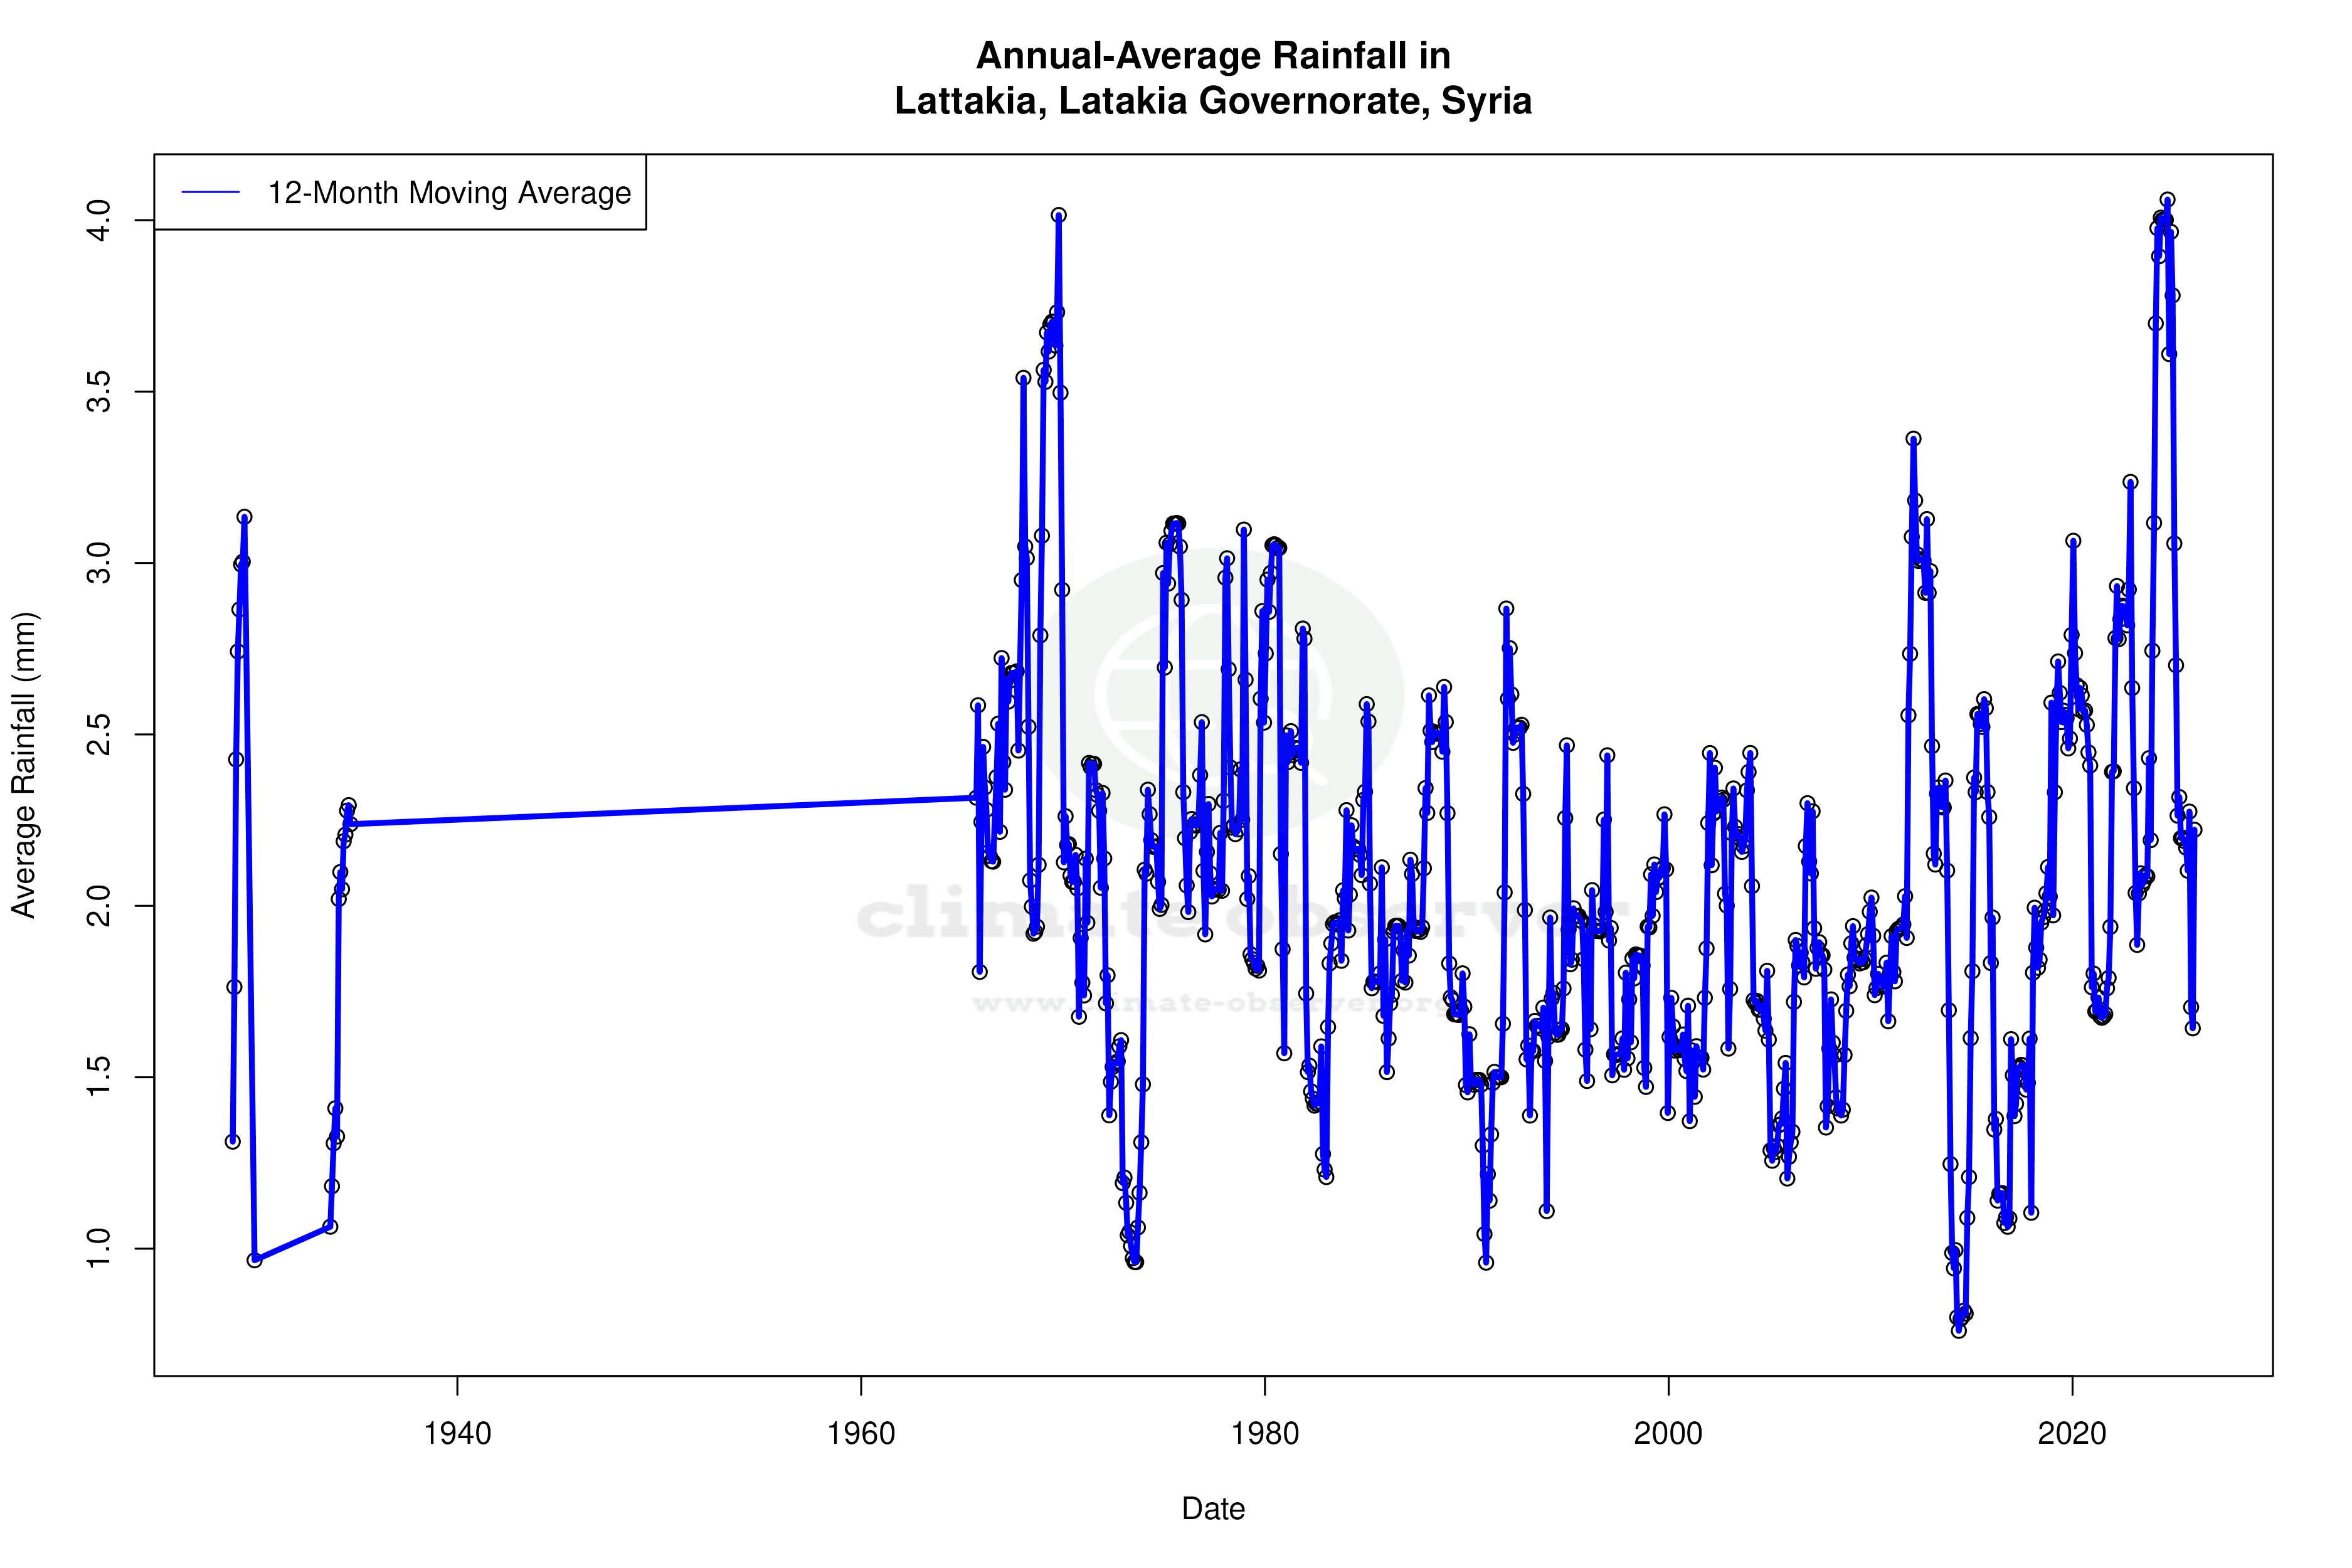
The Precipitation Concentration Index (PCI) for Lattakia has increased from a baseline of 17.67 to a current value of 19.00. This slight rise suggests that rainfall is becoming more concentrated in fewer events, leading to potential challenges such as flash flooding and water management issues. While the PCI is not yet at a level considered highly concentrated, this trend warrants attention as climate change continues to influence regional weather patterns.
Regional Climate Considerations
Syria's regional climate goals focus on adapting to and mitigating the impacts of climate change, with particular emphasis on water resource management and agricultural resilience. Lattakia's warming trends and changing precipitation patterns are critical factors in these efforts. Recent weather events, such as unseasonal storms or prolonged heatwaves, highlight the importance of monitoring and responding to these climatic shifts. As Lattakia continues to navigate these changes, understanding the local climate dynamics will be essential for sustainable development and environmental stewardship.
Station Statistics
10-Year Trend
High: +0.11 °C/decade
Low: -0.60 °C/decade
Rain: +1.23 mm/decade
25-Year Trend
High: +0.98 °C/decade
Low: -0.86 °C/decade
Rain: +0.35 mm/decade
50-Year Trend
High: +0.49 °C/decade
Low: +0.25 °C/decade
Rain: +0.05 mm/decade
All-Time Trend
High: +0.38 °C/decade
Low: +0.23 °C/decade
Rain: -0.02 mm/decade
Percentage Above-Average Days
Last 12 Months: 46.6%
This Year: 20.4%
Precipitation Concentration Index (PCI) ℹ️
Last 12 Months: 18.6
Historical Average: 18.8
Percentile Rank of Last 12 Months ℹ️
High: 61st percentile
Low: 63rd percentile
Rain: 83rd percentile
Change in Variance ℹ️
High: +12.6%
Low: +0.1%
Intraday: +14.1%
Data Coverage
64.7%
First Year of Data
1933
Station Location
Historical Weather Records
| Max High | Avg High | Min High | Max Avg | Avg Avg | Min Avg | Max Low | Avg Low | Min Low | Max Precipitation | Avg Precipitation | Max Snow | Avg Snow | |
|---|---|---|---|---|---|---|---|---|---|---|---|---|---|
| Record | 39.3 °C | — | 4.9 °C | 32.7 °C | — | 3.2 °C | 29.0 °C | — | -3.0 °C | 150.0 mm | — | — | — |
| January | 25.0 °C | 15.9 °C | 5.0 °C | 19.4 °C | 12.1 °C | 3.2 °C | 17.7 °C | 9.0 °C | -2.0 °C | 132.3 mm | 4.9 mm | — | — |
| February | 28.2 °C | 16.7 °C | 4.9 °C | 20.5 °C | 13.0 °C | 3.8 °C | 17.5 °C | 9.4 °C | -2.0 °C | 114.0 mm | 4.1 mm | — | — |
| March | 32.6 °C | 18.7 °C | 9.6 °C | 25.1 °C | 15.1 °C | 4.1 °C | 21.0 °C | 11.4 °C | -0.6 °C | 78.0 mm | 2.4 mm | — | — |
| April | 35.6 °C | 21.6 °C | 11.4 °C | 29.2 °C | 18.0 °C | 8.8 °C | 24.0 °C | 14.1 °C | 0.0 °C | 64.0 mm | 1.5 mm | — | — |
| May | 39.0 °C | 24.5 °C | 16.1 °C | 30.8 °C | 21.1 °C | 14.1 °C | 25.2 °C | 17.4 °C | 10.0 °C | 62.0 mm | 0.7 mm | — | — |
| June | 37.0 °C | 27.2 °C | 21.1 °C | 32.7 °C | 24.4 °C | 19.2 °C | 26.5 °C | 21.1 °C | 11.0 °C | 45.4 mm | 0.2 mm | — | — |
| July | 39.0 °C | 29.4 °C | 25.0 °C | 30.8 °C | 27.0 °C | 23.1 °C | 29.0 °C | 24.1 °C | 15.8 °C | 25.0 mm | 0.1 mm | — | — |
| August | 39.0 °C | 30.3 °C | 26.4 °C | 31.5 °C | 27.7 °C | 23.8 °C | 28.6 °C | 24.7 °C | 17.2 °C | 29.2 mm | 0.1 mm | — | — |
| September | 38.5 °C | 29.4 °C | 23.5 °C | 32.7 °C | 26.1 °C | 20.8 °C | 28.0 °C | 22.6 °C | 12.4 °C | 45.7 mm | 0.4 mm | — | — |
| October | 39.3 °C | 27.1 °C | 18.2 °C | 32.4 °C | 22.8 °C | 13.6 °C | 28.2 °C | 18.8 °C | 8.9 °C | 128.0 mm | 1.9 mm | — | — |
| November | 34.0 °C | 22.5 °C | 10.3 °C | 27.1 °C | 17.9 °C | 7.0 °C | 22.9 °C | 14.3 °C | -1.1 °C | 102.0 mm | 3.3 mm | — | — |
| December | 28.0 °C | 17.8 °C | 6.0 °C | 19.9 °C | 13.7 °C | 3.2 °C | 19.0 °C | 10.6 °C | -3.0 °C | 150.0 mm | 5.0 mm | — | — |
Data Visualisations
Remove WatermarksCurrent Year Climate Trends vs Historical


Max Temperature this Year | 1 of 6
Climate 12-Month Moving Averages


Max Temperature 12-Month MA | 1 of 6
Daily Data Points and Averages Throughout the Year


Average Max Temperature Throughout Year | 1 of 5
