Climate for Station: Hama, Hama Governorate, Syria
Loading live weather...
Climate Analysis & Overview
The climate profile for Hama, Syria, reveals a complex interplay of cooling and warming trends. Over the past decade, the region has experienced a notable cooling in high temperatures, while long-term data indicates a slight warming trend. Precipitation patterns have become more evenly distributed, reflecting a shift towards less concentrated rainfall events.
Climate Classification and Geographic Influence
Hama, located at 35.117°N, 36.75°E, falls under the BSk category in the Köppen climate classification, indicating a cold semi-arid climate. This classification is influenced by its proximity to the Orontes River and surrounding semi-arid plains. The geographical features contribute to the region's temperature and precipitation patterns, which are characterised by hot, dry summers and mild, wetter winters.
Temperature Trends: A Decade of Cooling
Over the past ten years, Hama has experienced a cooling trend in high temperatures, with a decrease of 2.32°C (4.18°F). This contrasts with the long-term data, which shows a slight warming trend in high temperatures of 0.19°C (0.34°F). Low temperatures over the last decade have also cooled by 0.61°C (1.10°F), while the all-time trend indicates a warming of 0.64°C (1.15°F). These contrasting trends highlight the dynamic nature of Hama's climate, where short-term cooling may be influenced by localised factors, while long-term data suggests a gradual warming.
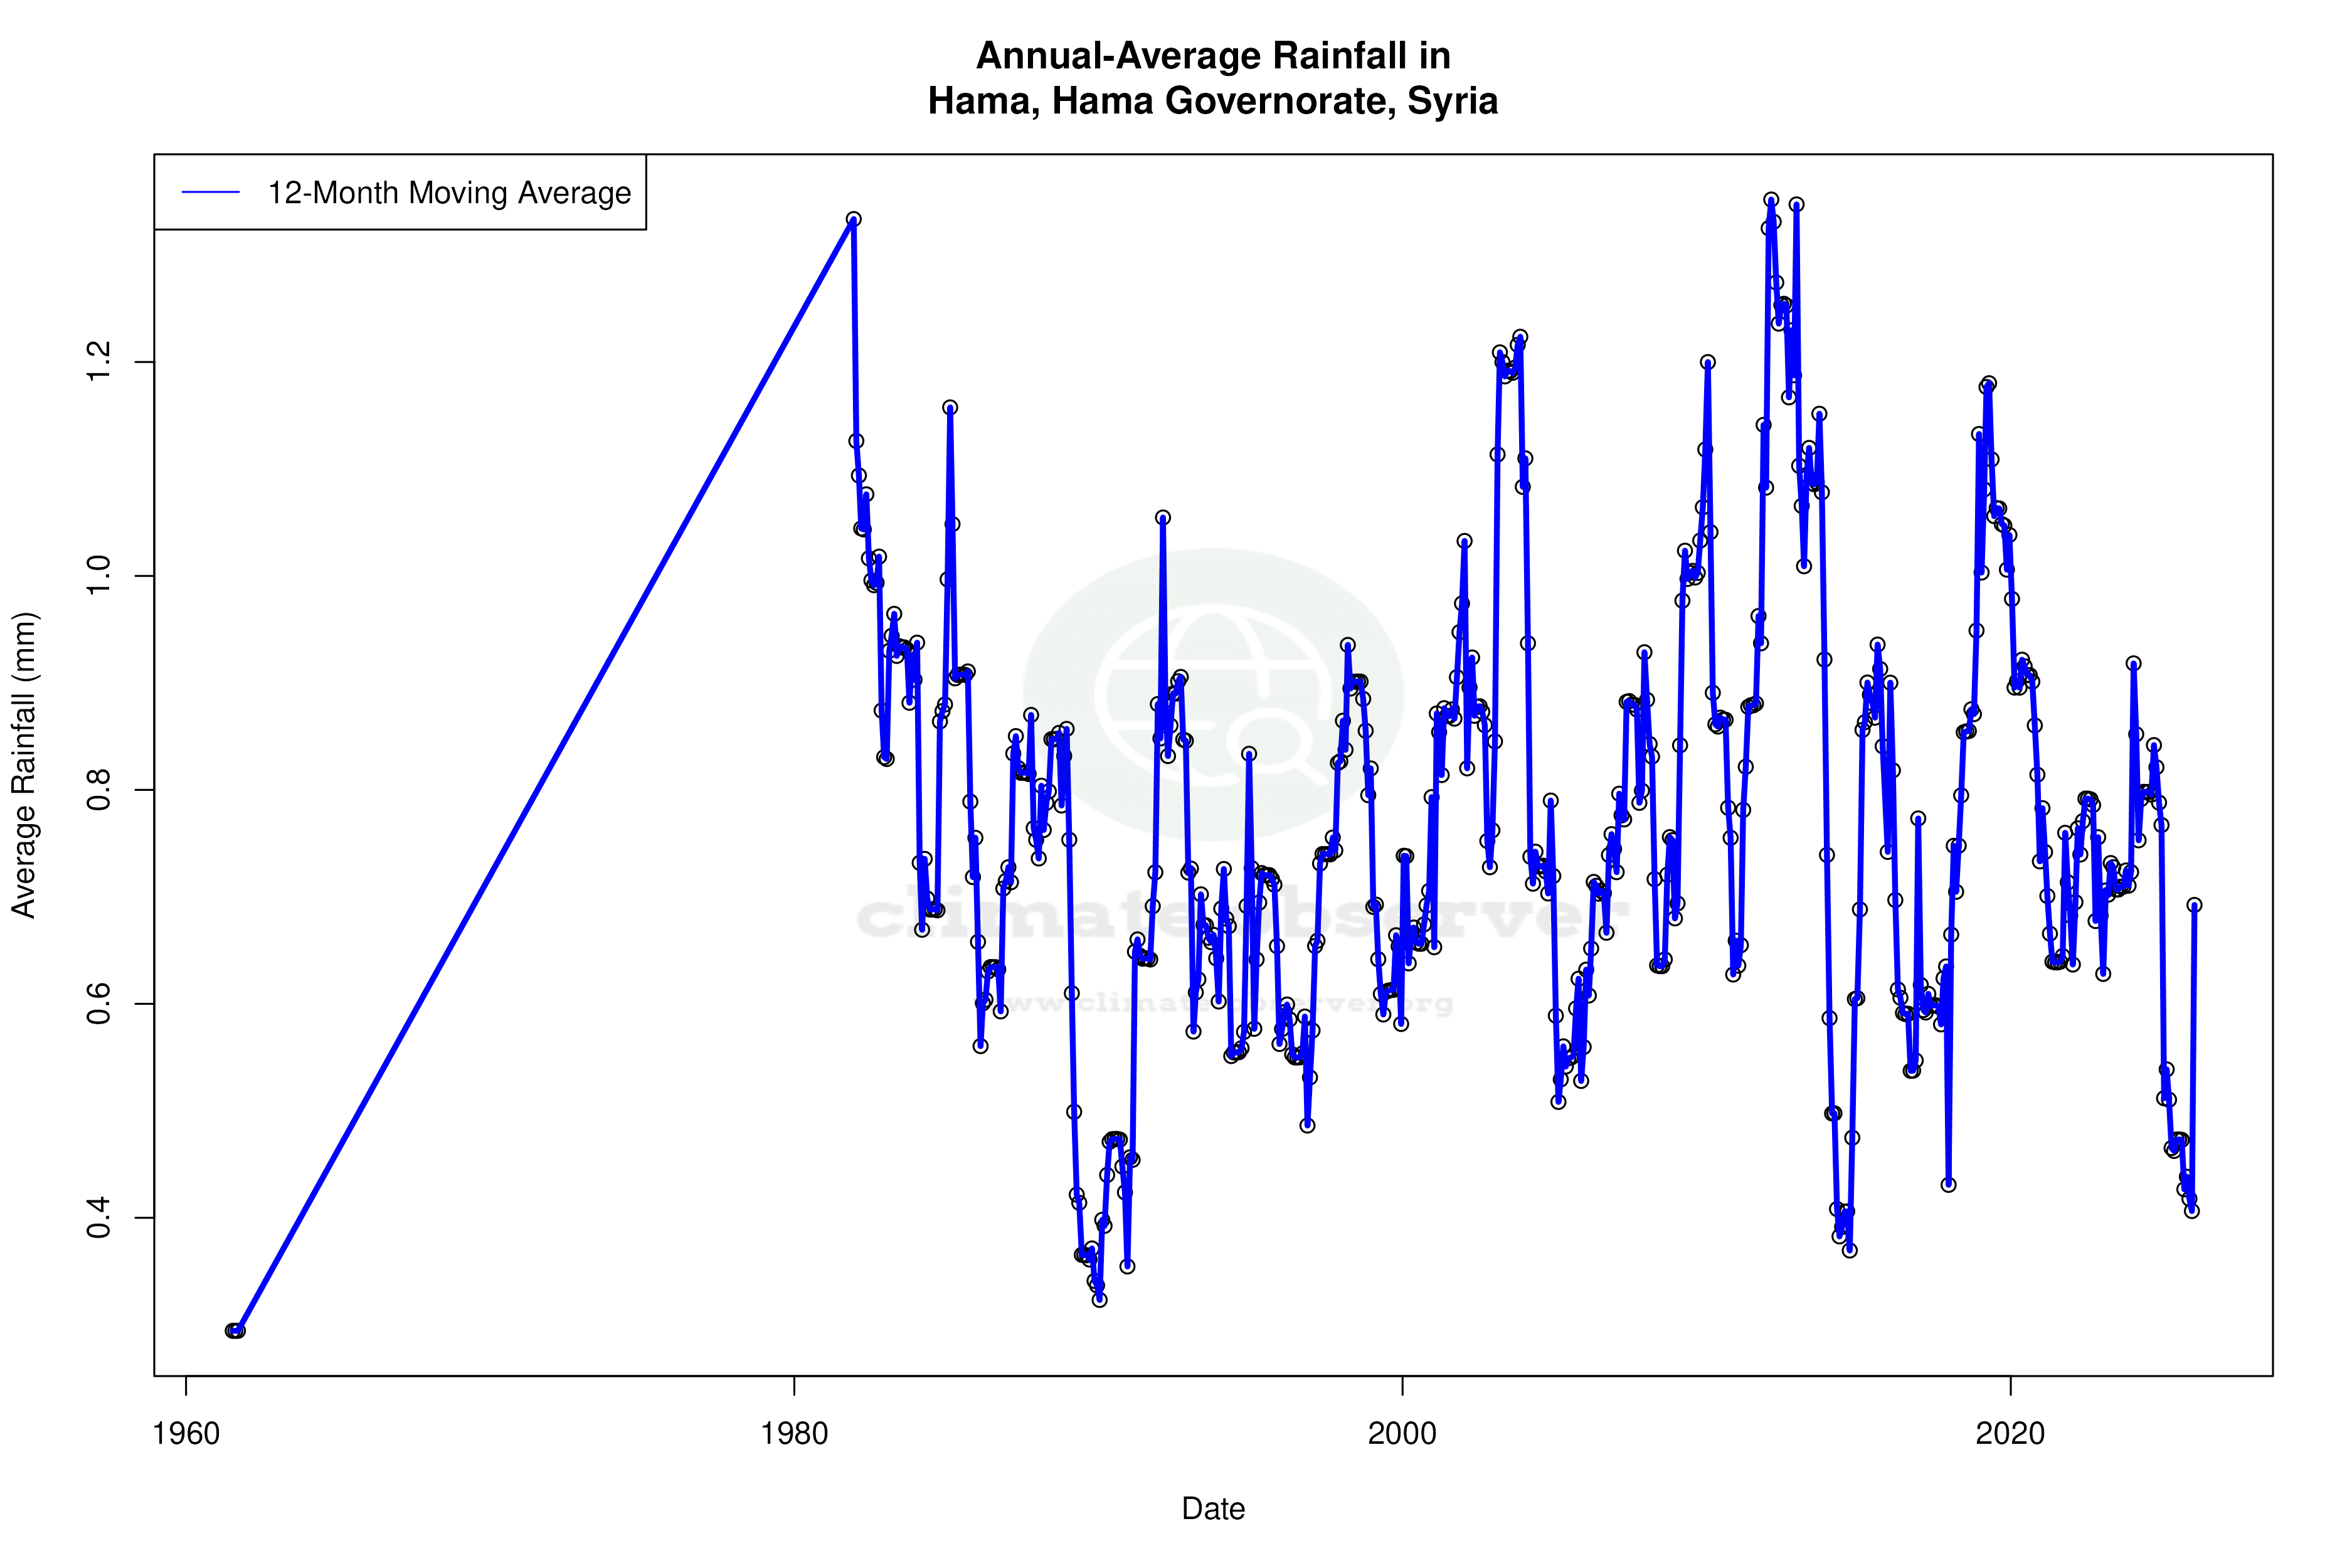
Precipitation Patterns: A Shift Towards Even Distribution
The Precipitation Concentration Index (PCI) for Hama has decreased from a baseline of 18.50 to a current value of 14.49. This change indicates a shift towards more evenly distributed precipitation throughout the year, as a lower PCI suggests less concentration of rainfall in fewer events. Such a trend can be beneficial for agriculture, reducing the risk of flooding and drought associated with highly concentrated rainfall.
Temperature Extremes: Record Highs and Lows
Hama's climate is marked by significant temperature extremes, with an all-time record high of 46.6°C (115.9°F) and a record low of -9.2°C (15.4°F). These extremes are characteristic of the region's semi-arid climate, where temperature fluctuations can be pronounced due to the lack of moderating influences such as large bodies of water.
Regional Climate Context and Future Considerations
Hama's climate trends are set against the backdrop of Syria's broader climate goals, which include adapting to changing precipitation patterns and addressing temperature variability. Recent weather events, such as prolonged droughts and intense heatwaves, underscore the importance of understanding these trends for future planning and resilience-building efforts.
Station Statistics
10-Year Trend
High: -2.51 °C/decade
Low: -0.70 °C/decade
Rain: -0.03 mm/decade
25-Year Trend
High: -0.27 °C/decade
Low: +0.07 °C/decade
Rain: -0.04 mm/decade
50-Year Trend
High: +0.19 °C/decade
Low: +0.72 °C/decade
Rain: +0.01 mm/decade
All-Time Trend
High: +0.19 °C/decade
Low: +0.70 °C/decade
Rain: +0.01 mm/decade
Percentage Above-Average Days
Last 12 Months: 46.8%
This Year: 40.0%
Precipitation Concentration Index (PCI) ℹ️
Last 12 Months: 22.0
Historical Average: 19.2
Percentile Rank of Last 12 Months ℹ️
High: 13th percentile
Low: 46th percentile
Rain: 13th percentile
Change in Variance ℹ️
High: -0.5%
Low: -6.9%
Intraday: -8.2%
Data Coverage
77.1%
First Year of Data
1971
Station Location
Historical Weather Records
| Max High | Avg High | Min High | Max Avg | Avg Avg | Min Avg | Max Low | Avg Low | Min Low | Max Precipitation | Avg Precipitation | Max Snow | Avg Snow | |
|---|---|---|---|---|---|---|---|---|---|---|---|---|---|
| Record | 46.6 °C | — | -1.2 °C | 38.7 °C | — | -2.8 °C | 28.3 °C | — | -9.2 °C | 51.6 mm | — | — | — |
| January | 25.5 °C | 12.4 °C | 1.0 °C | 17.3 °C | 7.2 °C | -2.8 °C | 14.5 °C | 2.9 °C | -8.5 °C | 32.5 mm | 1.9 mm | — | — |
| February | 26.8 °C | 14.6 °C | -1.2 °C | 18.4 °C | 8.9 °C | -1.8 °C | 12.2 °C | 3.6 °C | -9.2 °C | 24.9 mm | 1.5 mm | — | — |
| March | 34.5 °C | 18.7 °C | 5.6 °C | 24.9 °C | 12.3 °C | -2.3 °C | 17.0 °C | 6.1 °C | -7.8 °C | 38.5 mm | 1.3 mm | — | — |
| April | 39.4 °C | 23.9 °C | 8.6 °C | 30.0 °C | 16.8 °C | 3.7 °C | 20.0 °C | 9.7 °C | -2.0 °C | 20.1 mm | 0.7 mm | — | — |
| May | 42.2 °C | 29.6 °C | 16.2 °C | 37.8 °C | 21.9 °C | 11.9 °C | 25.0 °C | 13.9 °C | 4.0 °C | 29.5 mm | 0.4 mm | — | — |
| June | 46.6 °C | 34.0 °C | 23.0 °C | 36.5 °C | 26.4 °C | 16.8 °C | 27.1 °C | 18.1 °C | 7.6 °C | 11.2 mm | 0.1 mm | — | — |
| July | 45.4 °C | 36.6 °C | 28.3 °C | 38.7 °C | 29.0 °C | 21.2 °C | 27.7 °C | 21.1 °C | 11.0 °C | 5.3 mm | 0.0 mm | — | — |
| August | 46.6 °C | 36.8 °C | 27.2 °C | 37.8 °C | 29.0 °C | 21.9 °C | 28.3 °C | 21.3 °C | 10.6 °C | 24.8 mm | 0.0 mm | — | — |
| September | 45.0 °C | 33.9 °C | 20.0 °C | 36.4 °C | 26.1 °C | 17.4 °C | 26.9 °C | 18.4 °C | 5.6 °C | 15.4 mm | 0.2 mm | — | — |
| October | 39.7 °C | 28.5 °C | 14.6 °C | 30.0 °C | 20.9 °C | 8.9 °C | 22.8 °C | 13.9 °C | 1.0 °C | 47.8 mm | 0.6 mm | — | — |
| November | 30.5 °C | 20.3 °C | 5.4 °C | 24.3 °C | 13.5 °C | 1.6 °C | 17.5 °C | 7.6 °C | -6.0 °C | 20.9 mm | 1.1 mm | — | — |
| December | 25.7 °C | 14.0 °C | 0.8 °C | 17.0 °C | 8.5 °C | -1.1 °C | 13.8 °C | 4.4 °C | -6.0 °C | 51.6 mm | 1.5 mm | — | — |
Data Visualisations
Remove WatermarksCurrent Year Climate Trends vs Historical


Max Temperature this Year | 1 of 6
Climate 12-Month Moving Averages


Max Temperature 12-Month MA | 1 of 6
Daily Data Points and Averages Throughout the Year


Average Max Temperature Throughout Year | 1 of 5
