Climate for Station: Damascus Intl, Rif Dimashq Governorate, Syria
Loading live weather...
Climate Analysis & Overview
Damascus International Airport is experiencing a warming trend, with notable increases in both high and low temperatures over the past decade. The concentration of precipitation events has also increased slightly, indicating a shift towards more intense rainfall periods. These changes are consistent with broader regional climate patterns and present challenges for Syria's climate resilience efforts.
Desert Heat Intensification
Damascus International Airport, situated at 33.412°N, 36.516°E, lies within a semi-arid climate zone, according to the Köppen classification. The surrounding geography, characterised by the proximity to the Syrian Desert and the Anti-Lebanon mountain range, influences its climate dynamics. The all-time temperature trends reveal a warming pattern, with high temperatures increasing by 0.67°C (1.21°F) and low temperatures by 0.88°C (1.58°F). Over the past decade, this warming trend is more pronounced in the lows, with an increase of 1.00°C (1.80°F), compared to the highs which rose by 0.11°C (0.20°F). This suggests that nights are warming faster than days, a common indicator of climate change impacts in arid regions.
Precipitation Patterns: A Concentrated Shift
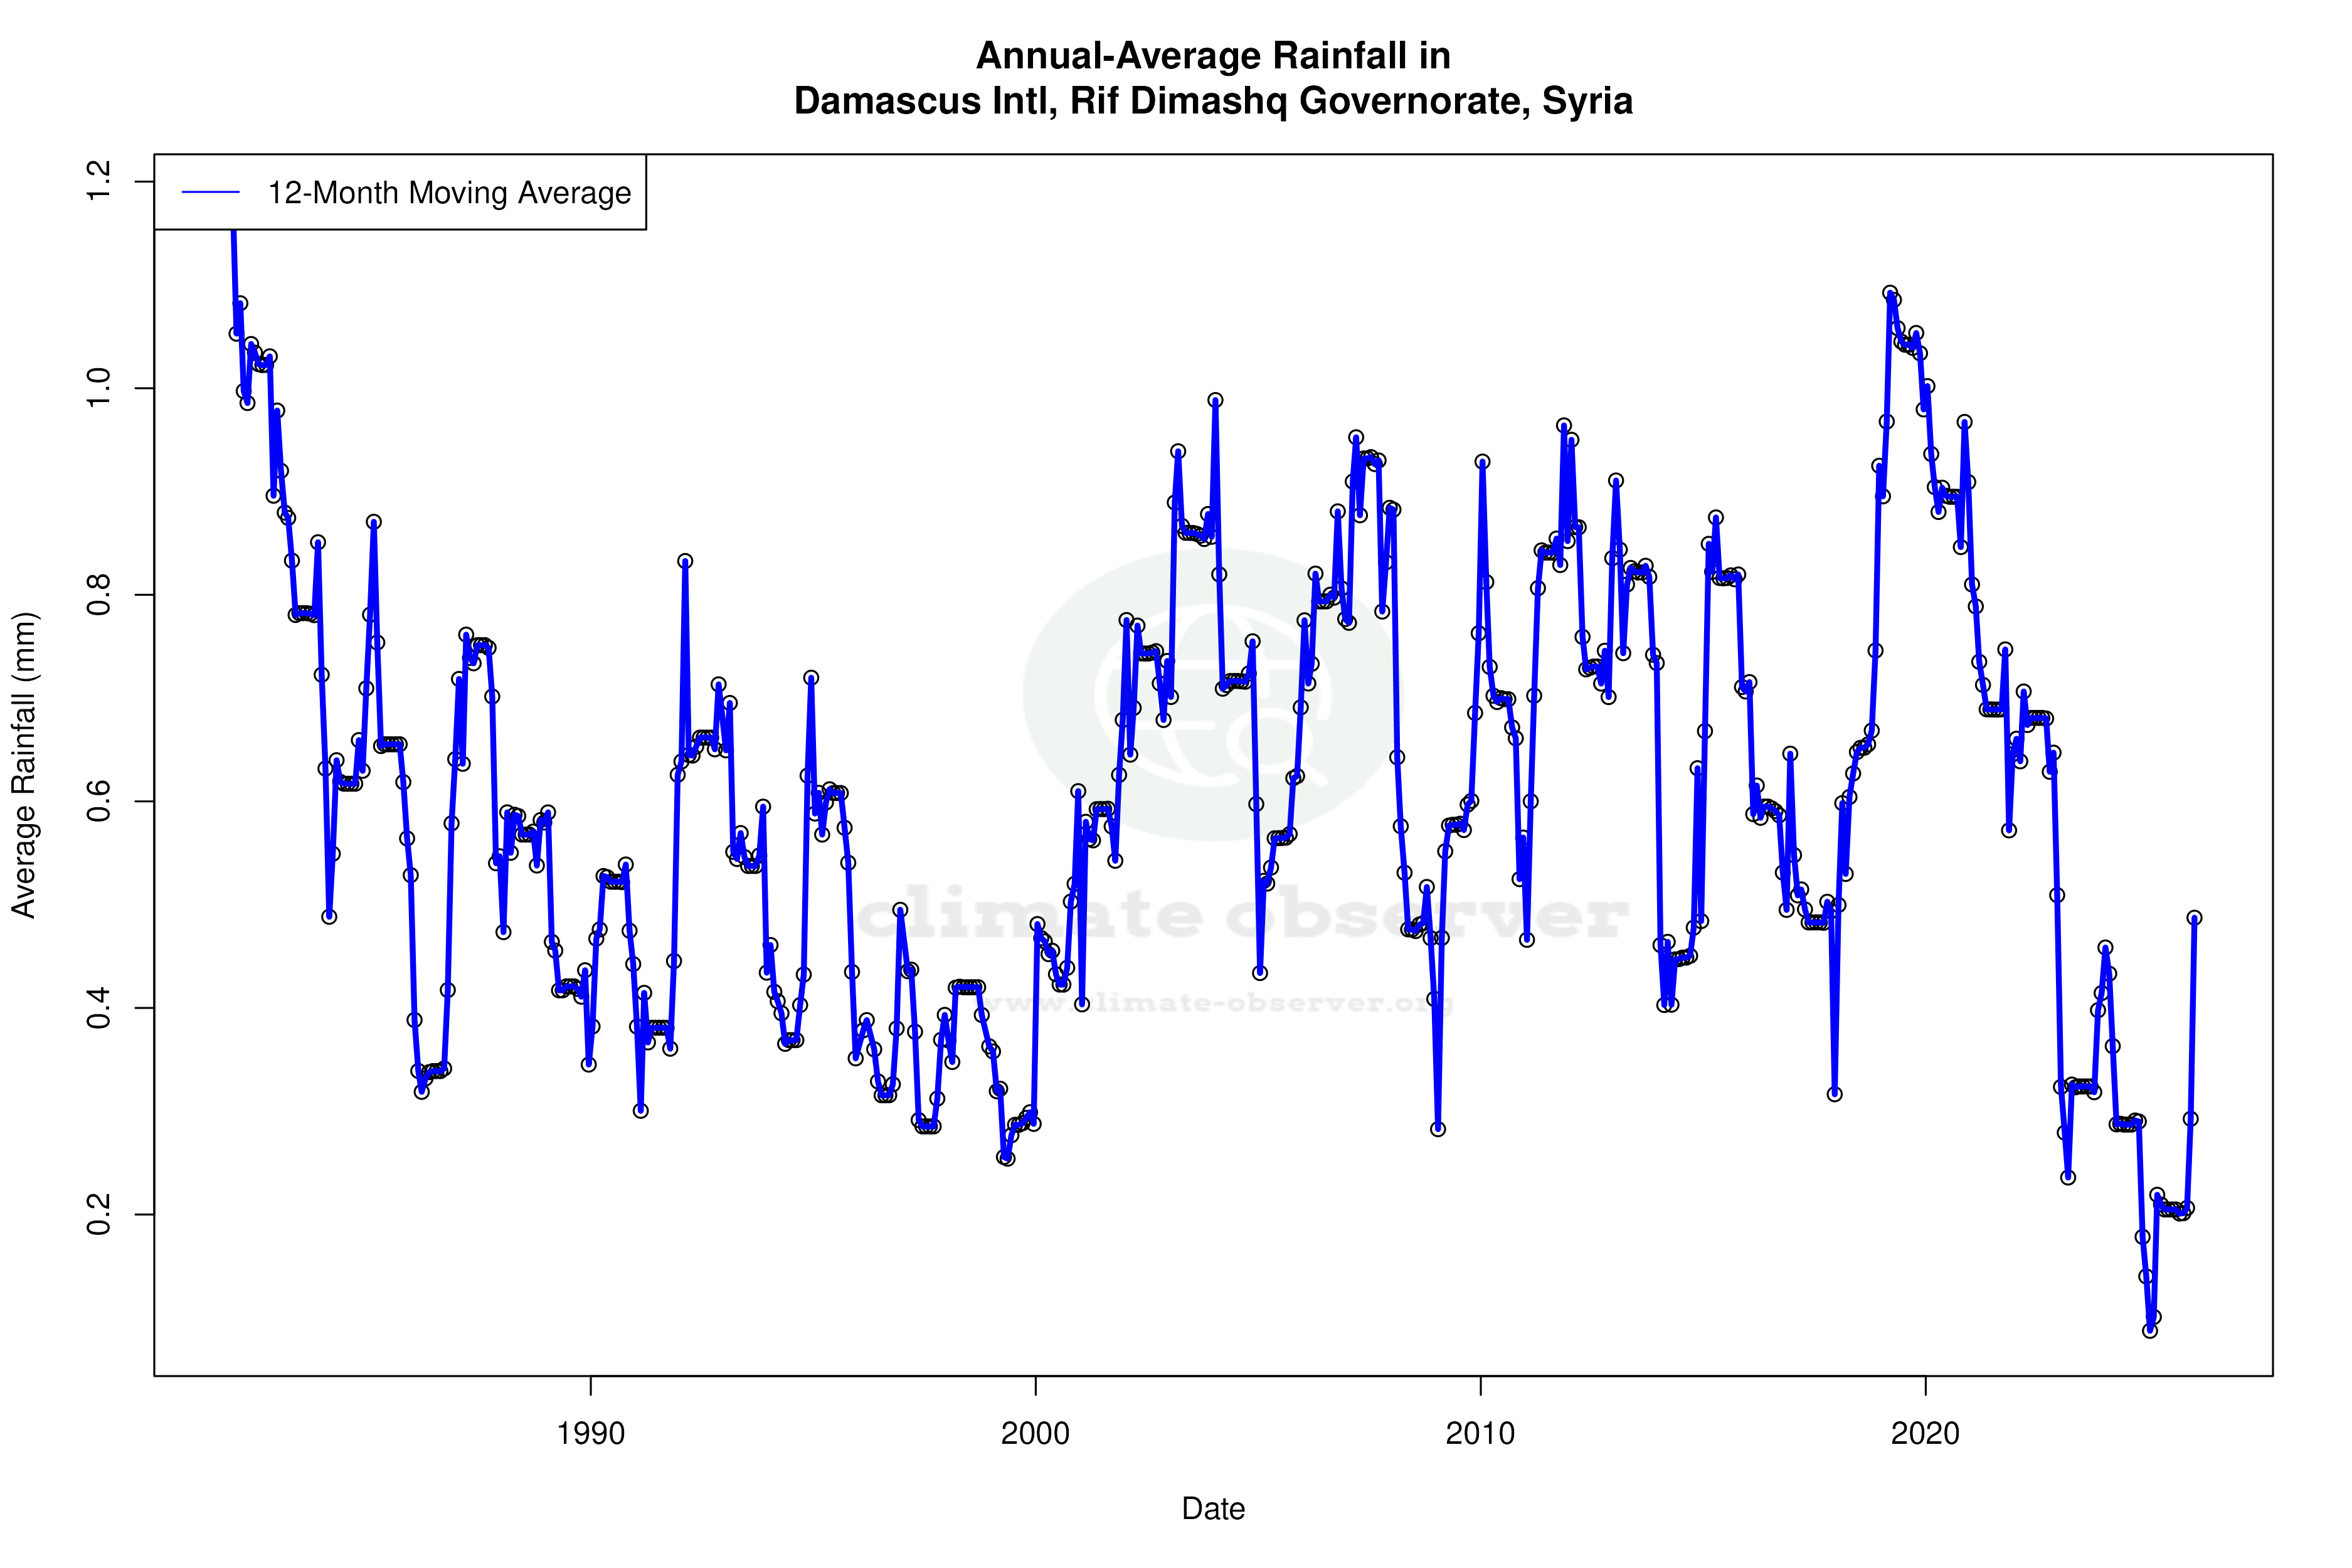
The Precipitation Concentration Index (PCI) for Damascus International Airport has shown a slight increase from a baseline of 21.57 to a current value of 22.56. The PCI measures how rainfall is distributed throughout the year, with higher values indicating more concentrated rainfall events. This slight increase suggests that precipitation is becoming more concentrated in fewer, more intense events. Such changes can exacerbate flooding risks and challenge water management strategies, particularly in a region where water scarcity is already a critical issue.
Temperature Extremes: Record Observations
The station has recorded extreme temperatures with a maximum of 46.0°C (114.8°F) and a minimum of -14.5°C (5.9°F). These extremes highlight the variability and potential for severe weather events in the region. The high temperature records are indicative of the increasing heatwaves that are becoming more frequent and intense, aligning with global climate trends.
Regional Implications and Climate Goals
Syria's regional climate goals focus on adaptation and resilience, particularly in the face of increasing temperatures and changing precipitation patterns. The observed trends at Damascus International Airport are a microcosm of broader regional changes, necessitating enhanced climate strategies. Recent weather events, such as intense heatwaves and sporadic heavy rainfall, underscore the urgency for effective climate adaptation measures. These efforts are crucial in mitigating the impacts of climate change on agriculture, water resources, and urban infrastructure in Syria.
Station Statistics
10-Year Trend
High: -0.24 °C/decade
Low: +0.52 °C/decade
Rain: -0.42 mm/decade
25-Year Trend
High: +0.53 °C/decade
Low: +0.77 °C/decade
Rain: -0.09 mm/decade
50-Year Trend
High: +0.68 °C/decade
Low: +0.90 °C/decade
Rain: -0.00 mm/decade
All-Time Trend
High: +0.69 °C/decade
Low: +0.90 °C/decade
Rain: -0.00 mm/decade
Percentage Above-Average Days
Last 12 Months: 60.0%
This Year: 67.5%
Precipitation Concentration Index (PCI) ℹ️
Last 12 Months: 29.2
Historical Average: 23.2
Percentile Rank of Last 12 Months ℹ️
High: 72nd percentile
Low: 88th percentile
Rain: 4th percentile
Change in Variance ℹ️
High: +0.1%
Low: -2.3%
Intraday: -4.1%
Data Coverage
93.9%
First Year of Data
1980
Station Location
Historical Weather Records
| Max High | Avg High | Min High | Max Avg | Avg Avg | Min Avg | Max Low | Avg Low | Min Low | Max Precipitation | Avg Precipitation | Max Snow | Avg Snow | |
|---|---|---|---|---|---|---|---|---|---|---|---|---|---|
| Record | 46.0 °C | — | -1.3 °C | 35.8 °C | — | -3.4 °C | 29.0 °C | — | -14.5 °C | 35.3 mm | — | — | — |
| January | 23.2 °C | 12.8 °C | 0.6 °C | 14.9 °C | 6.4 °C | -2.9 °C | 10.0 °C | 0.7 °C | -12.2 °C | 32.6 mm | 1.8 mm | — | — |
| February | 28.0 °C | 14.8 °C | -1.3 °C | 17.2 °C | 8.2 °C | -3.4 °C | 12.0 °C | 1.6 °C | -12.0 °C | 31.4 mm | 1.5 mm | — | — |
| March | 34.4 °C | 19.1 °C | 2.6 °C | 22.8 °C | 11.7 °C | 0.2 °C | 15.0 °C | 4.0 °C | -8.0 °C | 34.4 mm | 0.9 mm | — | — |
| April | 38.4 °C | 24.7 °C | 9.0 °C | 31.4 °C | 16.4 °C | 3.4 °C | 20.0 °C | 7.5 °C | -7.5 °C | 26.0 mm | 0.4 mm | — | — |
| May | 41.4 °C | 30.1 °C | 12.5 °C | 31.7 °C | 21.3 °C | 11.6 °C | 23.0 °C | 11.4 °C | 1.0 °C | 20.2 mm | 0.2 mm | — | — |
| June | 45.0 °C | 34.6 °C | 19.7 °C | 33.4 °C | 25.2 °C | 16.3 °C | 26.0 °C | 15.1 °C | 2.0 °C | 6.7 mm | 0.0 mm | — | — |
| July | 46.0 °C | 37.2 °C | 28.3 °C | 35.0 °C | 27.5 °C | 20.4 °C | 25.0 °C | 18.0 °C | 8.0 °C | 3.0 mm | 0.0 mm | — | — |
| August | 45.0 °C | 37.1 °C | 29.0 °C | 35.8 °C | 27.1 °C | 16.8 °C | 27.0 °C | 18.0 °C | 8.6 °C | 4.1 mm | 0.0 mm | — | — |
| September | 44.6 °C | 34.0 °C | 22.8 °C | 32.6 °C | 24.2 °C | 15.8 °C | 29.0 °C | 14.6 °C | 4.8 °C | 6.4 mm | 0.0 mm | — | — |
| October | 38.0 °C | 28.2 °C | 11.7 °C | 29.6 °C | 19.2 °C | 8.2 °C | 22.0 °C | 10.4 °C | -3.0 °C | 29.6 mm | 0.3 mm | — | — |
| November | 31.0 °C | 20.3 °C | 8.0 °C | 22.5 °C | 12.3 °C | 0.4 °C | 17.0 °C | 4.9 °C | -8.0 °C | 35.3 mm | 0.9 mm | — | — |
| December | 26.0 °C | 14.5 °C | 2.0 °C | 16.2 °C | 7.7 °C | -2.4 °C | 12.0 °C | 1.7 °C | -14.5 °C | 34.5 mm | 1.3 mm | — | — |
Data Visualisations
Remove WatermarksCurrent Year Climate Trends vs Historical


Max Temperature this Year | 1 of 6
Climate 12-Month Moving Averages


Max Temperature 12-Month MA | 1 of 6
Daily Data Points and Averages Throughout the Year


Average Max Temperature Throughout Year | 1 of 5
