Climate for Station: Saentis, Appenzell Innerrhoden, Switzerland
Loading live weather...
Climate Analysis & Overview
Saentis, nestled in the Swiss Alps, is experiencing a notable warming trend over the last decade, with highs increasing by 1.20°C (2.16°F) and lows by 1.29°C (2.31°F). Despite this recent warming, the all-time trends show a more moderate rise, with highs and lows increasing by 0.20°C (0.36°F) and 0.13°C (0.23°F) respectively. Precipitation has become slightly more evenly distributed, as indicated by a marginal decrease in the Precipitation Concentration Index (PCI).
Alpine Climate Dynamics
Saentis is located in the heart of the Swiss Alps, characterised by its cold alpine climate, classified as Dfc under the Köppen climate classification. This region is known for its long, snowy winters and short, cool summers. The local geography, dominated by high peaks and deep valleys, significantly influences weather patterns, often leading to rapid changes in temperature and precipitation. The station's record temperatures reflect this variability, with a maximum of 21.0°C (69.8°F) and a minimum of -32.0°C (-25.6°F).
Decadal Warming Trends
Over the past decade, Saentis has experienced a pronounced warming trend, with average high temperatures increasing by 1.20°C (2.16°F) and lows by 1.29°C (2.31°F). This recent warming is more intense compared to the all-time trends, which show a more modest rise in both highs and lows. This discrepancy suggests that the recent decade has been particularly warm, possibly influenced by broader regional climate shifts and global warming patterns.
Long-term Temperature Shifts
The all-time temperature trends at Saentis reveal a gradual warming, with highs increasing by 0.20°C (0.36°F) and lows by 0.13°C (0.23°F). While these changes are less dramatic than the recent decade, they indicate a persistent warming trend over the long term. This warming aligns with Switzerland's broader climate goals of mitigating temperature rise through sustainable practices and reducing greenhouse gas emissions.
Precipitation Patterns
The Precipitation Concentration Index (PCI) at Saentis has experienced a slight decrease from a baseline of 11.01 to a current value of 10.96. This indicates that precipitation events have become marginally more evenly distributed, suggesting a shift towards more consistent rainfall rather than concentrated downpours. This change, while subtle, may have implications for local water resources and ecosystem stability.
Regional Implications
The warming trends observed at Saentis are reflective of broader climatic changes affecting the Swiss Alps. These shifts have significant implications for local ecosystems, snow cover, and water availability. As Switzerland continues to address climate change, understanding these localised patterns is crucial for developing effective adaptation strategies. The data from Saentis provides valuable insights into the ongoing climatic transformations in this iconic alpine region.
Station Statistics
10-Year Trend
High: +1.82 °C/decade
Low: +1.70 °C/decade
Rain: +0.06 mm/decade
25-Year Trend
High: +0.80 °C/decade
Low: +0.80 °C/decade
Rain: +0.17 mm/decade
50-Year Trend
High: +0.43 °C/decade
Low: +0.48 °C/decade
Rain: -0.04 mm/decade
All-Time Trend
High: +0.21 °C/decade
Low: +0.14 °C/decade
Rain: -0.46 mm/decade
Percentage Above-Average Days
Last 12 Months: 77.8%
This Year: 39.6%
Precipitation Concentration Index (PCI) ℹ️
Last 12 Months: 10.1
Historical Average: 10.3
Percentile Rank of Last 12 Months ℹ️
High: 100th percentile
Low: 100th percentile
Rain: 16th percentile
Change in Variance ℹ️
High: +5.8%
Low: +3.7%
Intraday: +14.8%
Data Coverage
82.7%
First Year of Data
1882
Station Location
Historical Weather Records
| Max High | Avg High | Min High | Max Avg | Avg Avg | Min Avg | Max Low | Avg Low | Min Low | Max Precipitation | Avg Precipitation | Max Snow | Avg Snow | |
|---|---|---|---|---|---|---|---|---|---|---|---|---|---|
| Record | 30.4 °C | — | -26.8 °C | 26.6 °C | — | -27.6 °C | 22.3 °C | — | -32.0 °C | 183.3 mm | — | — | — |
| January | 8.8 °C | -5.5 °C | -24.5 °C | 5.3 °C | -7.3 °C | -26.9 °C | 3.2 °C | -10.4 °C | -32.0 °C | 124.6 mm | 5.5 mm | — | — |
| February | 10.6 °C | -5.6 °C | -26.8 °C | 7.5 °C | -7.3 °C | -27.6 °C | 3.6 °C | -10.5 °C | -30.4 °C | 87.6 mm | 4.8 mm | — | — |
| March | 14.1 °C | -3.9 °C | -22.6 °C | 10.9 °C | -5.7 °C | -20.3 °C | 4.7 °C | -8.8 °C | -28.2 °C | 127.9 mm | 4.7 mm | — | — |
| April | 19.5 °C | -1.4 °C | -16.2 °C | 14.0 °C | -3.4 °C | -17.9 °C | 8.7 °C | -6.2 °C | -20.4 °C | 129.0 mm | 5.9 mm | — | — |
| May | 26.1 °C | 2.9 °C | -11.4 °C | 22.3 °C | 0.7 °C | -13.8 °C | 17.1 °C | -2.1 °C | -15.6 °C | 171.6 mm | 5.9 mm | — | — |
| June | 30.4 °C | 6.3 °C | -5.7 °C | 26.6 °C | 4.4 °C | -6.7 °C | 22.3 °C | 1.2 °C | -10.1 °C | 183.3 mm | 7.3 mm | — | — |
| July | 23.2 °C | 8.4 °C | -3.6 °C | 20.2 °C | 6.1 °C | -4.8 °C | 15.6 °C | 3.2 °C | -6.9 °C | 110.3 mm | 7.9 mm | — | — |
| August | 20.7 °C | 8.4 °C | -4.1 °C | 24.7 °C | 6.4 °C | -5.0 °C | 15.3 °C | 3.3 °C | -7.6 °C | 115.4 mm | 7.7 mm | — | — |
| September | 19.8 °C | 6.0 °C | -10.9 °C | 18.9 °C | 4.0 °C | -8.0 °C | 16.1 °C | 1.2 °C | -13.0 °C | 95.8 mm | 5.7 mm | — | — |
| October | 15.5 °C | 2.6 °C | -14.0 °C | 12.2 °C | 1.1 °C | -13.6 °C | 10.3 °C | -2.0 °C | -16.8 °C | 90.9 mm | 4.9 mm | — | — |
| November | 11.2 °C | -1.9 °C | -19.2 °C | 8.6 °C | -3.5 °C | -19.7 °C | 7.0 °C | -6.4 °C | -21.4 °C | 167.7 mm | 5.3 mm | — | — |
| December | 8.0 °C | -4.4 °C | -22.2 °C | 5.7 °C | -6.0 °C | -24.0 °C | 4.6 °C | -9.2 °C | -30.1 °C | 114.9 mm | 5.9 mm | — | — |
Data Visualisations
Remove WatermarksCurrent Year Climate Trends vs Historical


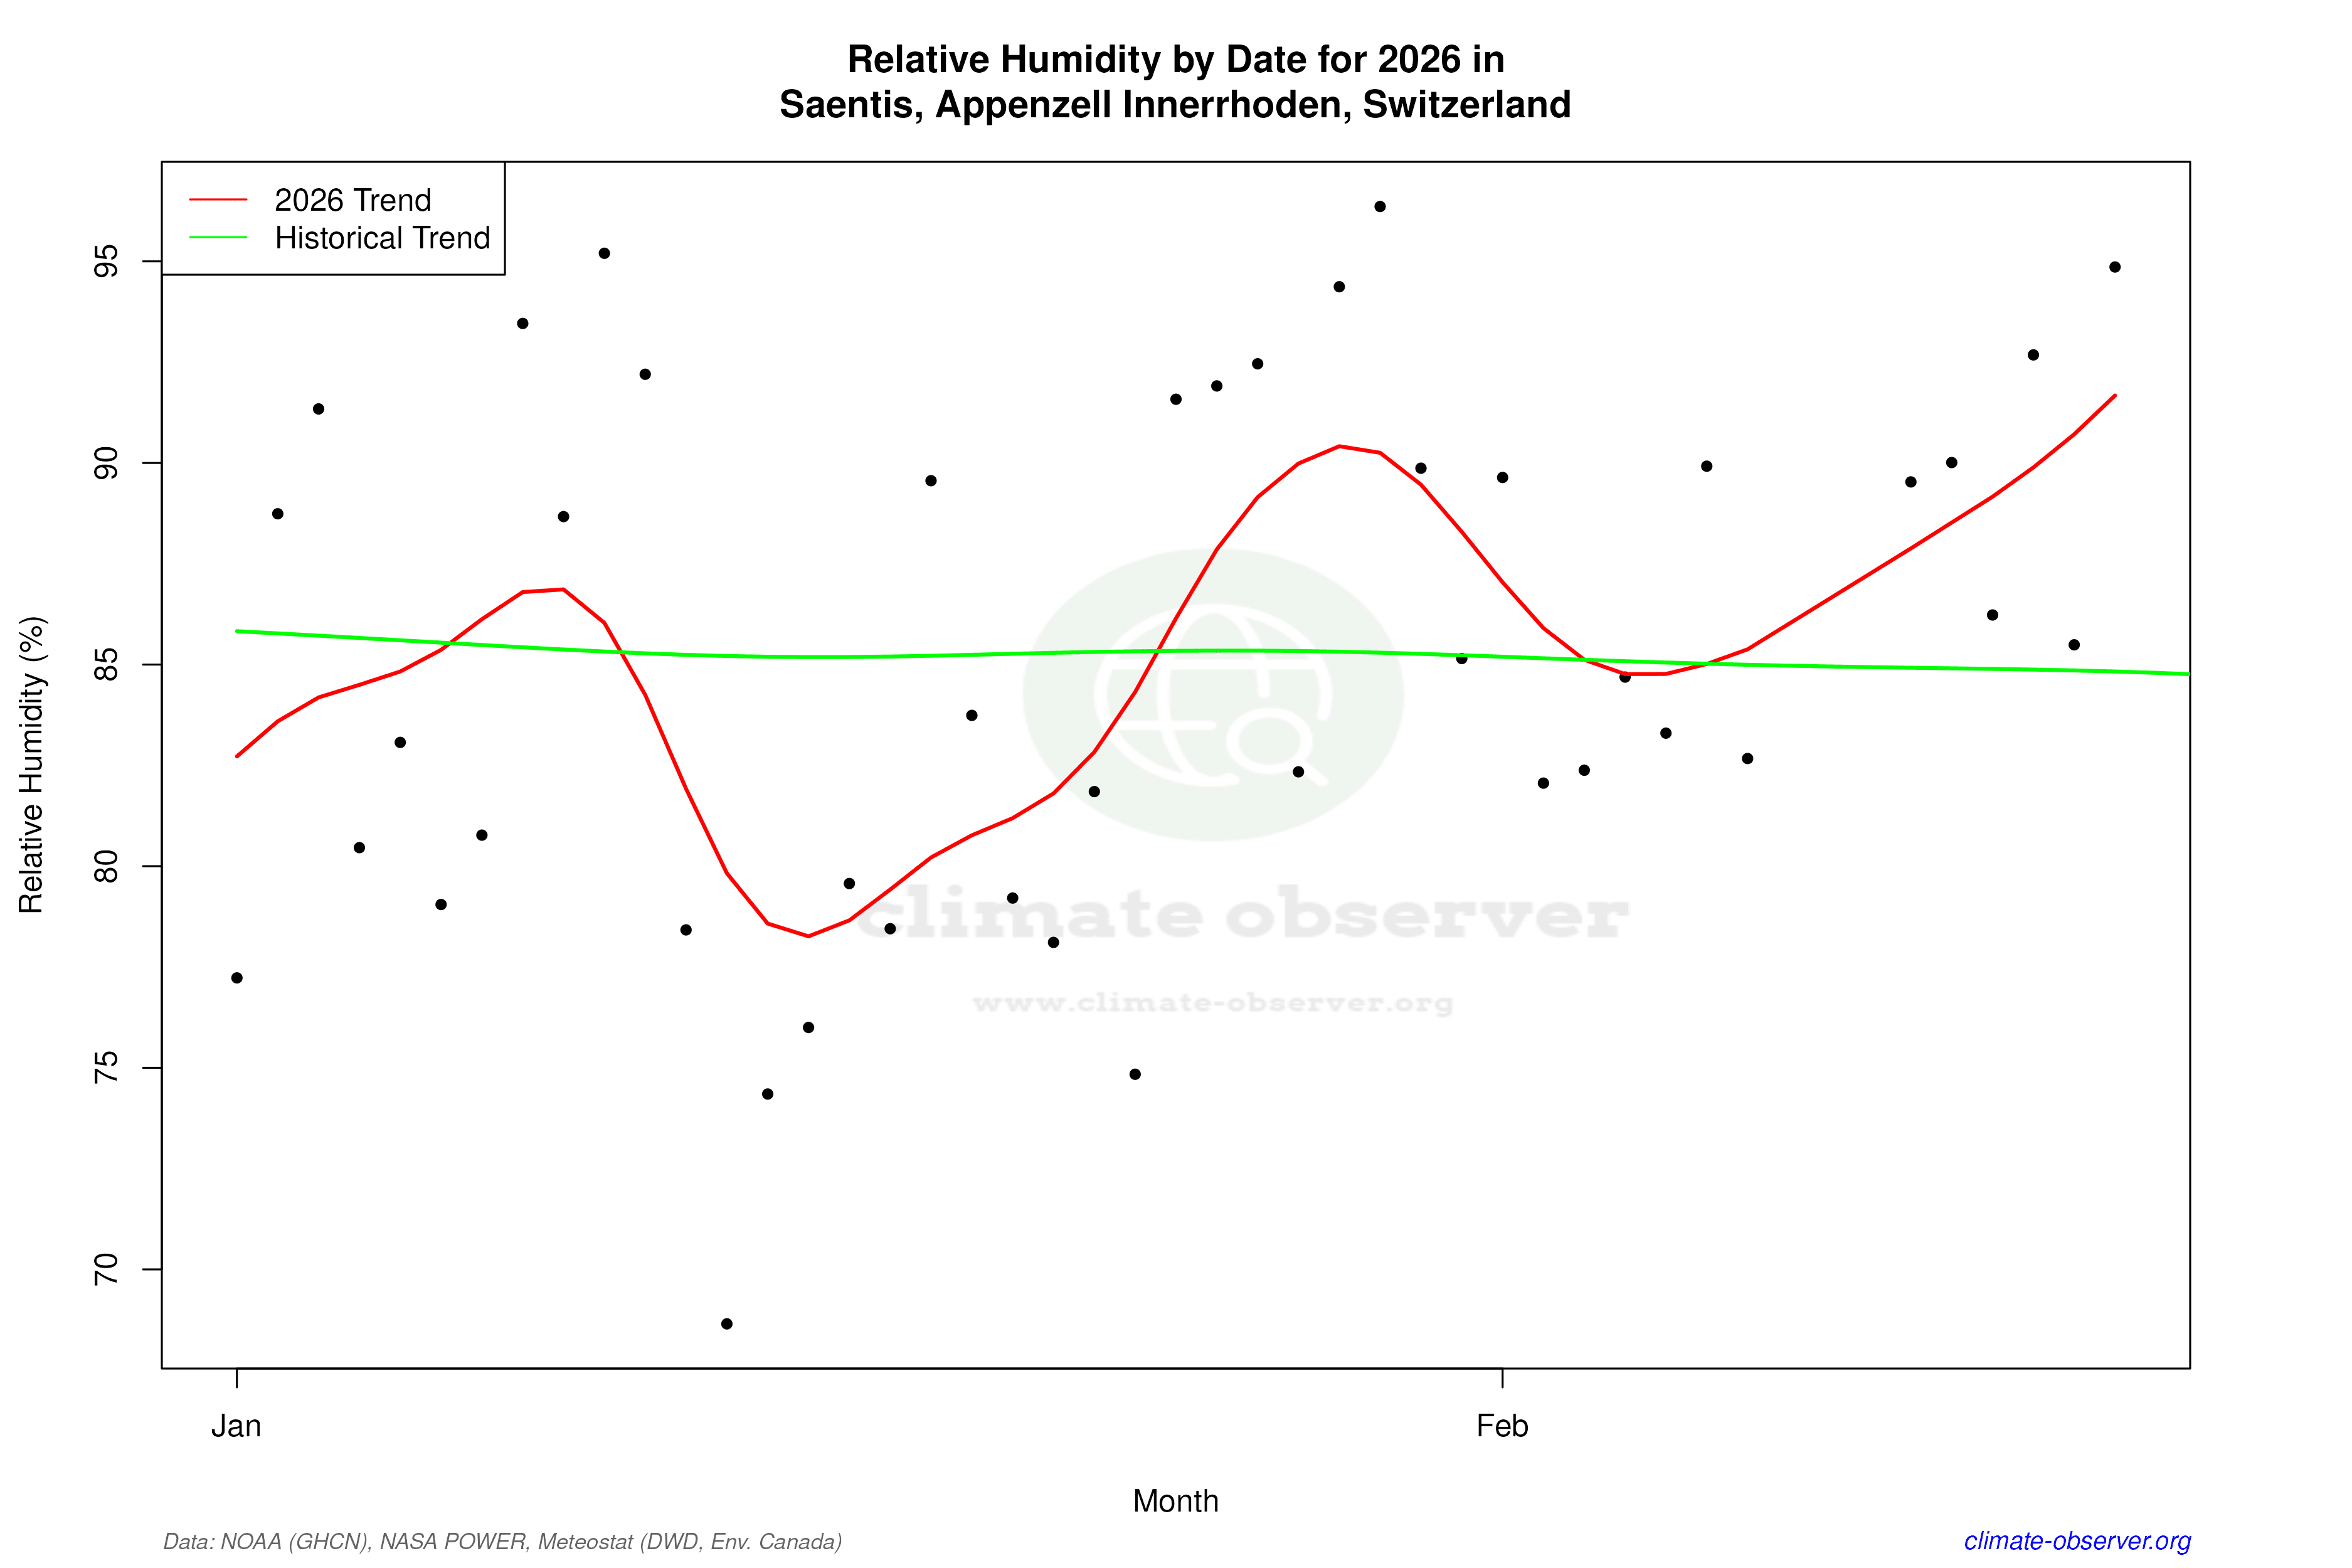

Max Temperature this Year | 1 of 6
Climate 12-Month Moving Averages


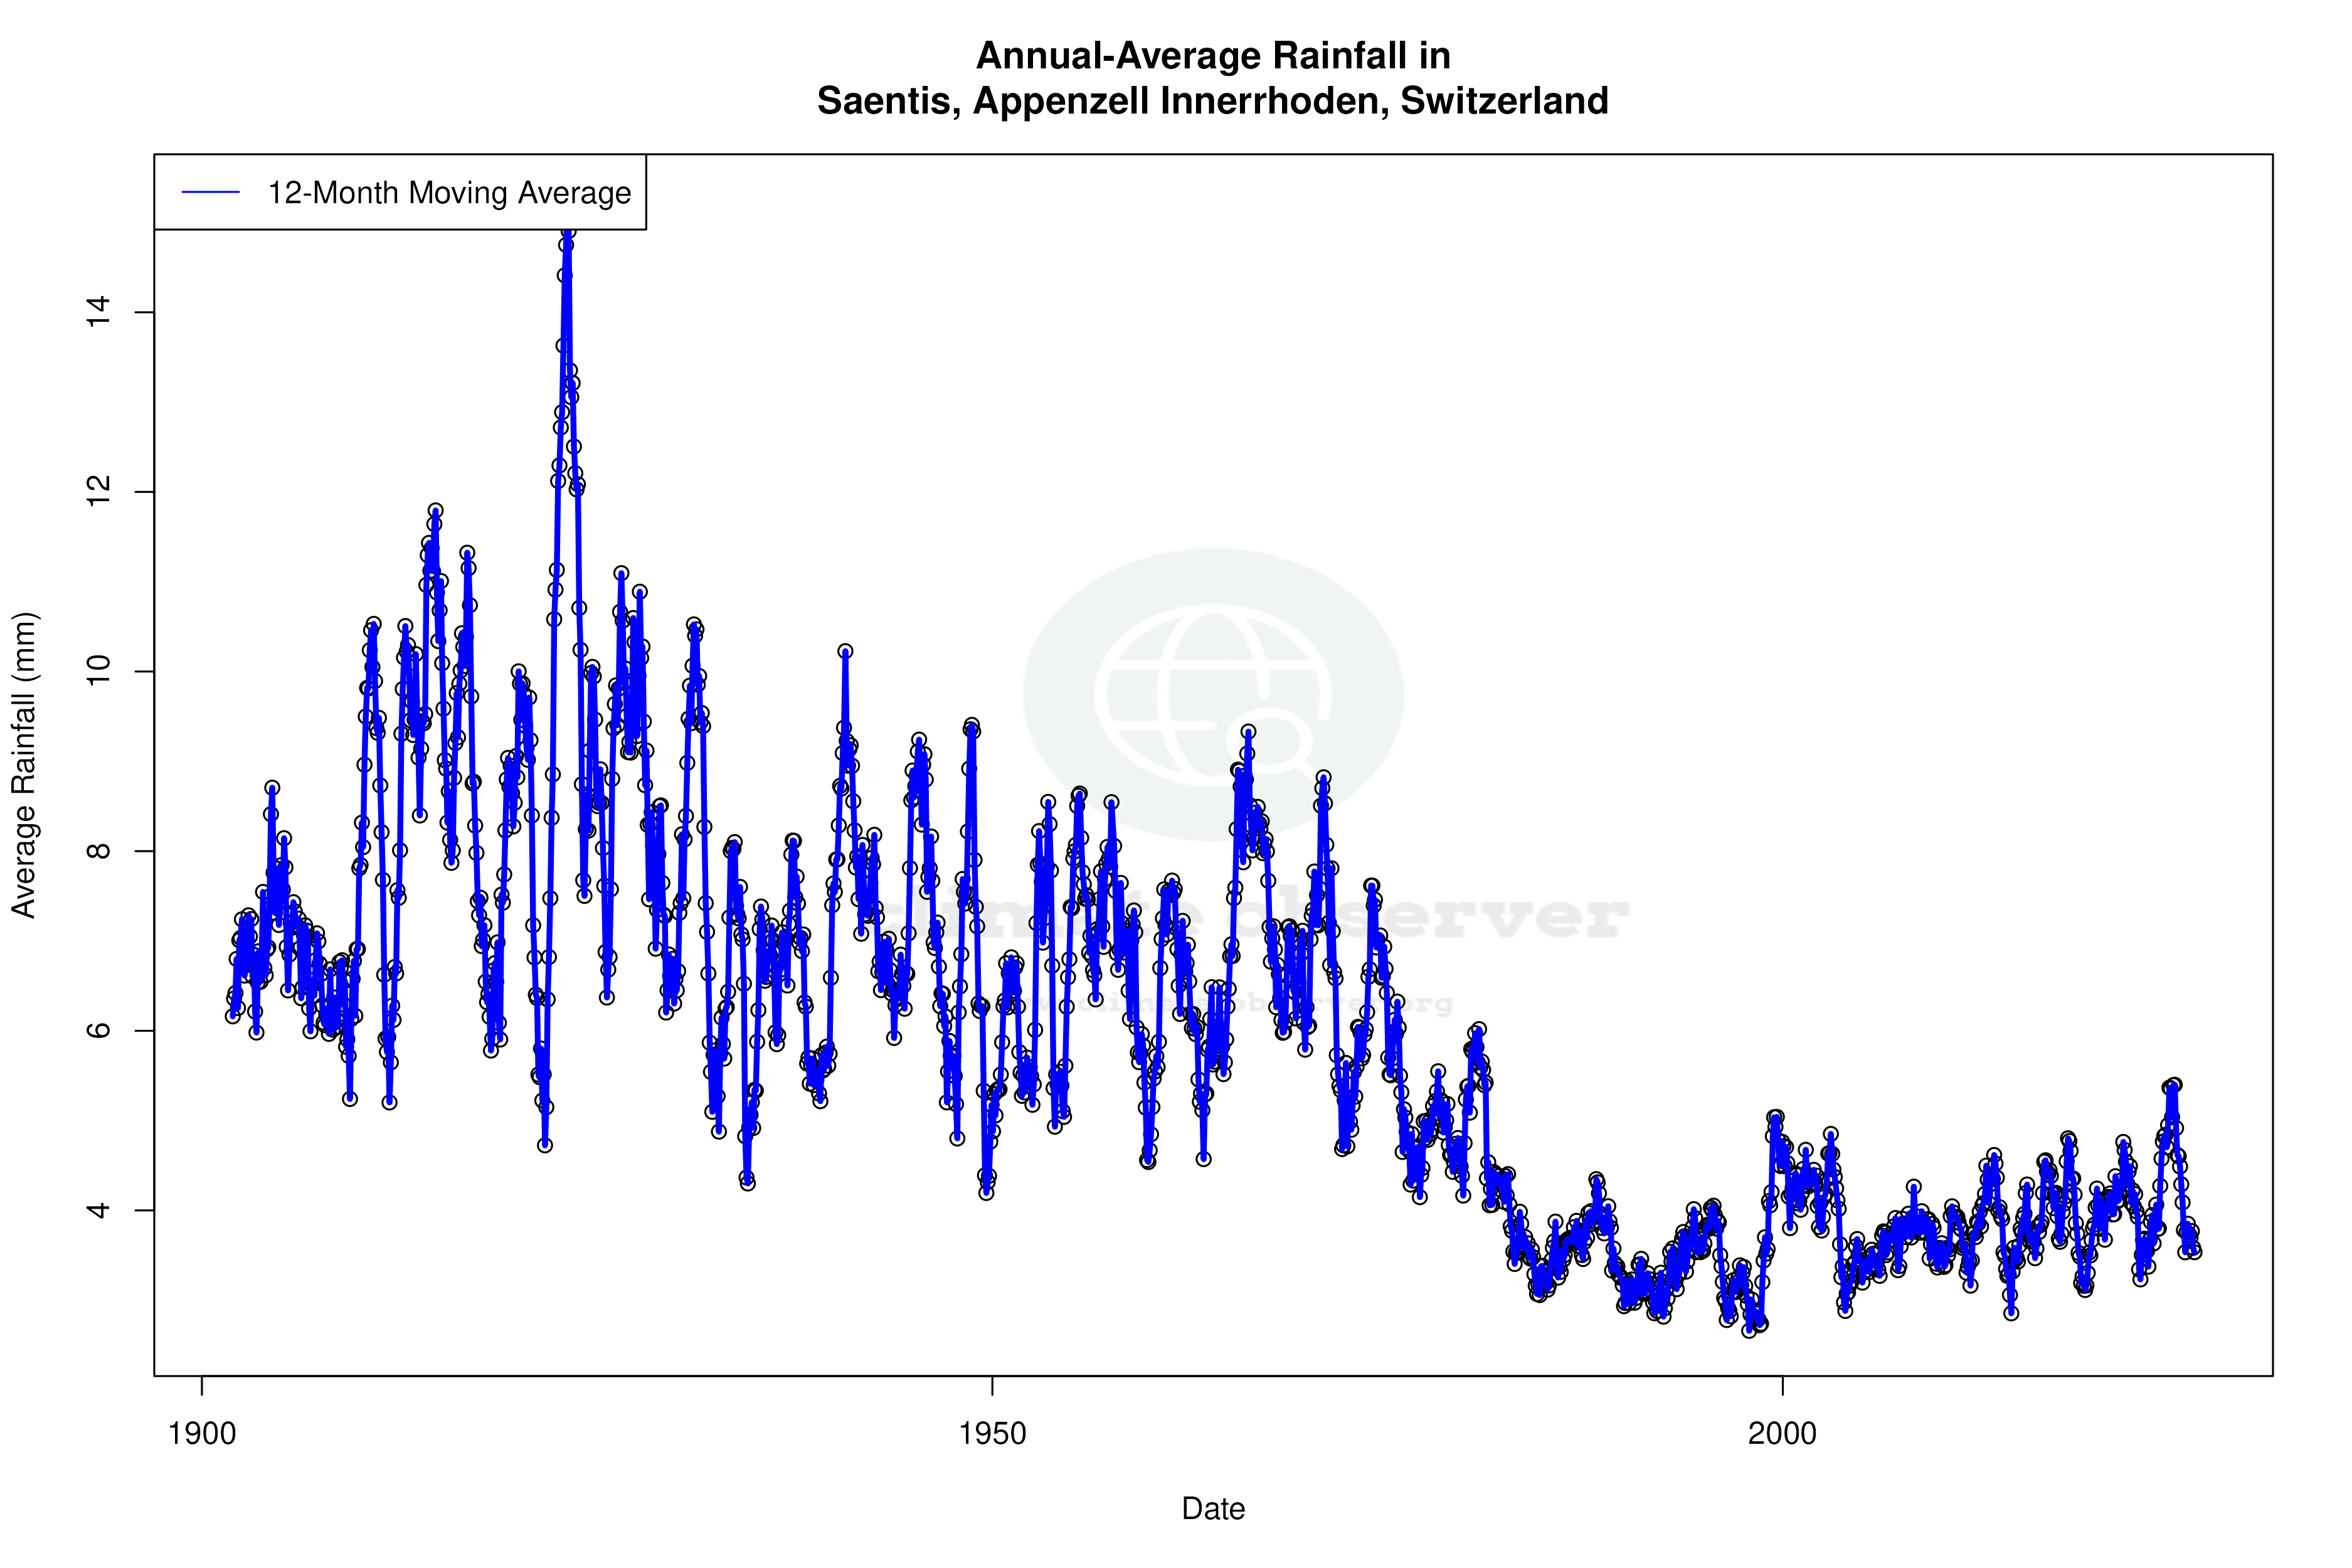
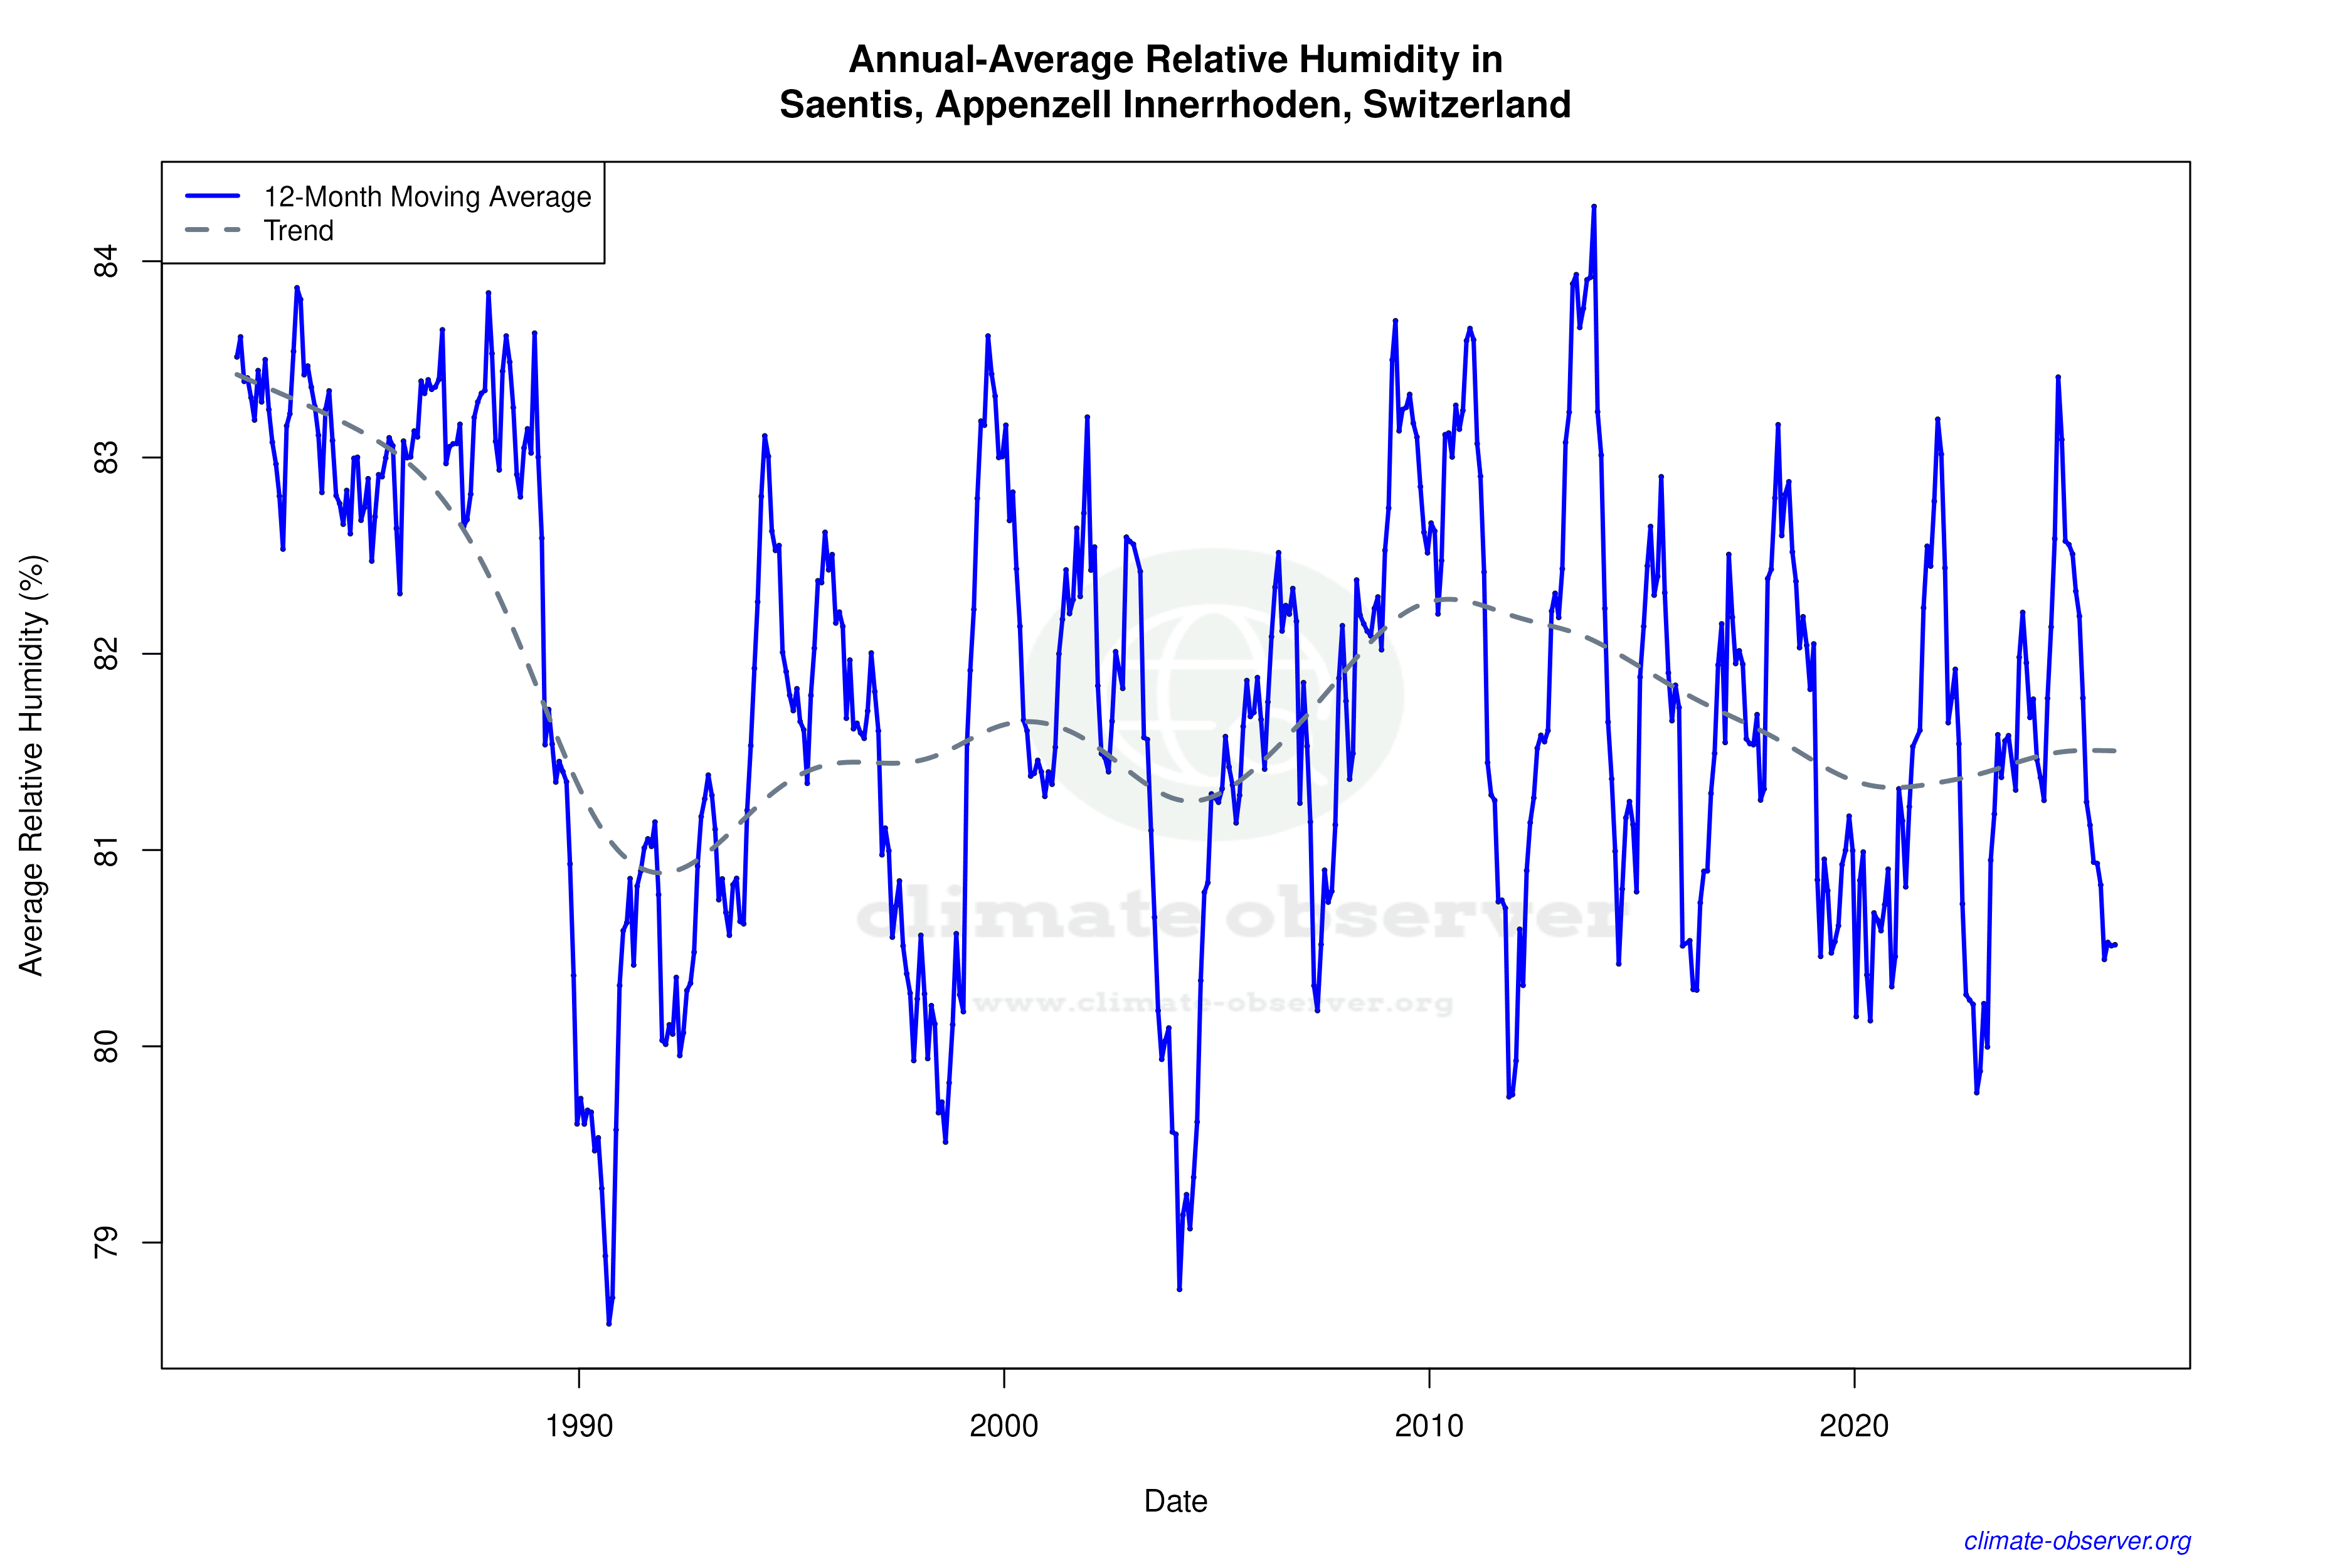

Max Temperature 12-Month MA | 1 of 6
Daily Data Points and Averages Throughout the Year


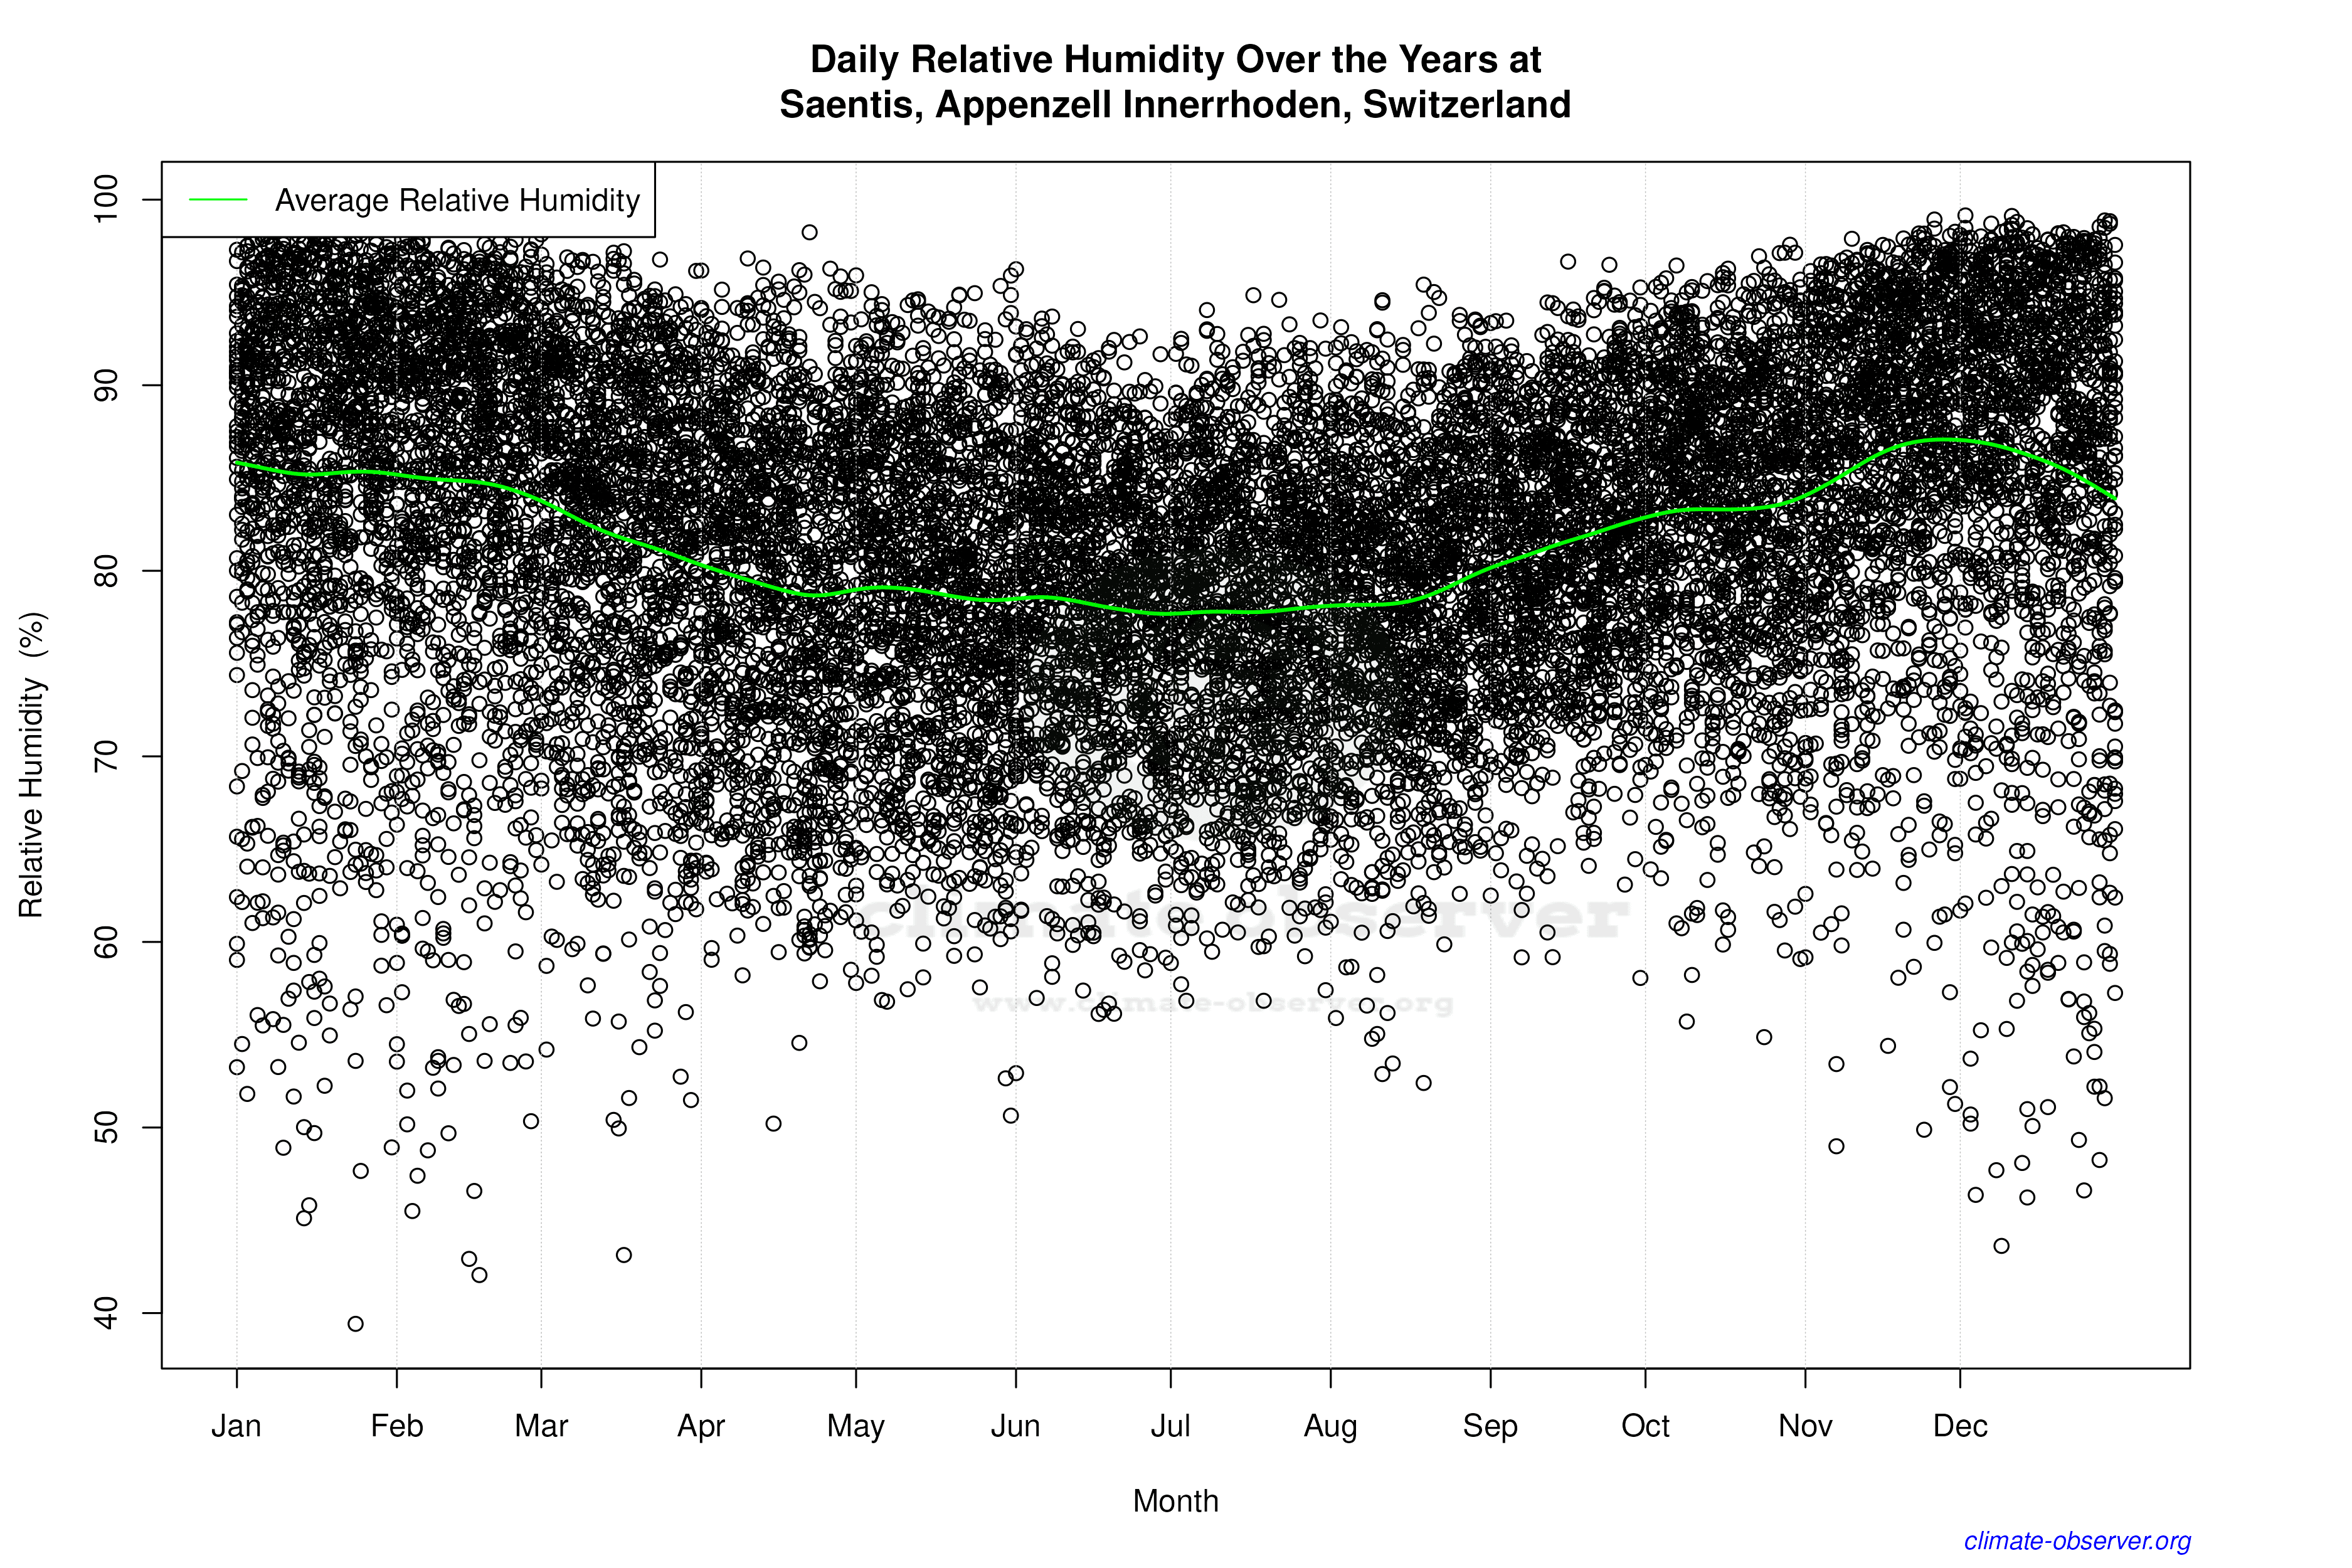

Average Max Temperature Throughout Year | 1 of 5
