Climate for Station: Roi et, Roi Et, Thailand
Loading live weather...
Climate Analysis & Overview
The climate profile of Roi Et, Thailand, reveals a complex interplay of warming and cooling trends over different timescales. While the all-time trends show a slight warming, the last decade has experienced a divergence with warmer highs and cooler lows. The precipitation distribution has become marginally more even, hinting at subtle shifts in the region's climate dynamics.
Köppen Climate Classification and Geographic Context
Roi Et, located at coordinates 16.05, 103.683, falls under the Tropical Savanna Climate (Aw) according to the Köppen classification. This classification is characterised by distinct wet and dry seasons, influenced by the monsoonal patterns typical of Thailand. The region's flat terrain and absence of significant geographical barriers allow for uniform temperature distribution and precipitation patterns. However, recent data suggest nuanced changes in these climatic characteristics.
Decadal Trends: Diverging Temperatures
Over the past decade, Roi Et has witnessed a warming trend in high temperatures, with an increase of 0.27°C (0.48°F). Conversely, the lows have shown a cooling trend, decreasing by 0.22°C (0.40°F). This divergence indicates a growing temperature range between day and night, potentially affecting local agriculture and daily life. Such changes might be attributed to alterations in cloud cover or localised atmospheric conditions, which merit further investigation.
All-Time Trends: A Subtle Warming
When considering the all-time data, both high and low temperatures show a warming trend. Highs have risen by 0.18°C (0.32°F), while lows have increased by 0.19°C (0.34°F). This consistent warming over a longer period aligns with broader global climate patterns, although the magnitude here remains relatively modest. The region's record temperatures, with a maximum of 43.3°C (109.9°F) and a minimum of 6.3°C (43.3°F), underscore the variability inherent in its climate.
Precipitation Patterns: A Marginal Shift
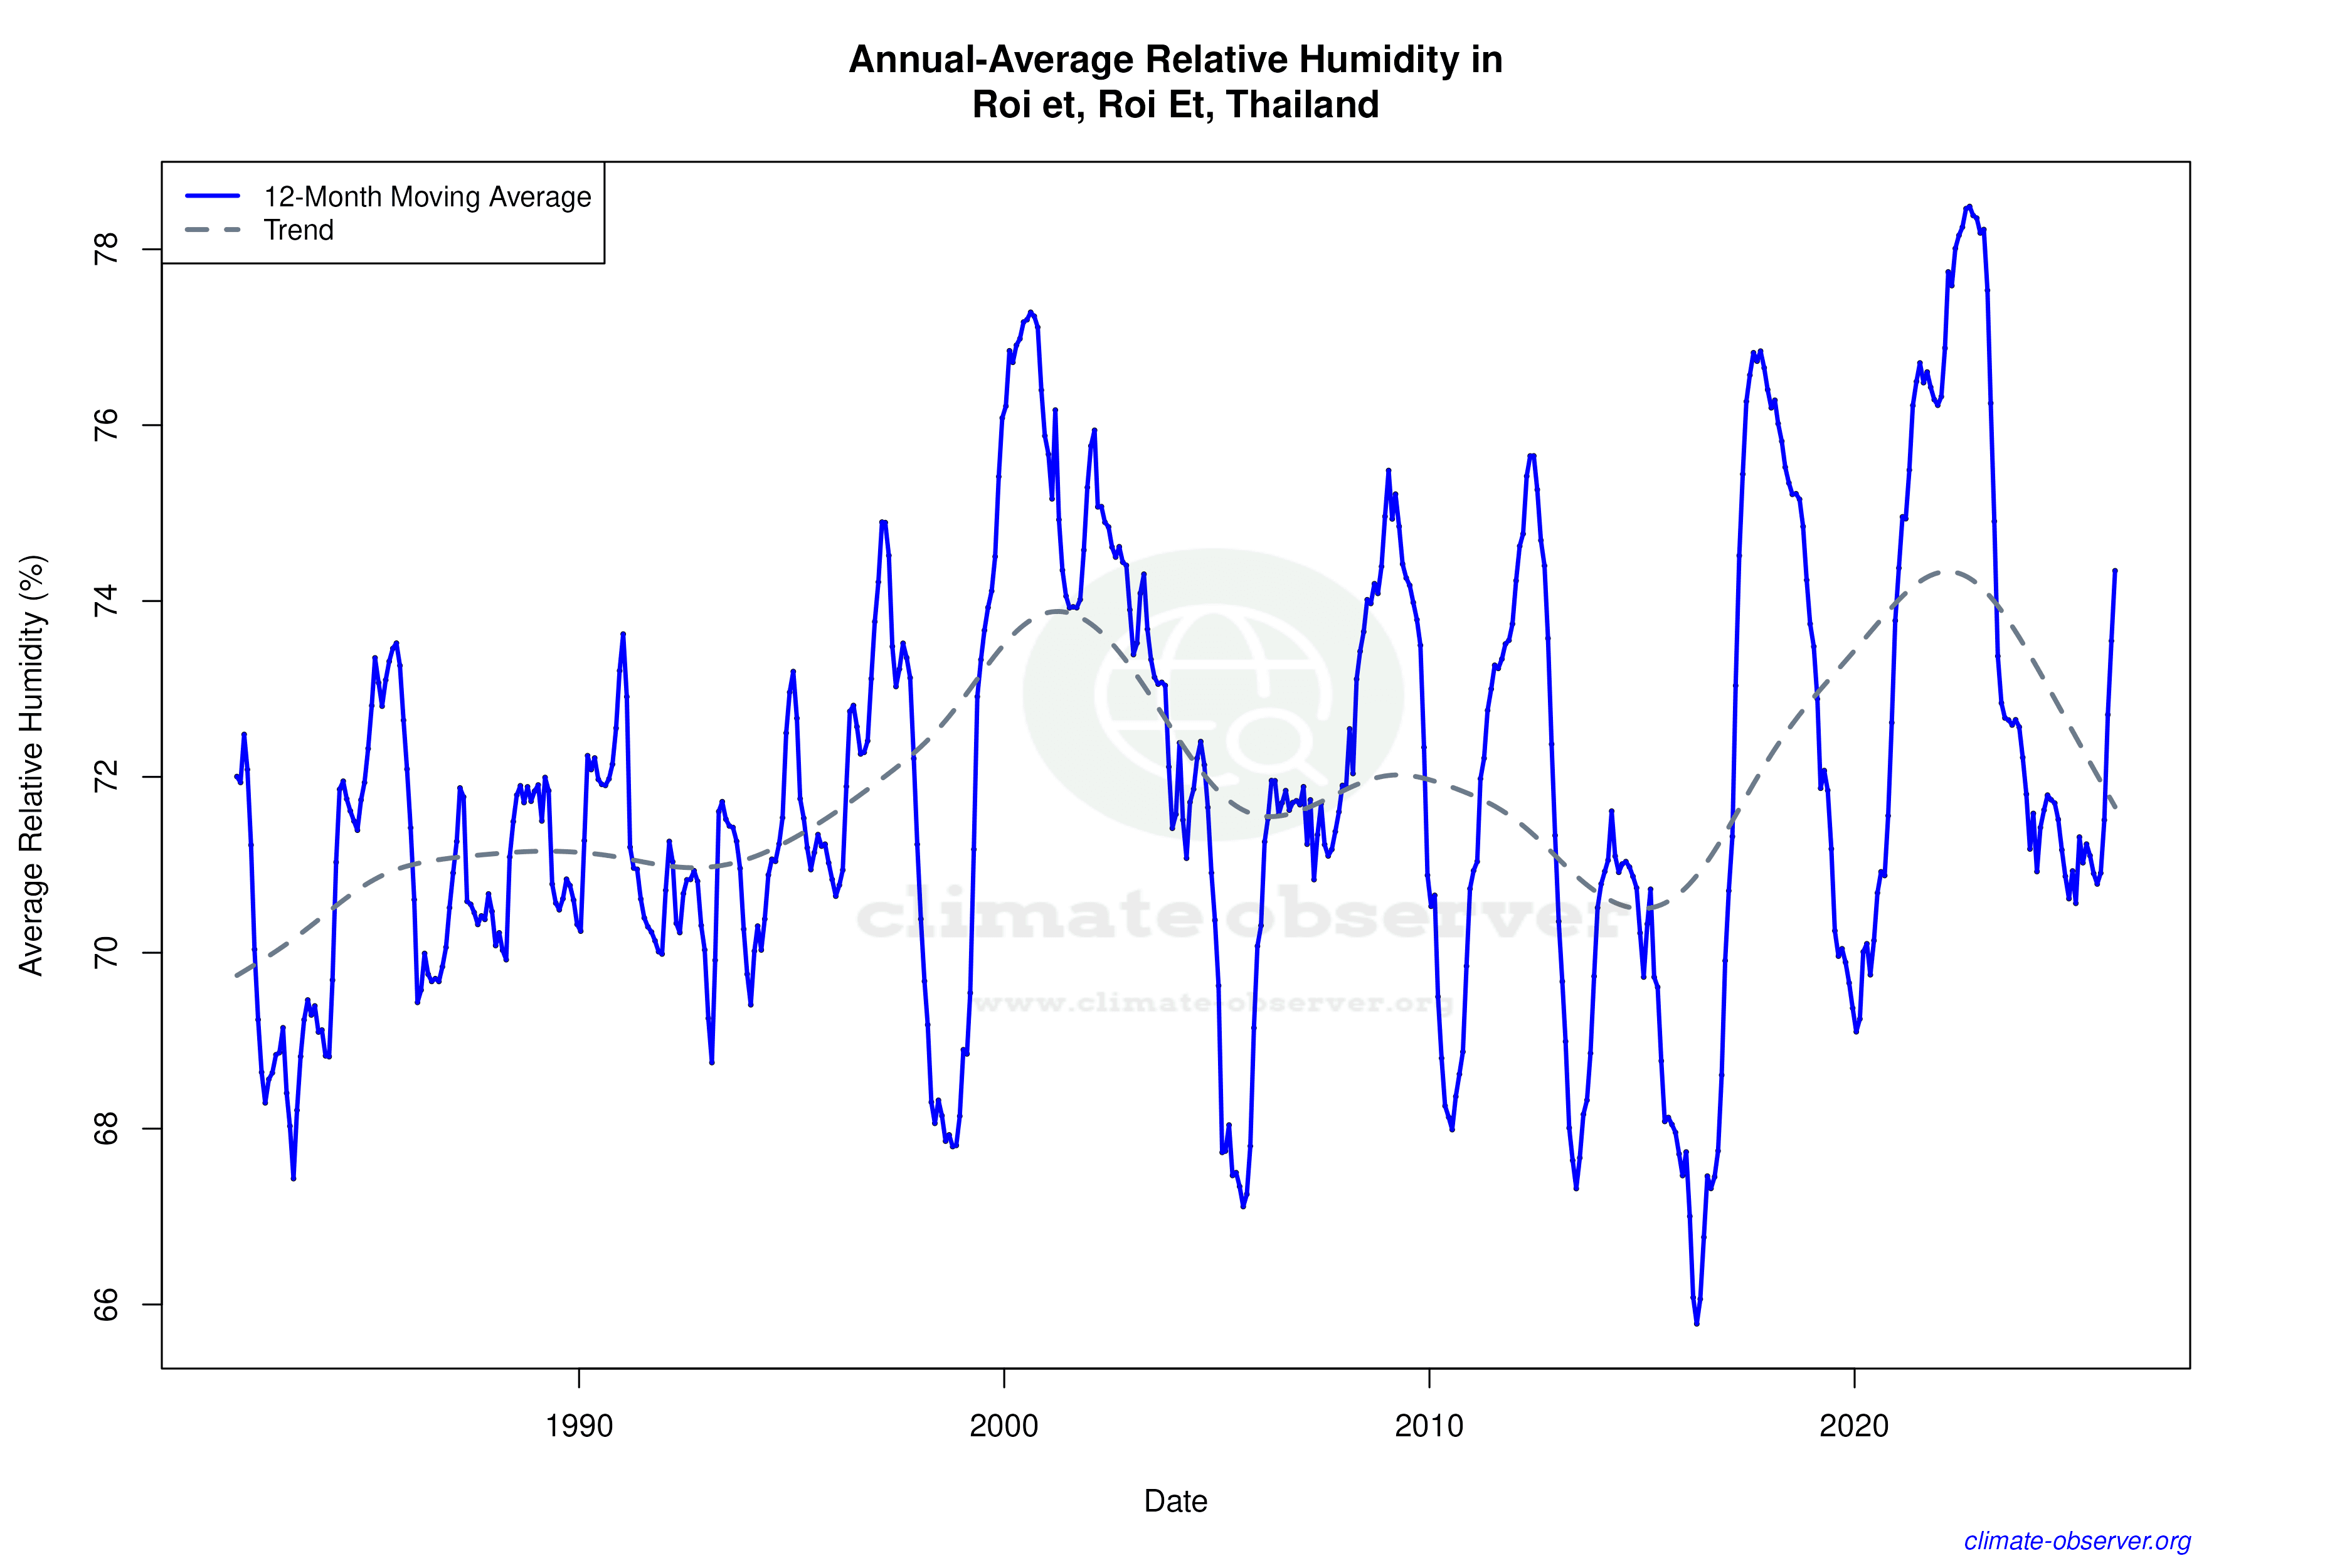
The Precipitation Concentration Index (PCI) for Roi Et has seen a slight decrease from a baseline of 16.80 to a current value of 16.00. This indicates a marginally more even distribution of rainfall throughout the year. While this change is not drastic, it suggests a trend towards less concentrated precipitation events, which could be beneficial in reducing the risk of flooding during the wet season and drought during the dry season.
Regional Climate Implications
These climatic shifts occur against the backdrop of Thailand's commitment to addressing climate change, with national goals aimed at reducing greenhouse gas emissions and enhancing climate resilience. Recent weather events, such as unseasonal rainfall or heatwaves, may be reflective of these emerging trends. As Roi Et continues to adapt to these changes, understanding these nuanced patterns will be crucial for effective planning and mitigation strategies.
Station Statistics
10-Year Trend
High: +0.21 °C/decade
Low: -0.23 °C/decade
Rain: -0.07 mm/decade
25-Year Trend
High: +0.37 °C/decade
Low: +0.39 °C/decade
Rain: +0.32 mm/decade
50-Year Trend
High: +0.30 °C/decade
Low: +0.25 °C/decade
Rain: +0.19 mm/decade
All-Time Trend
High: +0.18 °C/decade
Low: +0.19 °C/decade
Rain: +0.08 mm/decade
Percentage Above-Average Days
Last 12 Months: 41.6%
This Year: 55.6%
Precipitation Concentration Index (PCI) ℹ️
Last 12 Months: 13.2
Historical Average: 17.0
Percentile Rank of Last 12 Months ℹ️
High: 70th percentile
Low: 65th percentile
Rain: 91st percentile
Change in Variance ℹ️
High: +5.7%
Low: -21.1%
Intraday: -15.0%
Data Coverage
92.6%
First Year of Data
1951
Station Location
Historical Weather Records
| Max High | Avg High | Min High | Max Avg | Avg Avg | Min Avg | Max Low | Avg Low | Min Low | Max Precipitation | Avg Precipitation | Max Snow | Avg Snow | |
|---|---|---|---|---|---|---|---|---|---|---|---|---|---|
| Record | 43.3 °C | — | 15.1 °C | 36.9 °C | — | 12.6 °C | 31.5 °C | — | 6.3 °C | 242.3 mm | — | — | — |
| January | 38.9 °C | 30.3 °C | 15.1 °C | 31.3 °C | 23.8 °C | 12.6 °C | 25.4 °C | 16.9 °C | 6.3 °C | 26.0 mm | 0.1 mm | — | — |
| February | 39.7 °C | 32.6 °C | 18.9 °C | 33.1 °C | 26.1 °C | 14.9 °C | 28.8 °C | 19.5 °C | 9.8 °C | 59.6 mm | 0.5 mm | — | — |
| March | 42.1 °C | 34.8 °C | 20.7 °C | 34.6 °C | 28.7 °C | 16.7 °C | 29.9 °C | 22.7 °C | 10.4 °C | 63.0 mm | 1.3 mm | — | — |
| April | 43.3 °C | 35.9 °C | 20.4 °C | 36.9 °C | 30.3 °C | 18.2 °C | 31.5 °C | 24.8 °C | 14.0 °C | 94.0 mm | 2.9 mm | — | — |
| May | 42.7 °C | 34.4 °C | 23.2 °C | 36.4 °C | 29.5 °C | 20.1 °C | 31.2 °C | 25.0 °C | 17.7 °C | 118.0 mm | 6.4 mm | — | — |
| June | 43.0 °C | 33.1 °C | 25.3 °C | 34.6 °C | 29.0 °C | 23.6 °C | 28.6 °C | 24.9 °C | 19.7 °C | 173.6 mm | 6.8 mm | — | — |
| July | 39.6 °C | 32.3 °C | 24.5 °C | 34.1 °C | 28.5 °C | 23.0 °C | 28.9 °C | 24.6 °C | 21.2 °C | 149.9 mm | 7.0 mm | — | — |
| August | 40.8 °C | 31.7 °C | 23.9 °C | 32.8 °C | 28.1 °C | 23.7 °C | 27.8 °C | 24.5 °C | 21.1 °C | 174.2 mm | 8.7 mm | — | — |
| September | 37.1 °C | 31.2 °C | 24.0 °C | 32.1 °C | 27.7 °C | 22.8 °C | 26.9 °C | 24.1 °C | 19.4 °C | 242.3 mm | 9.6 mm | — | — |
| October | 38.2 °C | 31.1 °C | 22.8 °C | 31.2 °C | 27.0 °C | 20.6 °C | 29.3 °C | 22.5 °C | 14.6 °C | 105.6 mm | 3.3 mm | — | — |
| November | 36.6 °C | 30.6 °C | 21.7 °C | 30.8 °C | 25.5 °C | 17.7 °C | 25.6 °C | 19.8 °C | 10.2 °C | 33.0 mm | 0.4 mm | — | — |
| December | 36.2 °C | 29.6 °C | 18.6 °C | 29.8 °C | 23.6 °C | 14.0 °C | 24.3 °C | 17.1 °C | 6.7 °C | 21.9 mm | 0.0 mm | — | — |
Data Visualisations
Remove WatermarksCurrent Year Climate Trends vs Historical


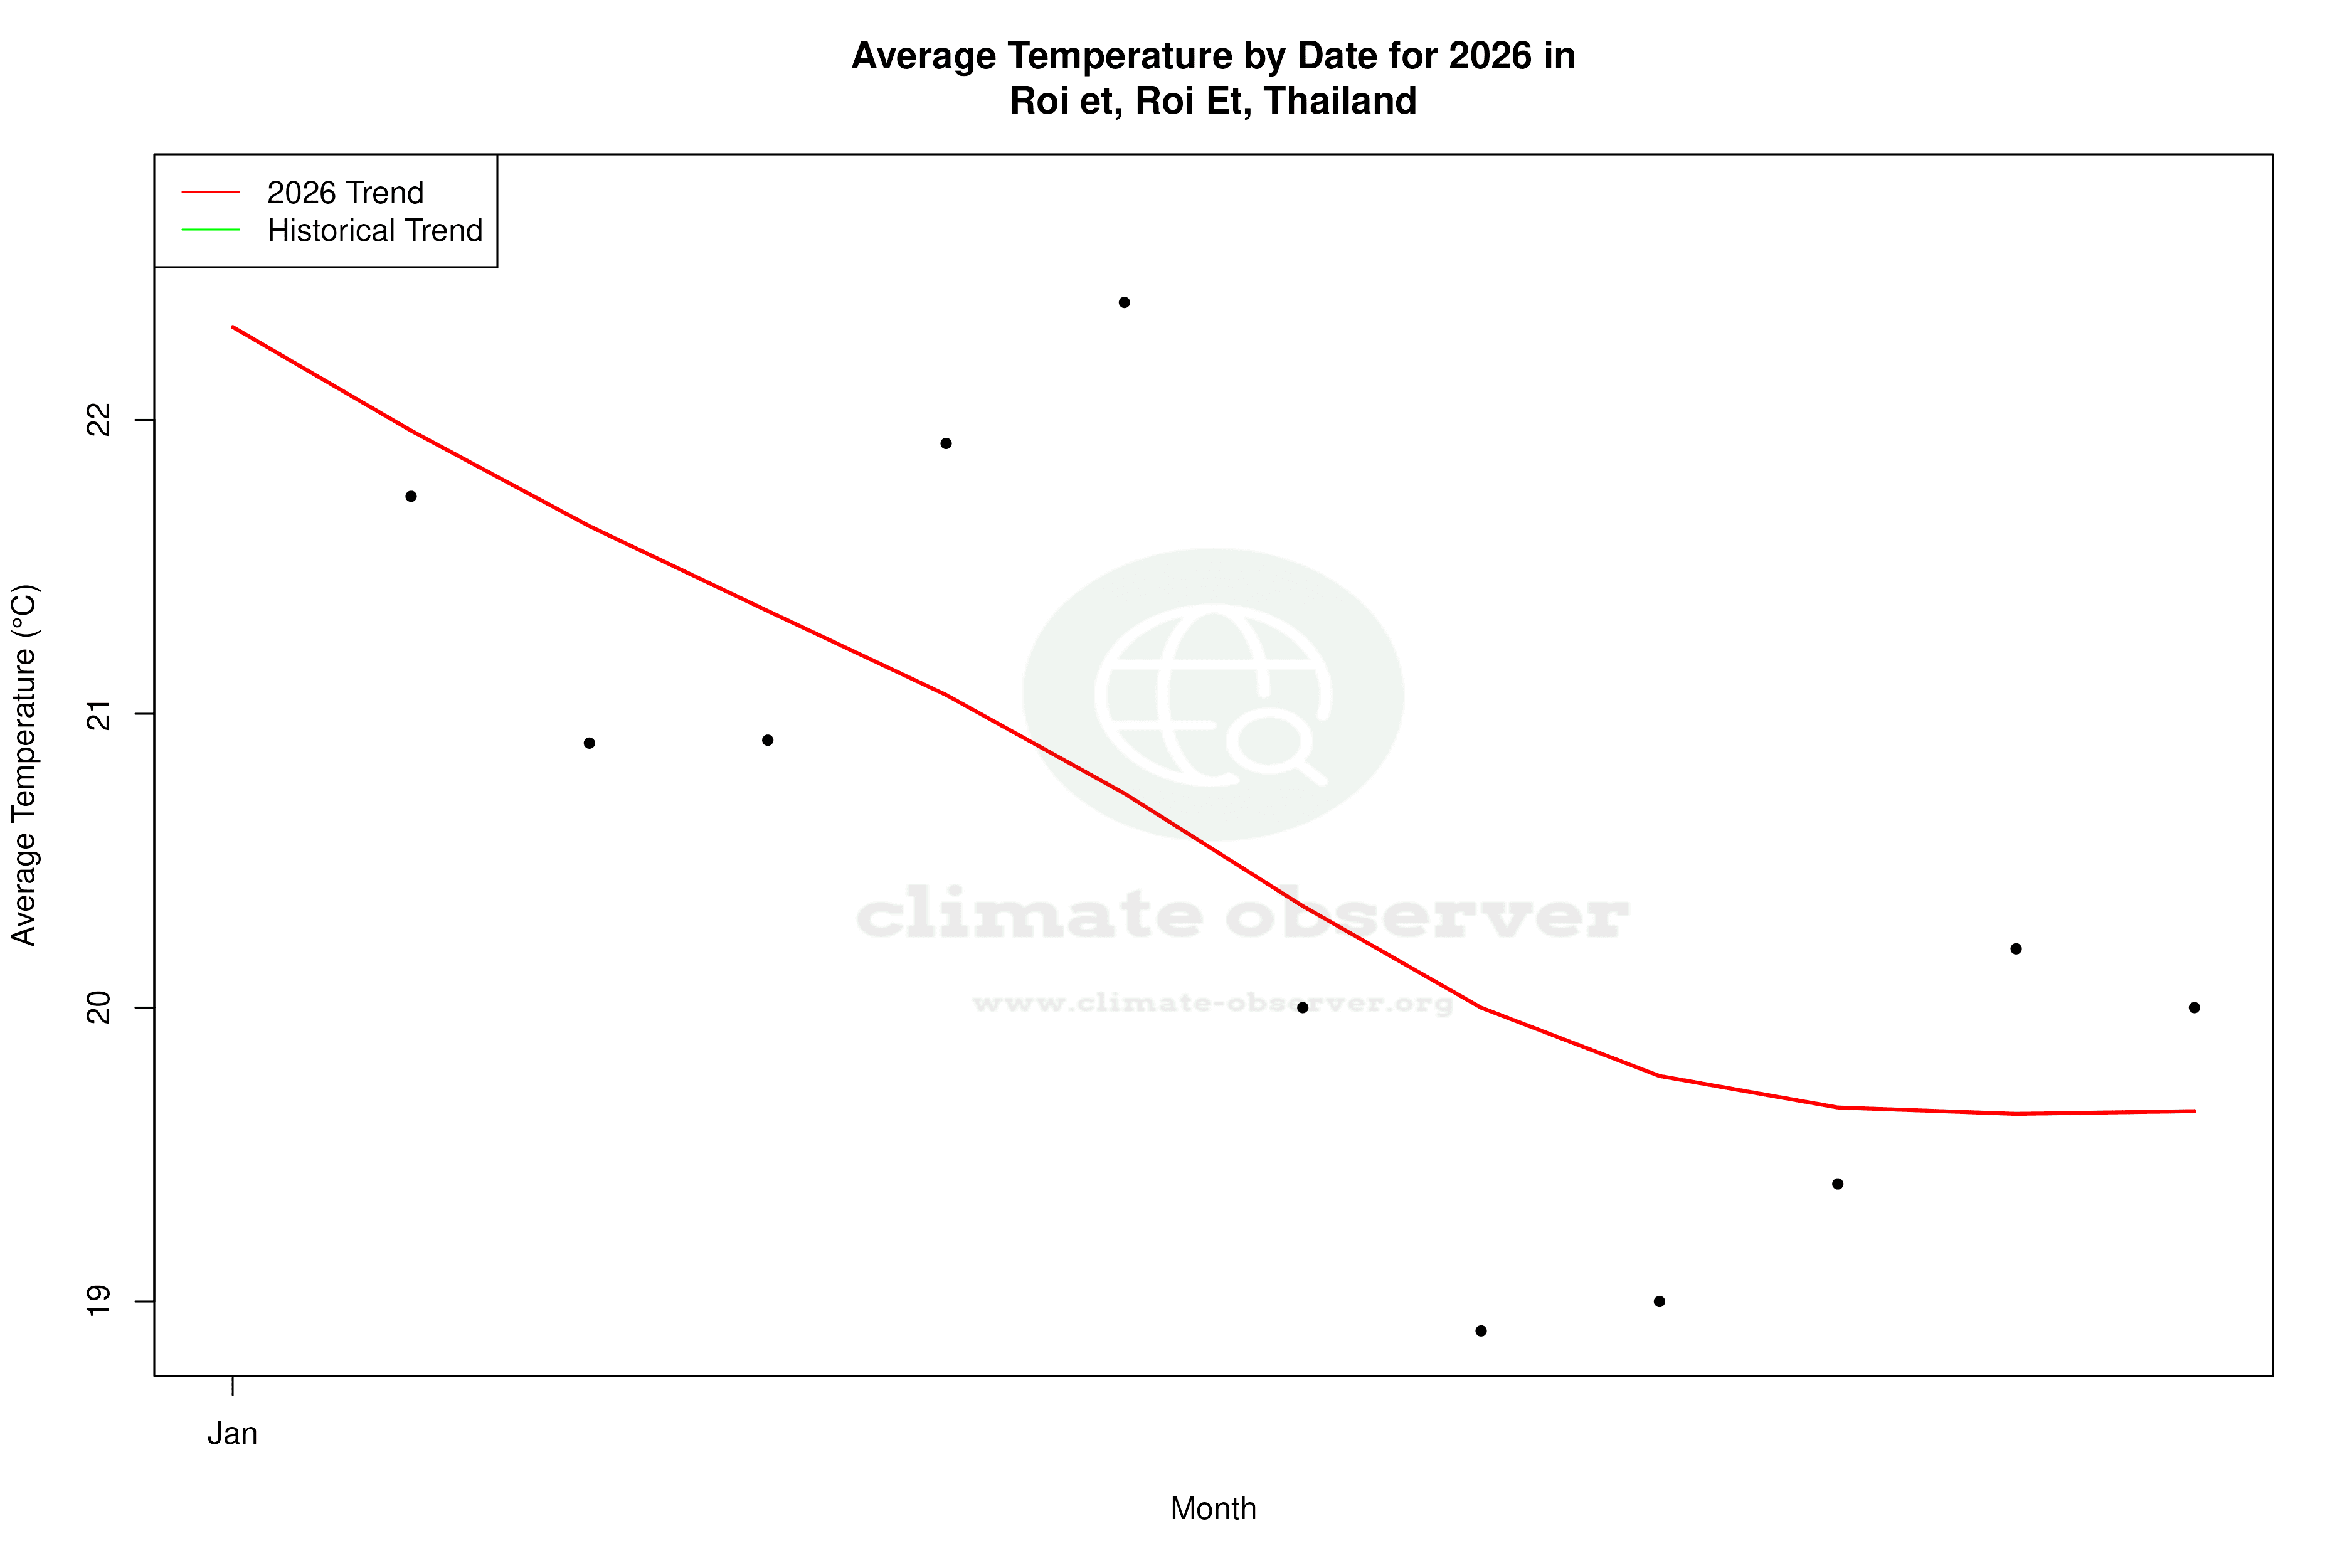


Max Temperature this Year | 1 of 6
Climate 12-Month Moving Averages


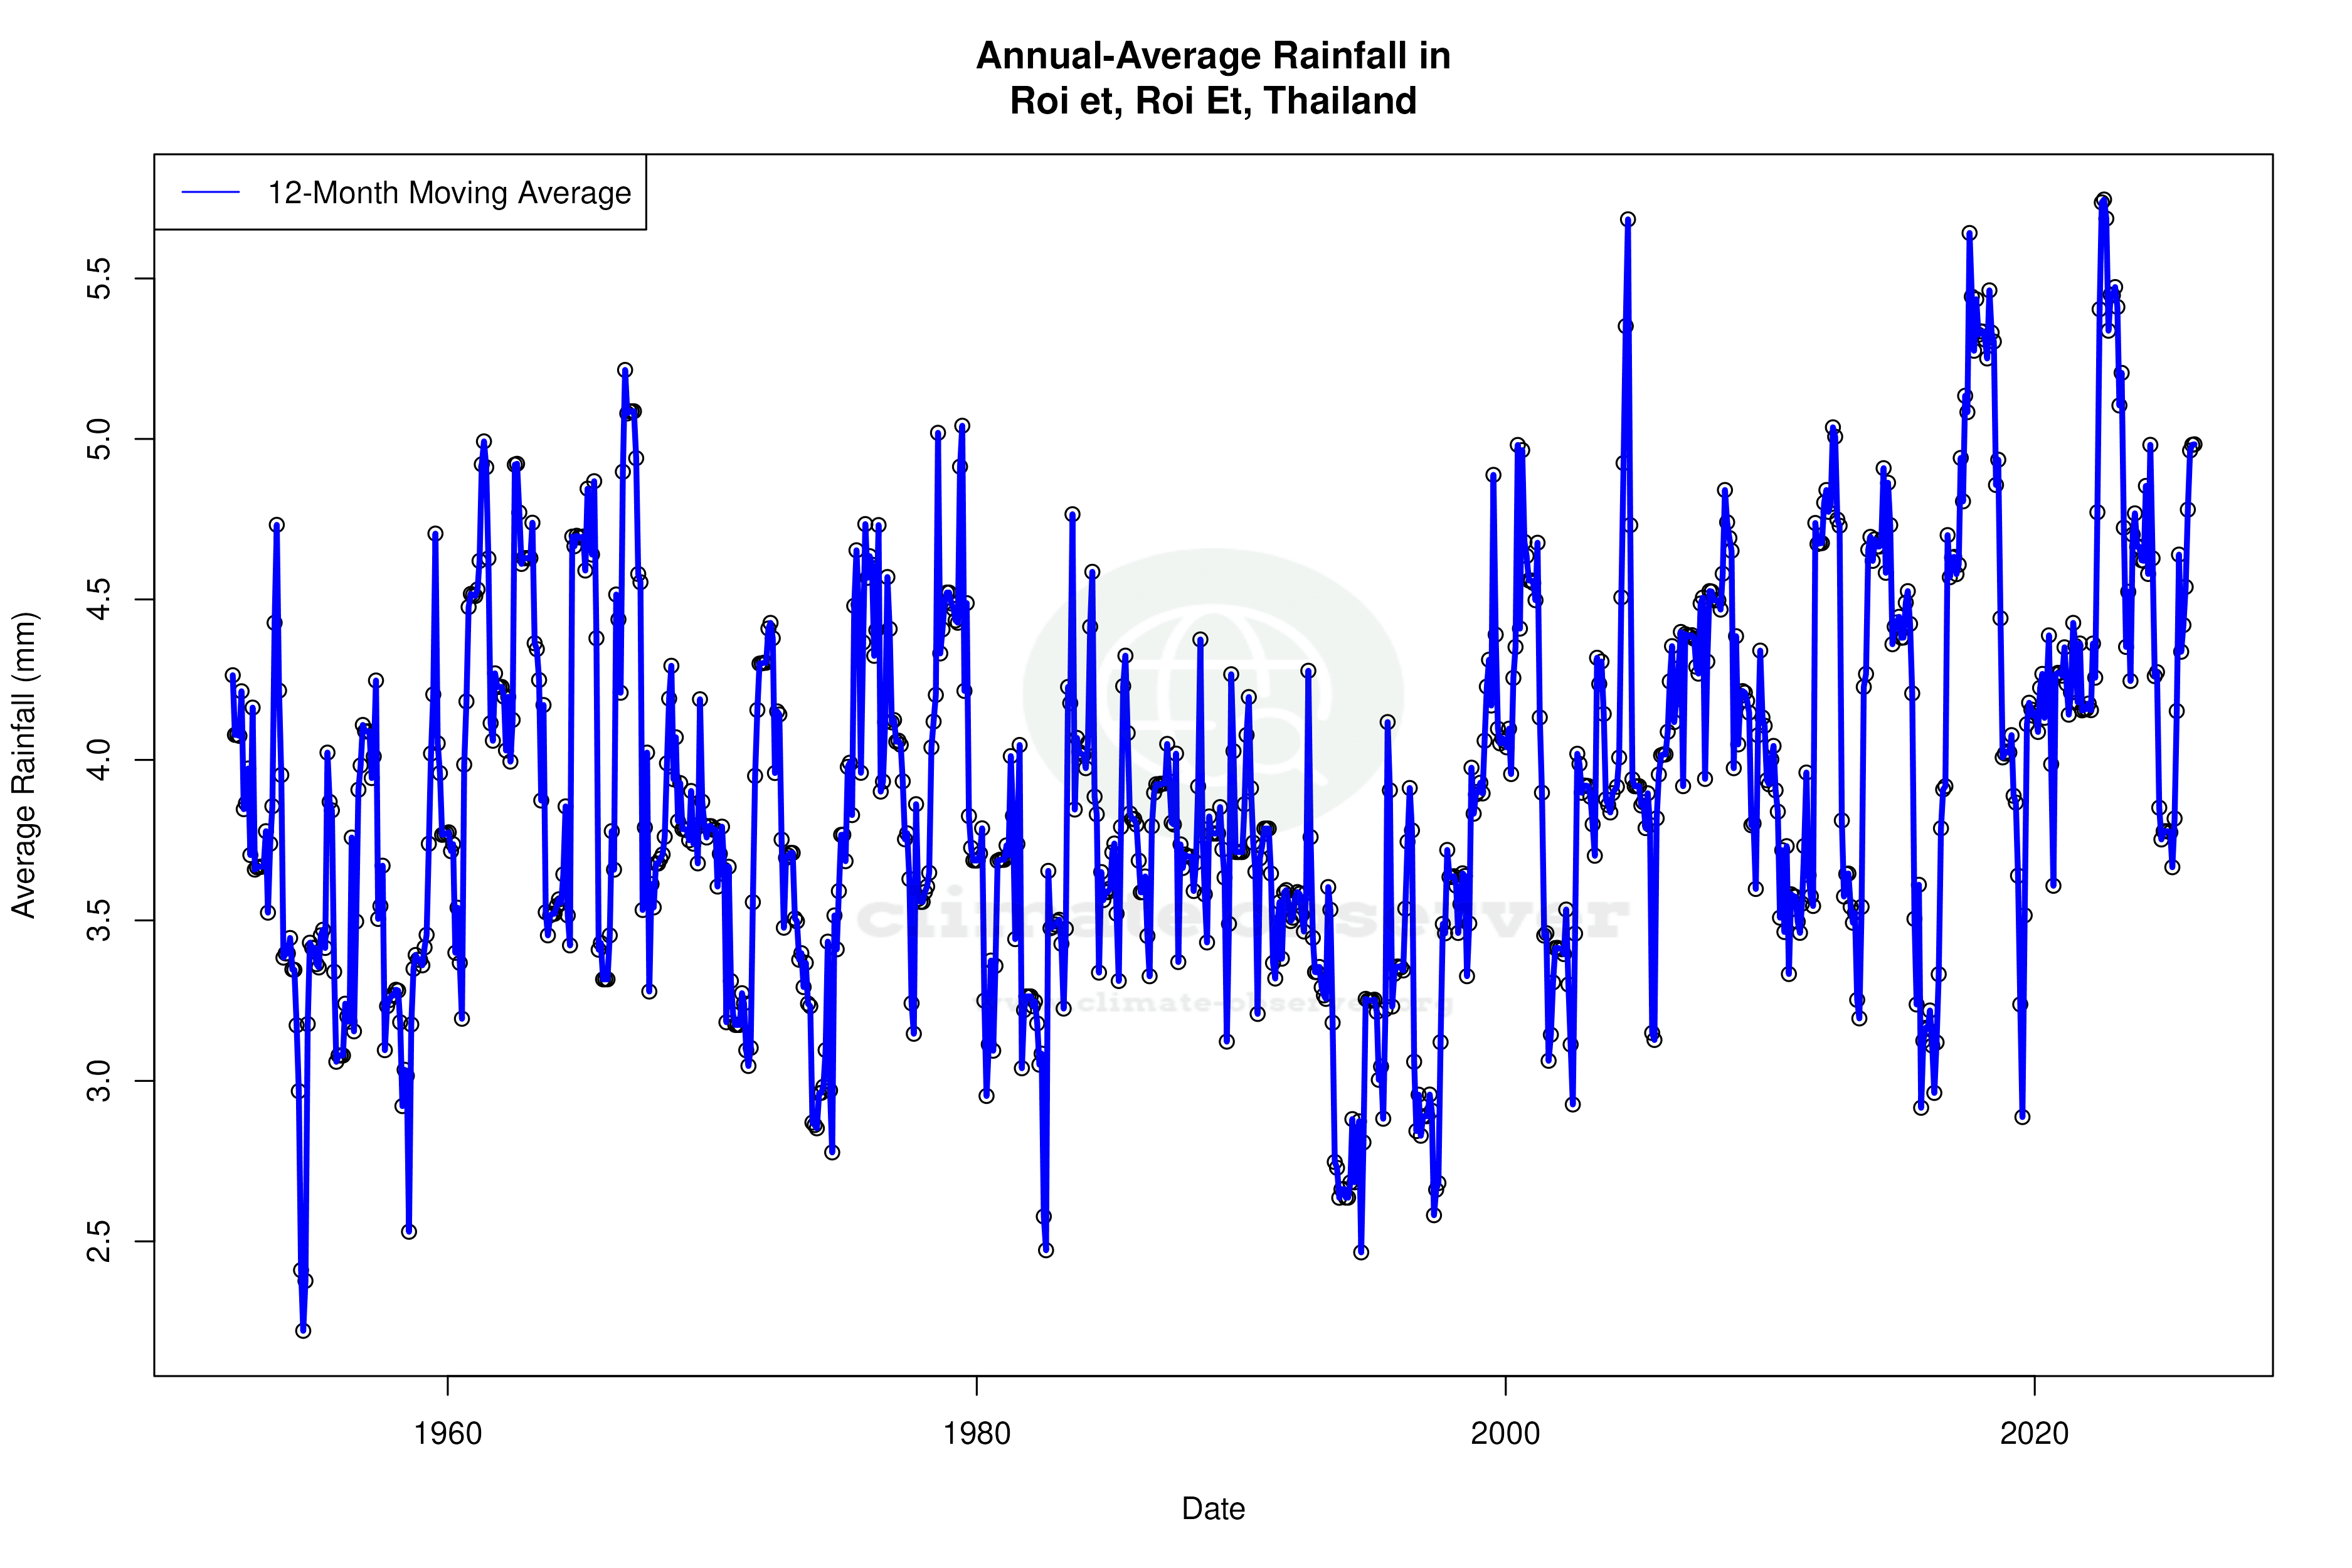

Max Temperature 12-Month MA | 1 of 6
Daily Data Points and Averages Throughout the Year
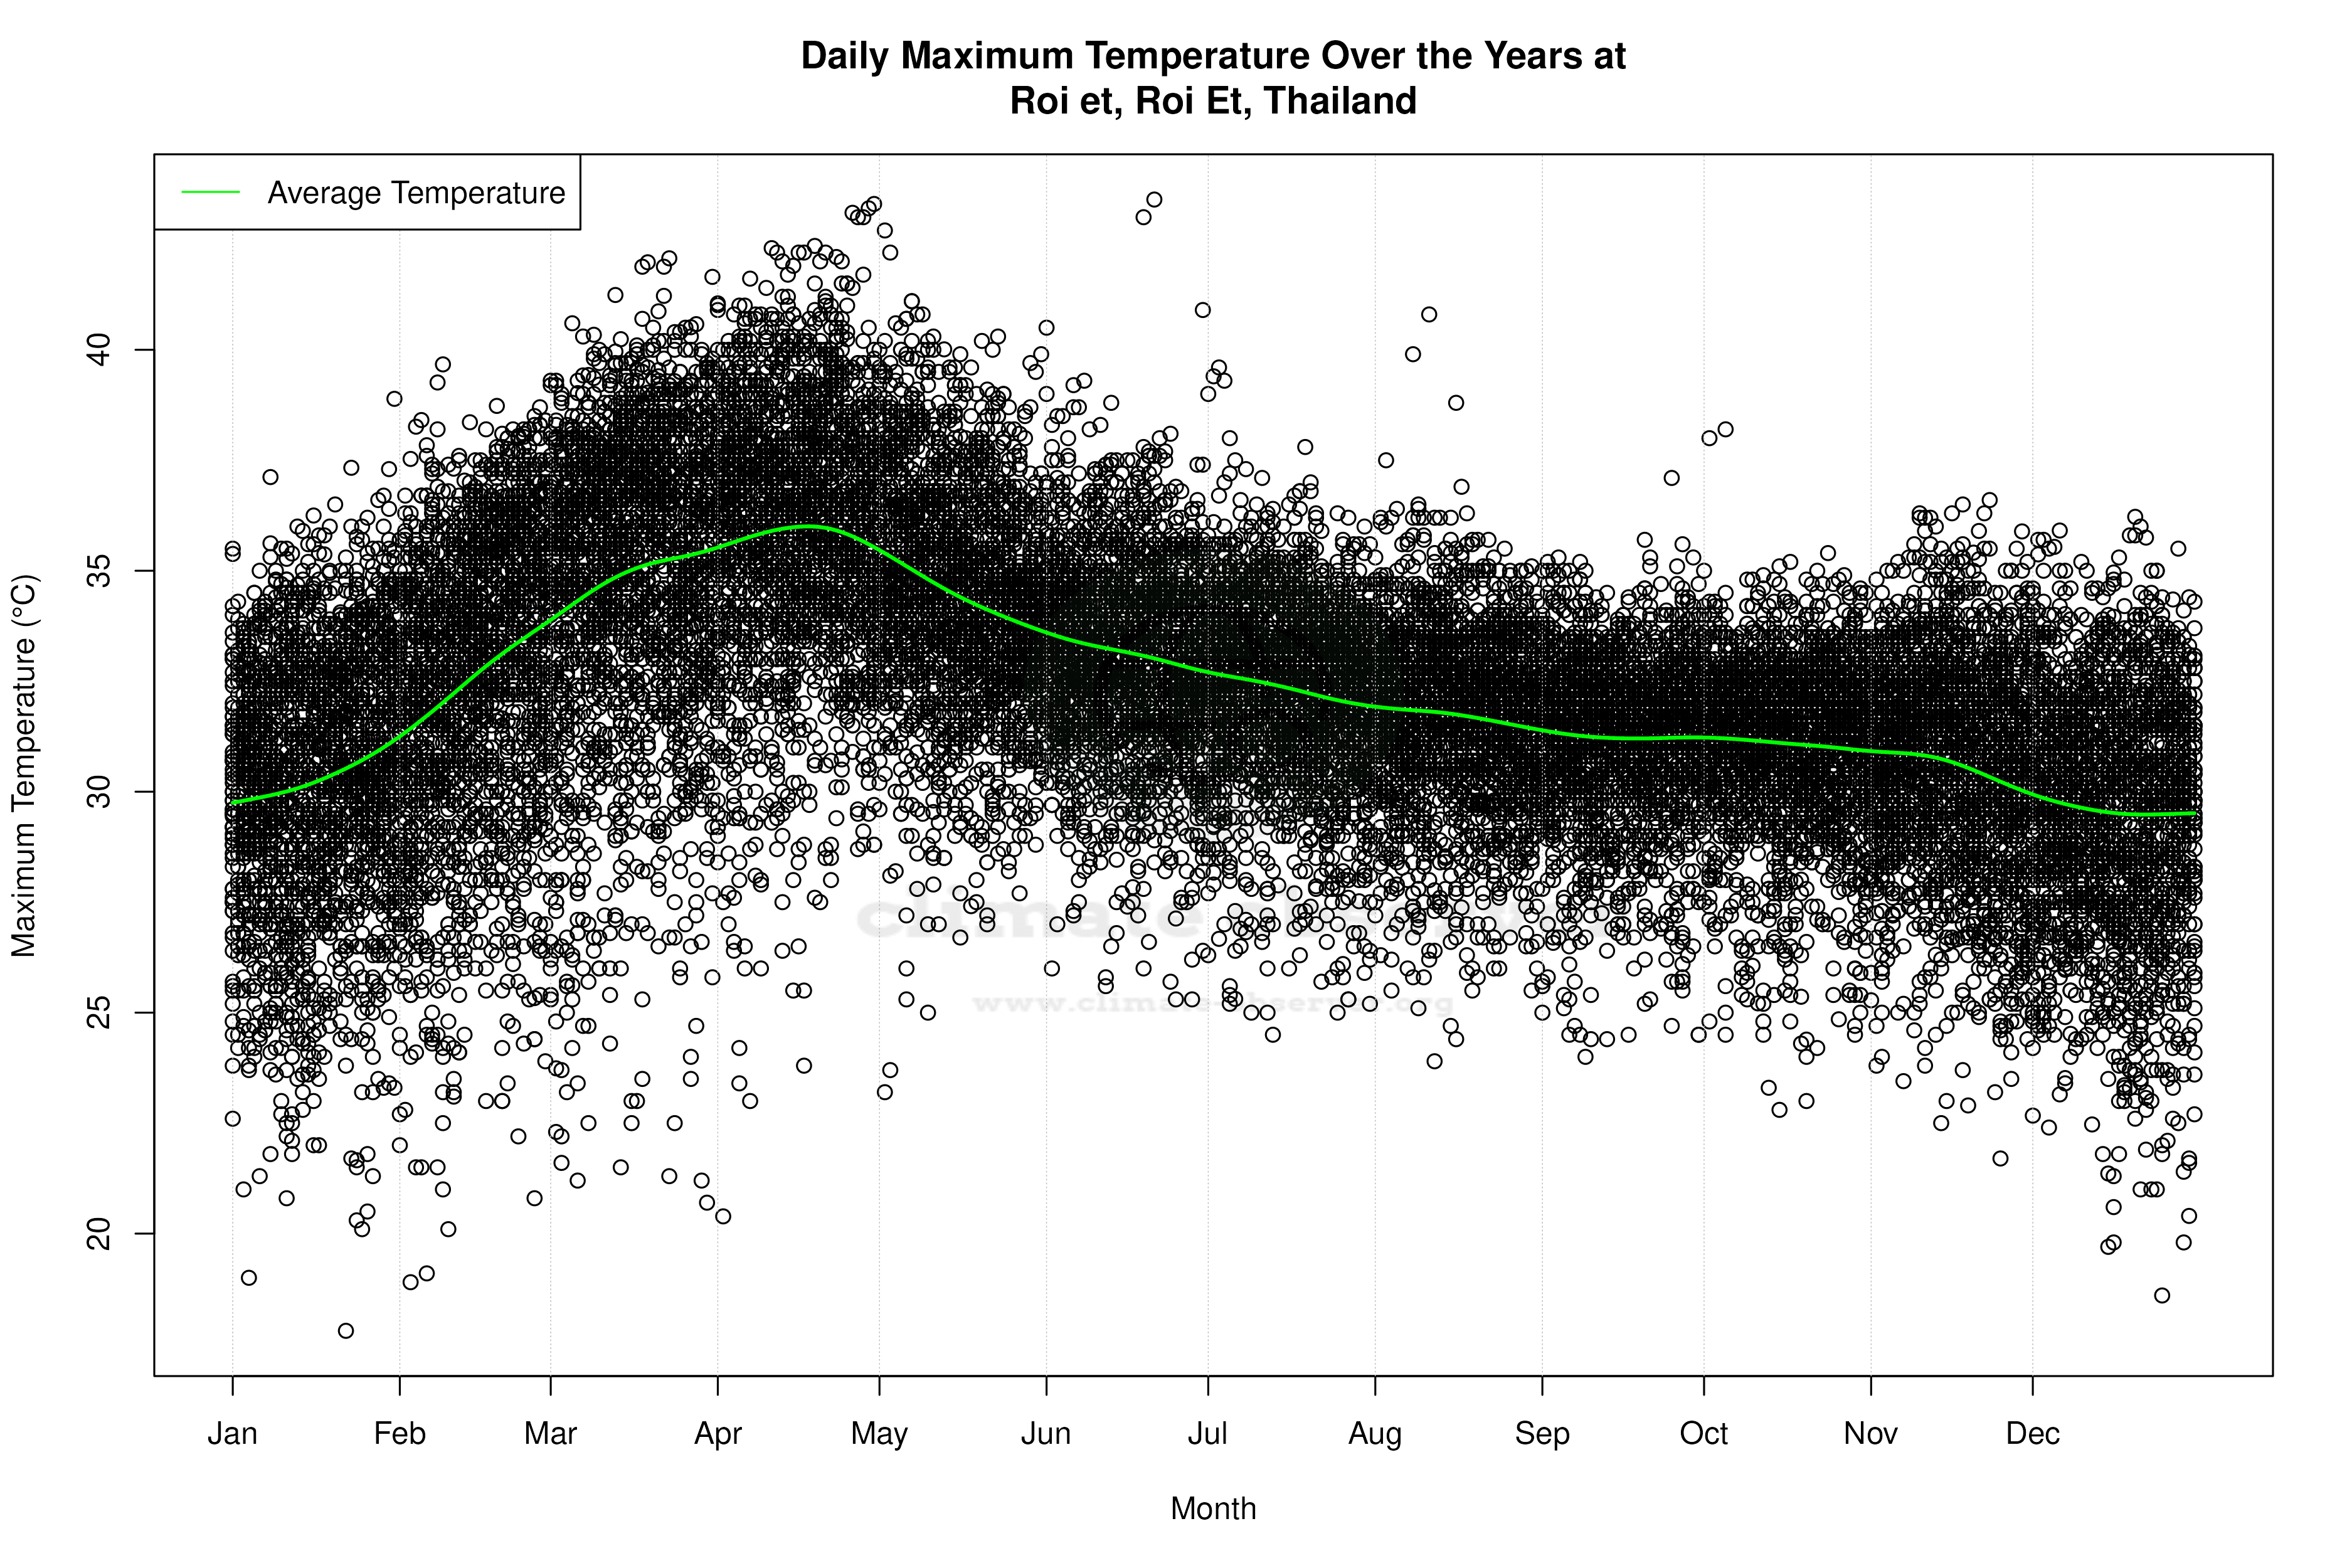


Average Max Temperature Throughout Year | 1 of 5
