Climate for Station: Bangkok Metropolis, Bangkok, Thailand
Loading live weather...
Climate Analysis & Overview
Bangkok Metropolis is experiencing a warming trend, with notable increases in both high and low temperatures over the past decade. The city's precipitation patterns have become more evenly distributed, which could impact local water management strategies. These changes align with Thailand's broader climate goals to adapt to shifting weather patterns.
Tropical Urban Heat
Bangkok, situated at 13.733°N, 100.567°E, falls under the tropical savanna climate category, according to the Köppen classification. This urban area, with its dense infrastructure, experiences the urban heat island effect, contributing to higher temperatures. Over the past decade, the city has seen a warming trend, with high temperatures rising by 0.40°C (0.72°F) and low temperatures by 0.18°C (0.32°F). This suggests an intensifying urban heat effect, which is consistent with global urbanisation trends.
Long-term Climatic Shifts
Analysing the all-time temperature trends reveals a warming pattern, with high temperatures increasing by 0.22°C (0.40°F) and low temperatures by 0.38°C (0.68°F). This long-term data indicates a more pronounced increase in nighttime temperatures, which may affect energy consumption patterns for cooling. The record high temperature in Bangkok is 41.0°C (105.8°F), while the record low is 9.9°C (49.8°F), highlighting the city's capacity for extreme temperature variability.
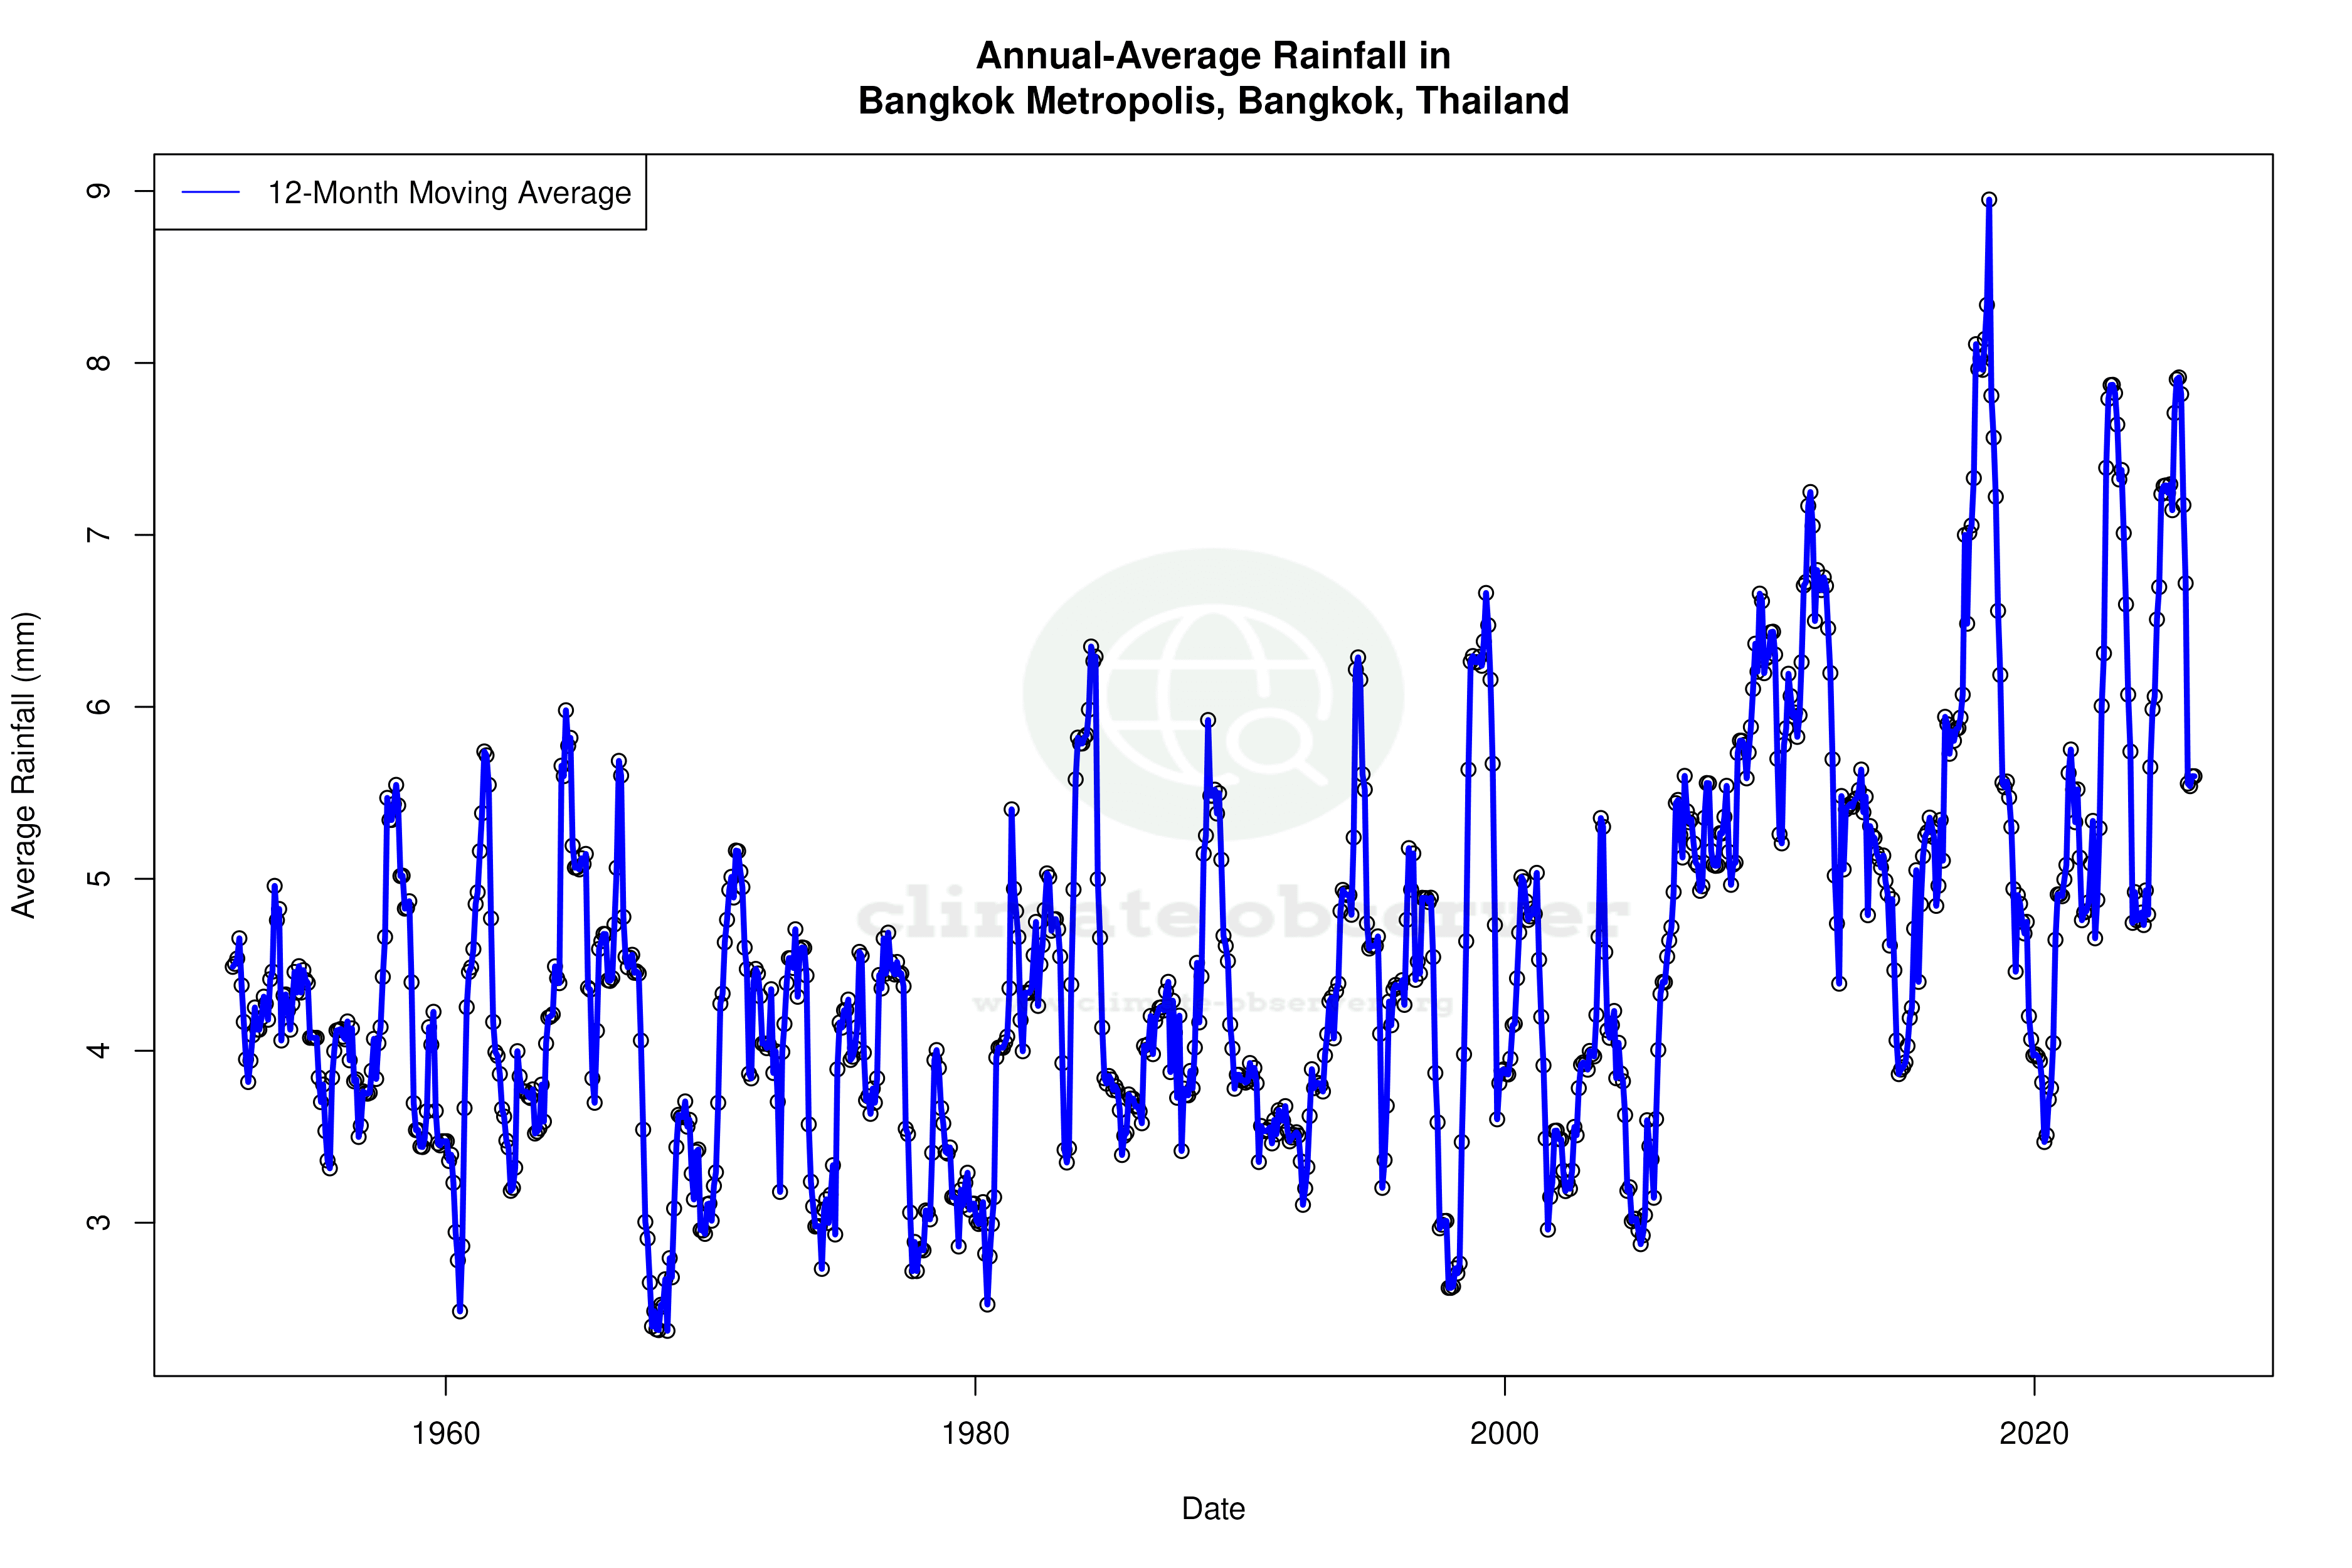
Precipitation Patterns Evolving
The Precipitation Concentration Index (PCI) for Bangkok has decreased from a baseline of 15.3 to a current value of 13.4. This indicates a more even distribution of rainfall throughout the year, which could reduce the risk of flooding during the monsoon season. Such changes are crucial for urban planning and water resource management, as they may influence infrastructure development and agricultural practices.
Regional Climate Context
Thailand's regional climate goals focus on enhancing resilience to climate change impacts. Bangkok's observed warming trends and evolving precipitation patterns align with these objectives, highlighting the importance of adaptive strategies in urban environments. Recent weather events, such as increased frequency of heatwaves, underscore the urgency of implementing these strategies to mitigate adverse effects on public health and infrastructure.
Implications for Urban Planning
The ongoing warming trends and changes in precipitation distribution necessitate a reevaluation of Bangkok's urban planning and infrastructure resilience. The city's adaptation strategies must account for the increased energy demands due to higher temperatures and the potential for altered rainfall patterns. These factors are critical as Bangkok continues to develop and expand, ensuring sustainability and livability in the face of climate change.
Station Statistics
10-Year Trend
High: +0.33 °C/decade
Low: +0.16 °C/decade
Rain: +0.03 mm/decade
25-Year Trend
High: +0.20 °C/decade
Low: +0.37 °C/decade
Rain: +0.83 mm/decade
50-Year Trend
High: +0.28 °C/decade
Low: +0.42 °C/decade
Rain: +0.47 mm/decade
All-Time Trend
High: +0.22 °C/decade
Low: +0.38 °C/decade
Rain: +0.26 mm/decade
Percentage Above-Average Days
Last 12 Months: 59.7%
This Year: 43.9%
Precipitation Concentration Index (PCI) ℹ️
Last 12 Months: 12.4
Historical Average: 15.9
Percentile Rank of Last 12 Months ℹ️
High: 73rd percentile
Low: 89th percentile
Rain: 87th percentile
Change in Variance ℹ️
High: -4.2%
Low: -42.1%
Intraday: -34.6%
Data Coverage
97.6%
First Year of Data
1943
Station Location
Historical Weather Records
| Max High | Avg High | Min High | Max Avg | Avg Avg | Min Avg | Max Low | Avg Low | Min Low | Max Precipitation | Avg Precipitation | Max Snow | Avg Snow | |
|---|---|---|---|---|---|---|---|---|---|---|---|---|---|
| Record | 41.0 °C | — | 22.2 °C | 34.5 °C | — | 16.6 °C | 31.1 °C | — | 9.9 °C | 220.0 mm | — | — | — |
| January | 37.6 °C | 32.3 °C | 24.3 °C | 31.9 °C | 26.6 °C | 18.0 °C | 27.4 °C | 21.7 °C | 9.9 °C | 39.4 mm | 0.3 mm | — | — |
| February | 38.8 °C | 33.2 °C | 26.1 °C | 31.3 °C | 28.0 °C | 21.1 °C | 28.2 °C | 23.7 °C | 13.9 °C | 73.0 mm | 0.9 mm | — | — |
| March | 40.1 °C | 34.3 °C | 24.3 °C | 32.6 °C | 29.3 °C | 20.8 °C | 29.2 °C | 25.3 °C | 14.9 °C | 52.8 mm | 1.4 mm | — | — |
| April | 40.0 °C | 35.3 °C | 25.9 °C | 33.8 °C | 30.2 °C | 23.9 °C | 30.7 °C | 26.4 °C | 18.3 °C | 133.5 mm | 3.3 mm | — | — |
| May | 41.0 °C | 34.5 °C | 27.0 °C | 34.5 °C | 29.8 °C | 24.7 °C | 31.1 °C | 26.1 °C | 20.6 °C | 185.9 mm | 7.2 mm | — | — |
| June | 38.8 °C | 33.5 °C | 27.4 °C | 32.8 °C | 29.2 °C | 25.2 °C | 29.5 °C | 25.7 °C | 21.1 °C | 167.3 mm | 5.9 mm | — | — |
| July | 38.4 °C | 33.0 °C | 25.8 °C | 33.3 °C | 28.7 °C | 24.8 °C | 29.0 °C | 25.4 °C | 21.1 °C | 116.3 mm | 6.1 mm | — | — |
| August | 38.2 °C | 32.8 °C | 26.7 °C | 32.2 °C | 28.6 °C | 24.7 °C | 29.0 °C | 25.2 °C | 21.1 °C | 129.0 mm | 7.0 mm | — | — |
| September | 37.4 °C | 32.5 °C | 24.7 °C | 31.6 °C | 28.2 °C | 24.0 °C | 28.3 °C | 24.9 °C | 21.1 °C | 157.0 mm | 11.3 mm | — | — |
| October | 37.9 °C | 32.3 °C | 24.5 °C | 31.9 °C | 28.0 °C | 22.2 °C | 28.0 °C | 24.7 °C | 18.5 °C | 220.0 mm | 9.1 mm | — | — |
| November | 38.8 °C | 32.1 °C | 22.6 °C | 32.1 °C | 27.6 °C | 20.2 °C | 28.8 °C | 23.6 °C | 13.9 °C | 81.2 mm | 1.9 mm | — | — |
| December | 37.1 °C | 31.7 °C | 22.2 °C | 31.3 °C | 26.4 °C | 16.6 °C | 27.8 °C | 21.6 °C | 10.5 °C | 32.0 mm | 0.2 mm | — | — |
Data Visualisations
Remove WatermarksCurrent Year Climate Trends vs Historical


Max Temperature this Year | 1 of 6
Climate 12-Month Moving Averages


Max Temperature 12-Month MA | 1 of 6
Daily Data Points and Averages Throughout the Year


Average Max Temperature Throughout Year | 1 of 5
