Climate for Station: Songkhla, Thailand
Loading live weather...
Climate Analysis & Overview
Songkhla, nestled in southern Thailand, is experiencing a noticeable warming trend, with a significant increase in precipitation concentration. The region's climate is shifting, reflecting broader regional patterns and challenges in managing water resources.
Tropical Climate Dynamics
Songkhla, located at coordinates 7.2, 100.617, falls under the tropical savanna climate (Aw) according to the Köppen classification. This climate is characterised by a distinct wet and dry season, influenced heavily by the monsoon winds and proximity to the Gulf of Thailand. The coastal geography moderates the temperature but also contributes to high humidity levels.
Temperature Trends: A Decade of Change
Over the past decade, Songkhla has experienced a warming trend with average high temperatures rising by 1.06°C (1.91°F) and lows by 0.53°C (0.95°F). These changes are more pronounced than the all-time trends, which show a modest rise of 0.03°C (0.05°F) for highs and 0.24°C (0.43°F) for lows. This suggests a recent acceleration in warming, possibly linked to regional climate patterns and urbanisation effects.
Precipitation Patterns: Concentration Intensifies
The Precipitation Concentration Index (PCI) for Songkhla has increased from a baseline of 13.4 to a current value of 16.9. This indicates a more concentrated rainfall pattern, where precipitation is occurring in fewer, more intense events. Such a shift can lead to challenges in water management, including increased risks of flooding and water scarcity during dry spells. While not yet at a critical level, this change underscores the need for adaptive strategies in local infrastructure and agriculture.
Extreme Weather Records
Songkhla's climate extremes are marked by a record high of 38.6°C (101.5°F) and a record low of 17.8°C (64.0°F). These records highlight the variability and potential for extreme weather events in the region. The increasing trend in temperatures may push these boundaries further, necessitating preparedness for potential heatwaves.
Regional Implications and Adaptation
Thailand's regional climate goals focus on sustainable development and resilience to climate change. Songkhla's warming and concentrated precipitation trends align with broader national patterns, reflecting the challenges posed by climate change. Recent weather events, such as intense monsoon rains, have highlighted the need for improved water management systems and urban planning to mitigate the impacts of these climatic shifts.
Station Statistics
10-Year Trend
High: +0.85 °C/decade
Low: +0.62 °C/decade
Rain: -0.41 mm/decade
25-Year Trend
High: -0.09 °C/decade
Low: +0.13 °C/decade
Rain: +0.89 mm/decade
50-Year Trend
High: +0.11 °C/decade
Low: +0.23 °C/decade
Rain: +0.50 mm/decade
All-Time Trend
High: +0.03 °C/decade
Low: +0.24 °C/decade
Rain: +0.15 mm/decade
Percentage Above-Average Days
Last 12 Months: 33.4%
This Year: 11.7%
Precipitation Concentration Index (PCI) ℹ️
Last 12 Months: 15.9
Historical Average: 16.4
Percentile Rank of Last 12 Months ℹ️
High: 18th percentile
Low: 97th percentile
Rain: 79th percentile
Change in Variance ℹ️
High: +32.0%
Low: -18.1%
Intraday: +11.0%
Data Coverage
95.6%
First Year of Data
1943
Station Location
Historical Weather Records
| Max High | Avg High | Min High | Max Avg | Avg Avg | Min Avg | Max Low | Avg Low | Min Low | Max Precipitation | Avg Precipitation | Max Snow | Avg Snow | |
|---|---|---|---|---|---|---|---|---|---|---|---|---|---|
| Record | 38.6 °C | — | 23.7 °C | 33.1 °C | — | 22.4 °C | 29.2 °C | — | 17.8 °C | 390.9 mm | — | — | — |
| January | 34.0 °C | 29.6 °C | 25.4 °C | 30.6 °C | 27.2 °C | 23.0 °C | 27.6 °C | 24.3 °C | 19.1 °C | 159.2 mm | 3.7 mm | — | — |
| February | 34.3 °C | 30.3 °C | 26.4 °C | 30.2 °C | 27.6 °C | 24.2 °C | 27.8 °C | 24.3 °C | 19.3 °C | 91.9 mm | 1.5 mm | — | — |
| March | 36.5 °C | 31.3 °C | 26.5 °C | 31.4 °C | 28.3 °C | 24.4 °C | 28.4 °C | 24.5 °C | 17.8 °C | 128.6 mm | 2.0 mm | — | — |
| April | 37.5 °C | 32.5 °C | 27.0 °C | 32.0 °C | 29.0 °C | 24.4 °C | 29.2 °C | 24.9 °C | 20.6 °C | 84.9 mm | 3.0 mm | — | — |
| May | 38.6 °C | 33.1 °C | 26.9 °C | 32.4 °C | 29.0 °C | 24.7 °C | 29.2 °C | 25.1 °C | 21.8 °C | 116.1 mm | 4.3 mm | — | — |
| June | 37.5 °C | 33.0 °C | 26.4 °C | 33.1 °C | 28.7 °C | 24.6 °C | 28.8 °C | 24.7 °C | 20.0 °C | 103.9 mm | 3.9 mm | — | — |
| July | 37.2 °C | 32.8 °C | 25.4 °C | 31.7 °C | 28.5 °C | 23.3 °C | 28.3 °C | 24.4 °C | 20.6 °C | 94.7 mm | 3.6 mm | — | — |
| August | 37.3 °C | 32.8 °C | 25.7 °C | 31.8 °C | 28.4 °C | 24.1 °C | 27.7 °C | 24.3 °C | 19.2 °C | 99.3 mm | 4.1 mm | — | — |
| September | 36.2 °C | 32.3 °C | 25.5 °C | 31.8 °C | 28.0 °C | 24.3 °C | 27.8 °C | 24.2 °C | 21.0 °C | 110.2 mm | 4.6 mm | — | — |
| October | 36.7 °C | 31.1 °C | 24.4 °C | 31.0 °C | 27.5 °C | 23.3 °C | 27.7 °C | 24.1 °C | 20.7 °C | 210.4 mm | 9.1 mm | — | — |
| November | 37.4 °C | 29.7 °C | 23.7 °C | 30.0 °C | 27.0 °C | 22.4 °C | 27.6 °C | 24.2 °C | 19.9 °C | 390.9 mm | 18.7 mm | — | — |
| December | 33.4 °C | 29.2 °C | 24.0 °C | 29.7 °C | 26.8 °C | 22.5 °C | 27.9 °C | 24.2 °C | 20.0 °C | 288.0 mm | 13.5 mm | — | — |
Data Visualisations
Remove WatermarksCurrent Year Climate Trends vs Historical


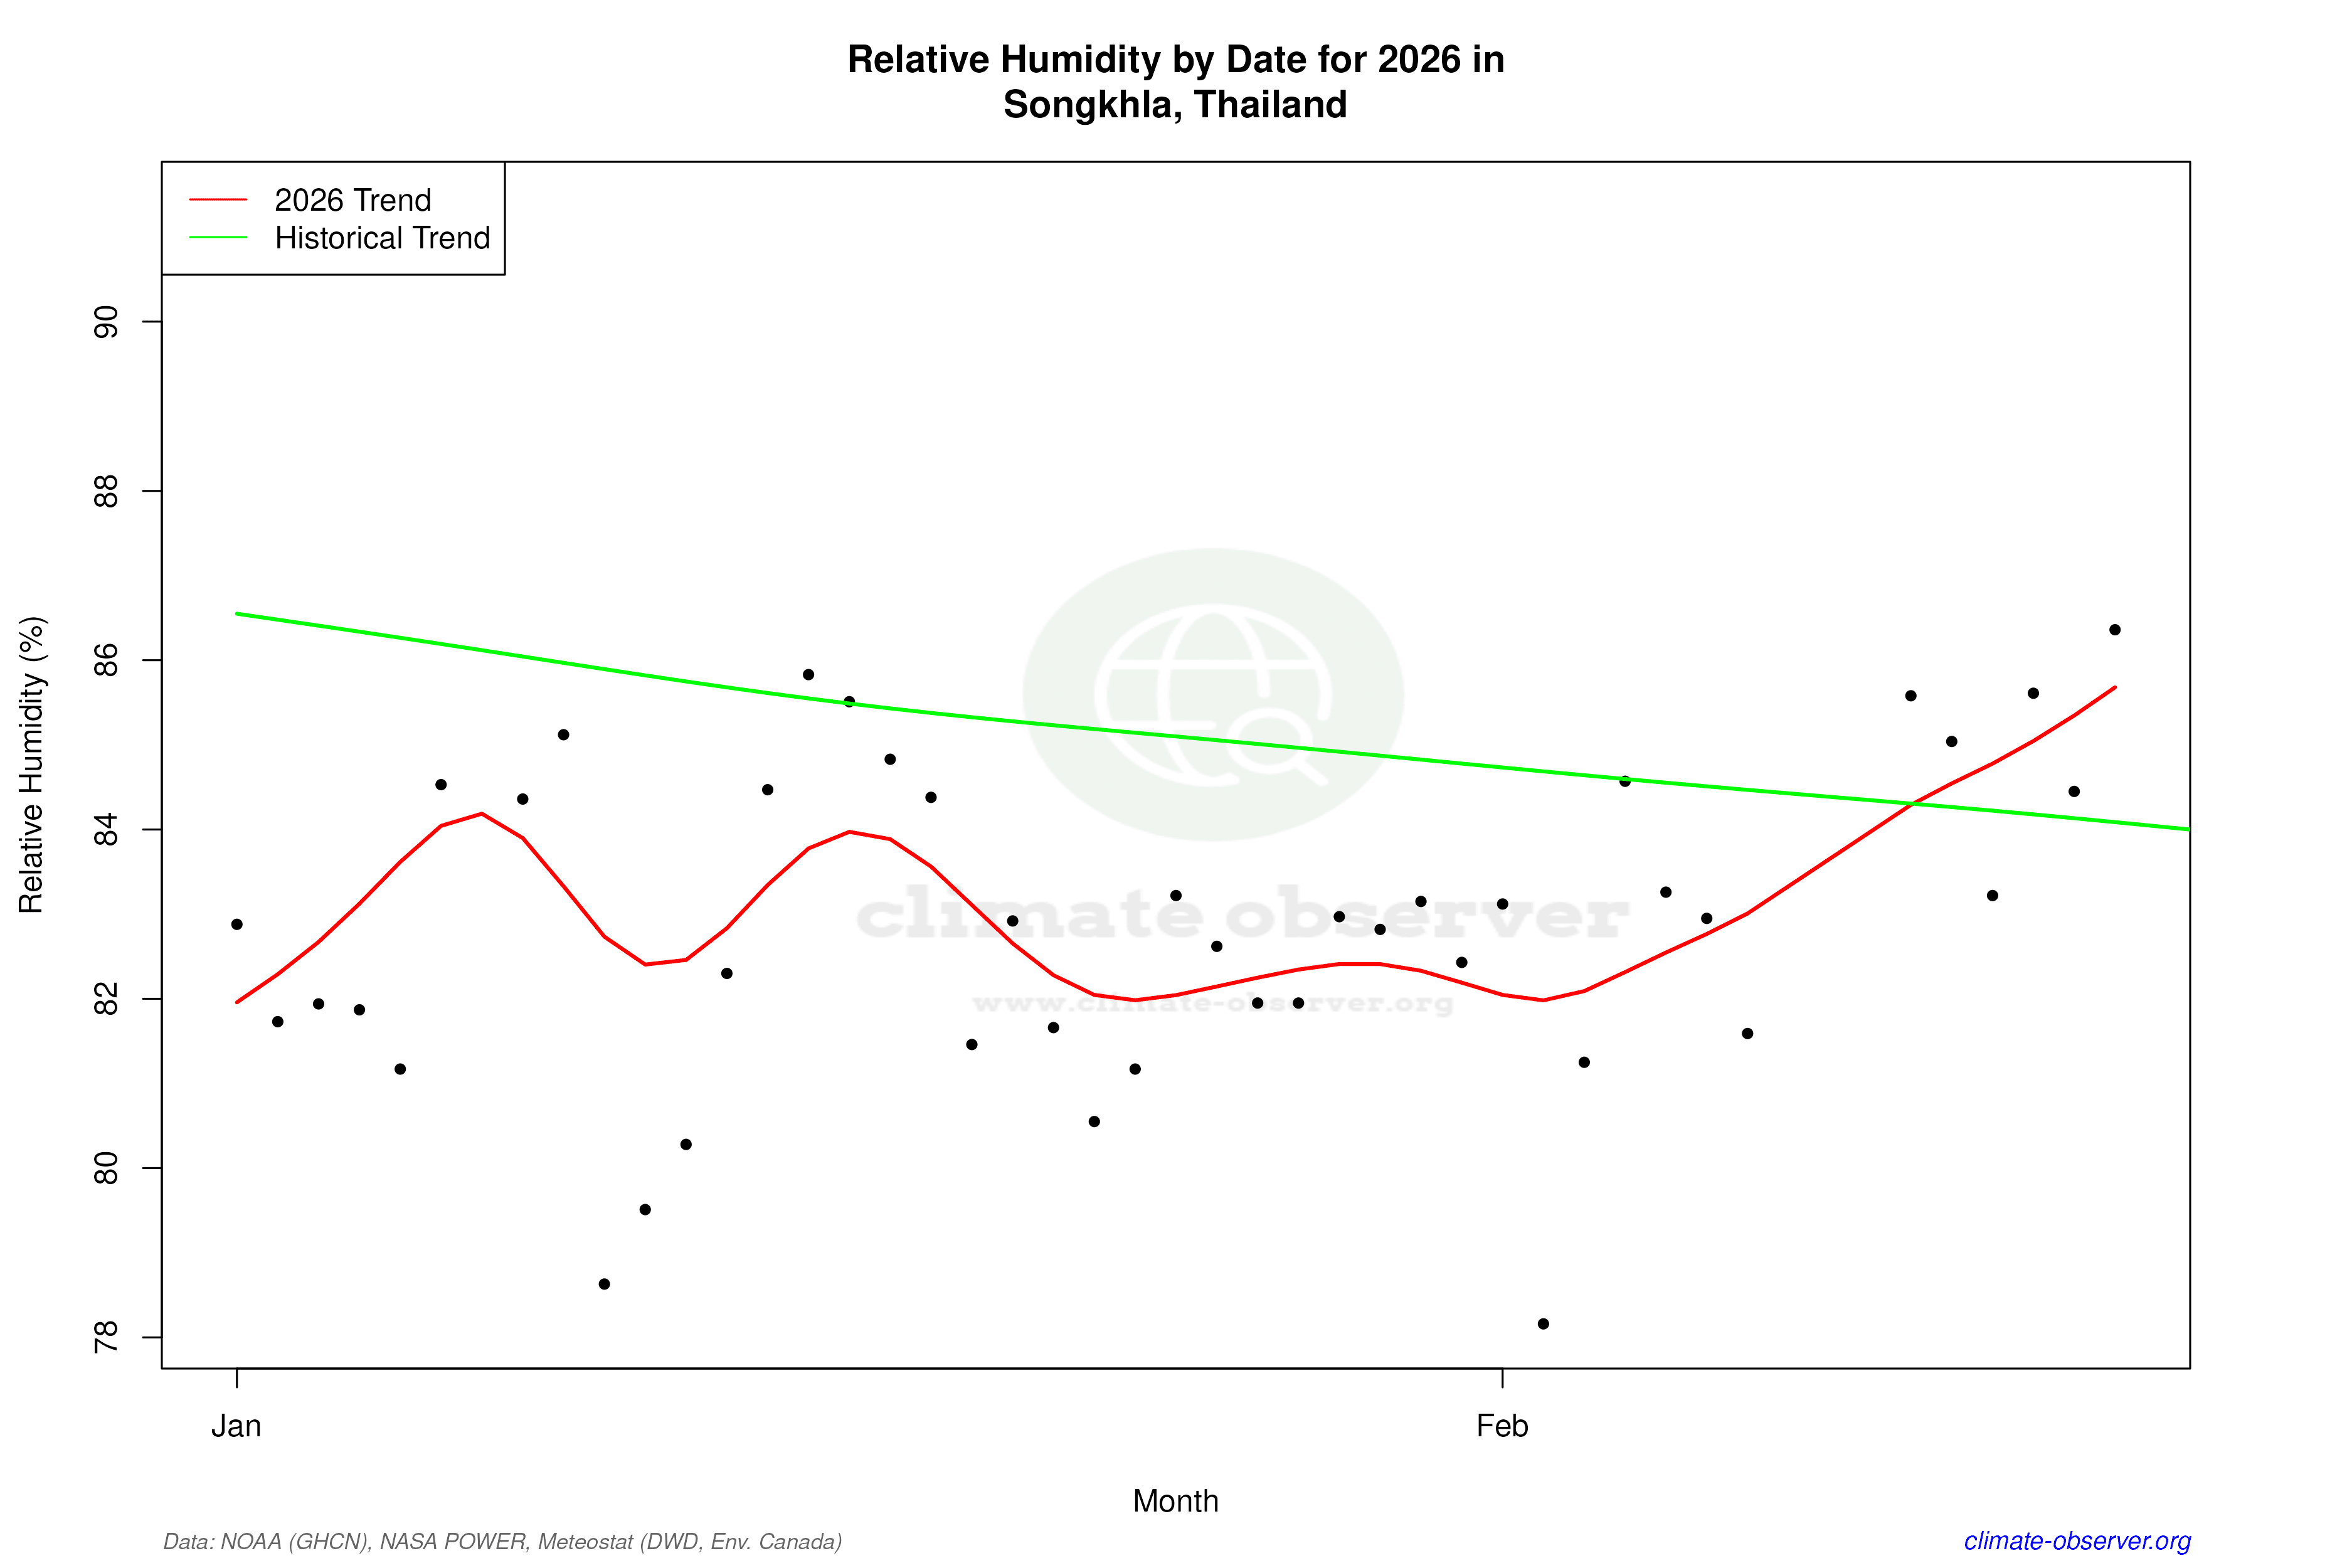

Max Temperature this Year | 1 of 6
Climate 12-Month Moving Averages


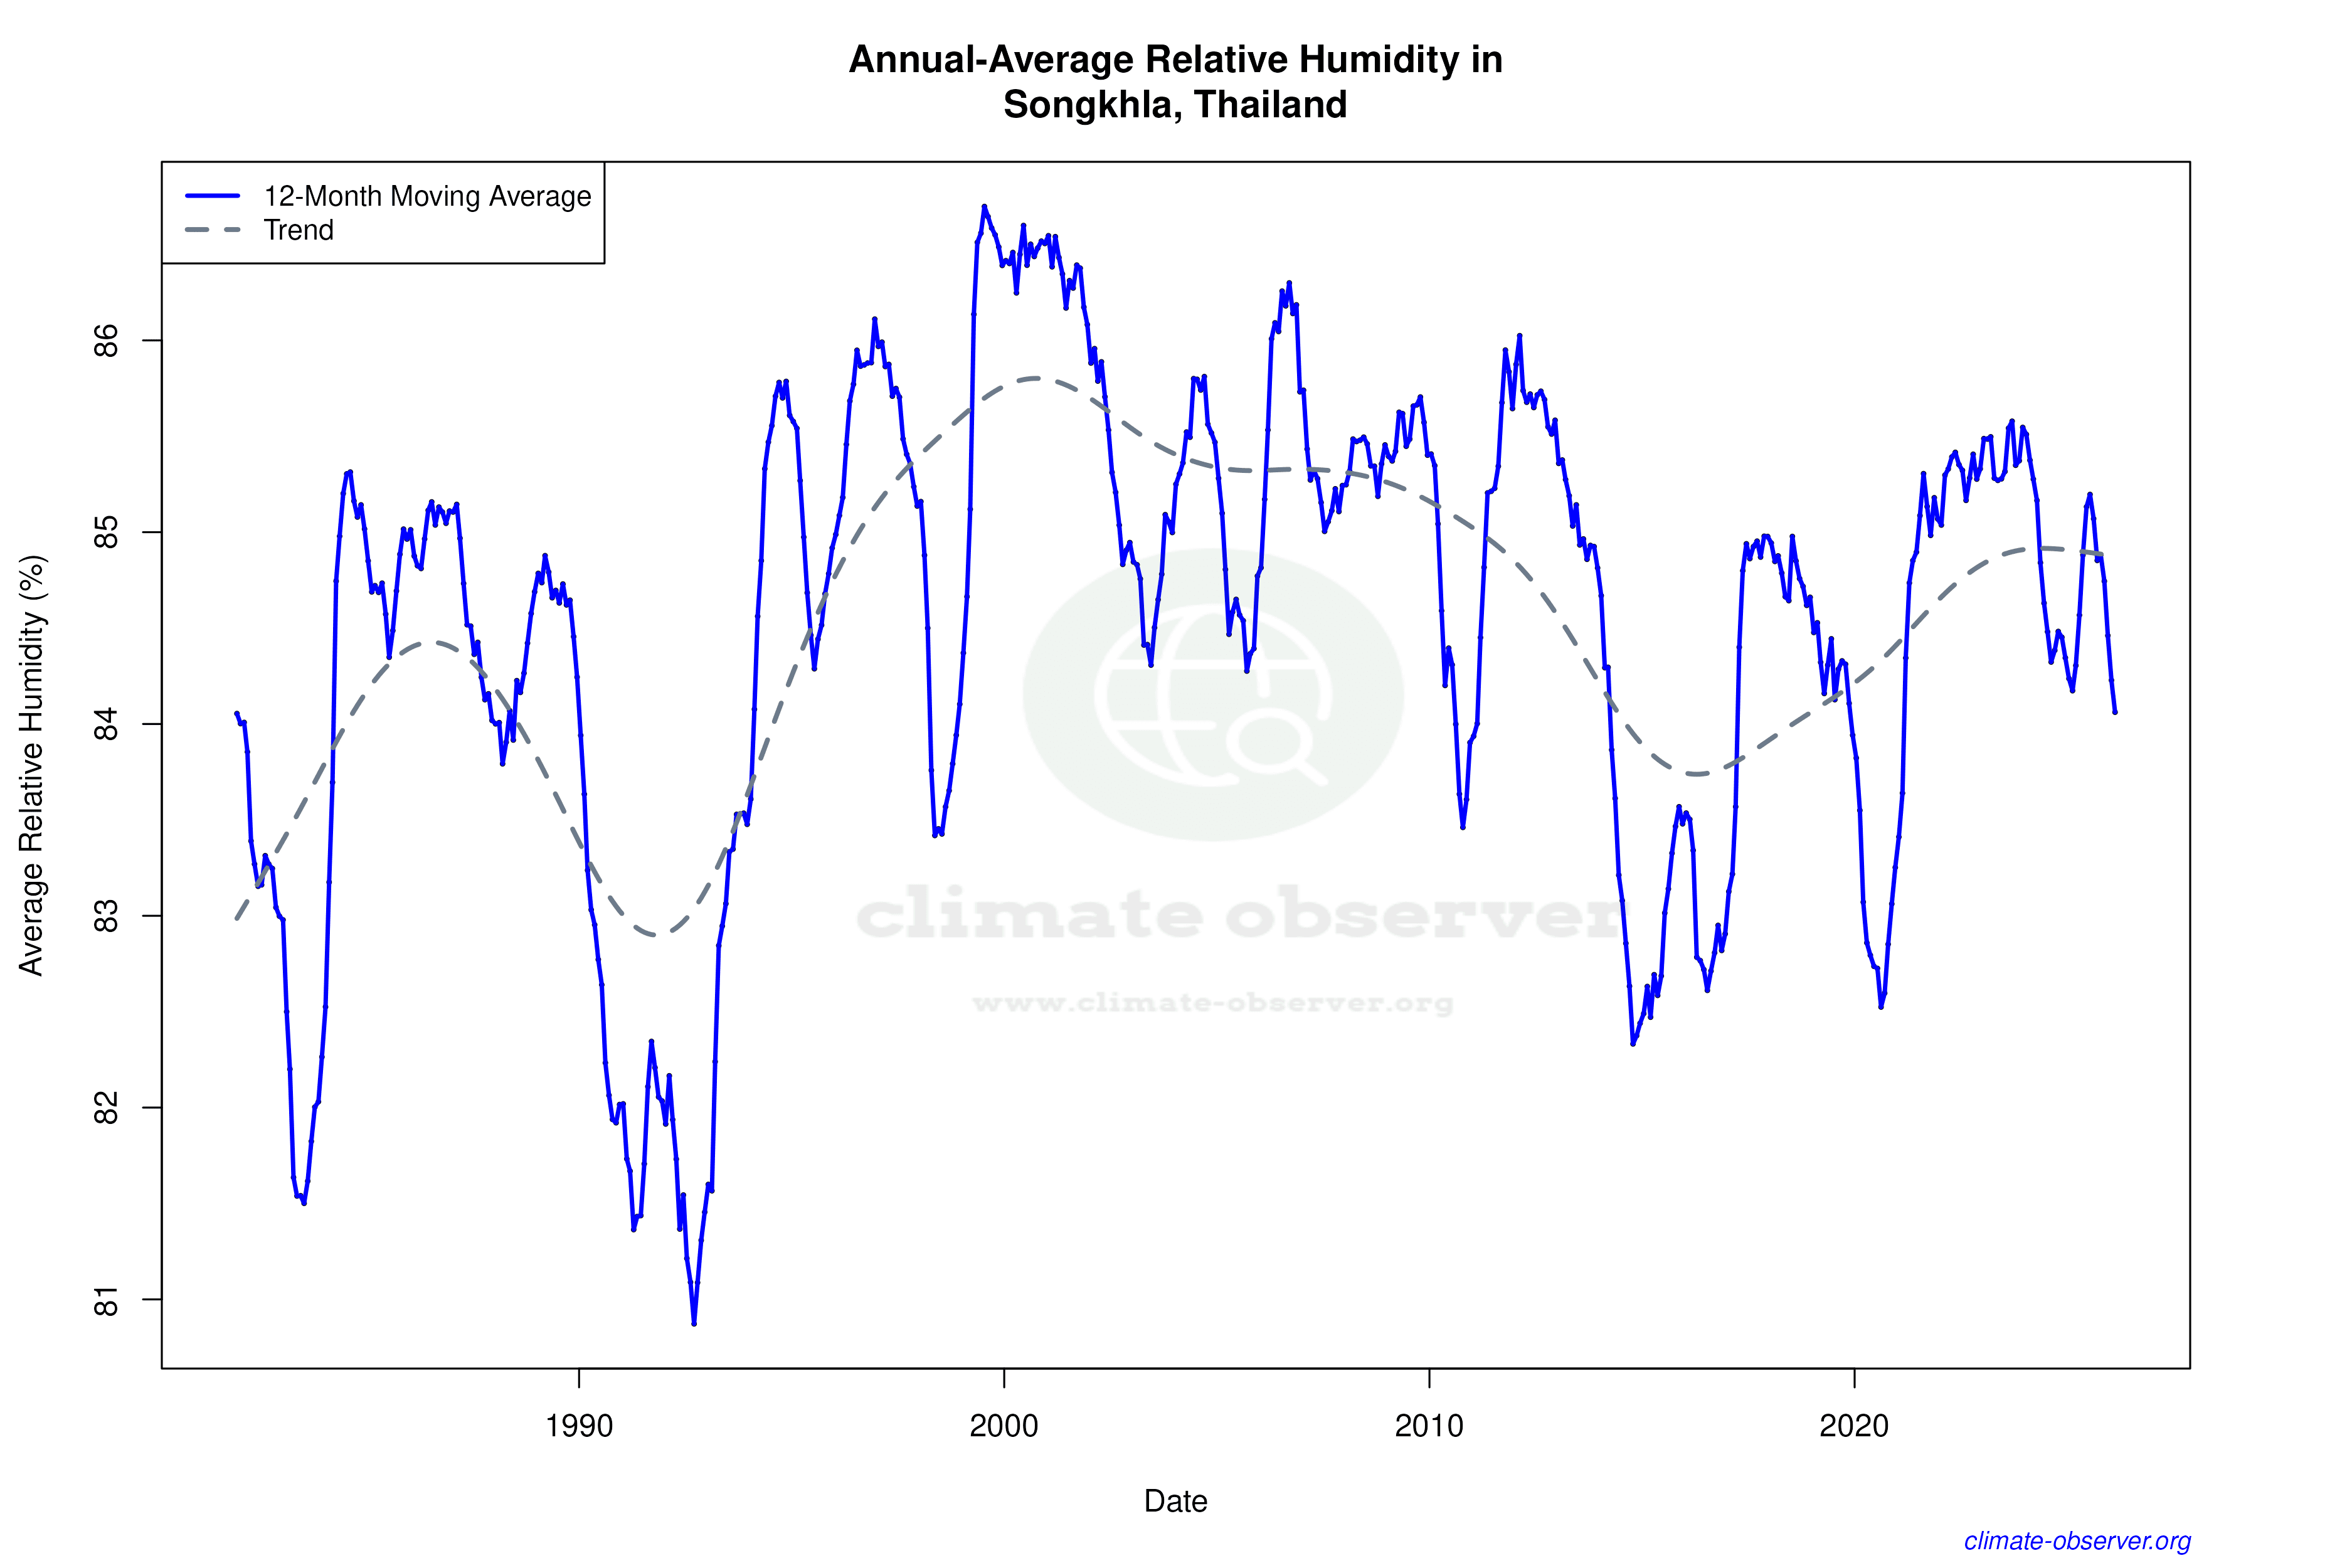

Max Temperature 12-Month MA | 1 of 6
Daily Data Points and Averages Throughout the Year


Average Max Temperature Throughout Year | 1 of 5
