Climate for Station: Dushanbe, Tajikistan
Loading live weather...
Climate Analysis & Overview
Dushanbe, nestled in the heart of Tajikistan, exhibits a complex climate narrative shaped by its unique geography. While long-term warming trends are evident, recent data reveals contrasting short-term cooling in high temperatures alongside significant warming in low temperatures, suggesting a dynamic thermal profile. Precipitation patterns have become slightly more concentrated, indicating shifts in weather extremes.
Mountainous Climate Dynamics
Dushanbe, the capital of Tajikistan, is situated at the foothills of the Pamir Mountains, a region characterised by its continental climate, classified under the Köppen system as Dsa—hot, dry summers and cold, snowy winters. The city's elevation and proximity to mountainous terrain significantly influence its weather patterns, contributing to marked seasonal temperature variations.
Thermal Trends: A Mixed Picture
The long-term temperature trends for Dushanbe reveal a warming pattern, with all-time high temperatures increasing by 0.20°C (0.36°F). However, the past decade presents a more nuanced picture. High temperatures have shown a slight cooling trend, decreasing by 0.13°C (0.23°F), while low temperatures have surged by 3.64°C (6.55°F). This divergence suggests a narrowing diurnal temperature range, potentially impacting local agriculture and energy consumption patterns.
Precipitation Patterns: Slight Intensification
The Precipitation Concentration Index (PCI) for Dushanbe has seen a marginal increase from a baseline of 17.16 to a current value of 17.88. This indicates a slight intensification in precipitation events, meaning that rainfall is becoming more concentrated in fewer, heavier events. Such changes can lead to increased risks of flash floods and soil erosion, challenging the city's infrastructure resilience.
Extreme Temperature Records
Dushanbe's historical temperature records underscore the extremes inherent in its climate. The highest recorded temperature is a scorching 49.0°C (120.2°F), while the lowest plummeted to -23.6°C (-10.5°F). These extremes highlight the city's vulnerability to both heatwaves and severe cold spells, necessitating adaptive strategies in urban planning and public health.
Regional Climate Goals and Challenges
Tajikistan is actively pursuing regional climate goals, focusing on sustainable water management and renewable energy development. The observed climatic shifts in Dushanbe, including the recent warming of low temperatures and changes in precipitation patterns, align with broader regional climate challenges. These trends demand adaptive measures to mitigate potential impacts on water resources, agriculture, and urban infrastructure.
Station Statistics
10-Year Trend
High: -0.08 °C/decade
Low: +3.75 °C/decade
Rain: -0.10 mm/decade
25-Year Trend
High: +0.87 °C/decade
Low: +0.87 °C/decade
Rain: +0.36 mm/decade
50-Year Trend
High: +0.49 °C/decade
Low: +0.16 °C/decade
Rain: -0.13 mm/decade
All-Time Trend
High: +0.21 °C/decade
Low: +0.15 °C/decade
Rain: -0.06 mm/decade
Percentage Above-Average Days
Last 12 Months: 58.6%
This Year: 65.0%
Precipitation Concentration Index (PCI) ℹ️
Last 12 Months: 16.1
Historical Average: 17.5
Percentile Rank of Last 12 Months ℹ️
High: 81st percentile
Low: 96th percentile
Rain: 30th percentile
Change in Variance ℹ️
High: -2.7%
Low: -1.3%
Intraday: +1.9%
Data Coverage
99.4%
First Year of Data
1927
Station Location
Historical Weather Records
| Max High | Avg High | Min High | Max Avg | Avg Avg | Min Avg | Max Low | Avg Low | Min Low | Max Precipitation | Avg Precipitation | Max Snow | Avg Snow | |
|---|---|---|---|---|---|---|---|---|---|---|---|---|---|
| Record | 49.0 °C | — | -13.9 °C | 36.4 °C | — | -19.2 °C | 27.4 °C | — | -26.6 °C | 99.3 mm | — | — | — |
| January | 21.8 °C | 8.0 °C | -13.9 °C | 13.5 °C | 2.2 °C | -19.2 °C | 10.4 °C | -2.2 °C | -26.6 °C | 50.2 mm | 2.1 mm | — | — |
| February | 27.7 °C | 10.3 °C | -9.0 °C | 17.4 °C | 4.4 °C | -13.6 °C | 11.4 °C | -0.2 °C | -17.6 °C | 45.4 mm | 2.7 mm | — | — |
| March | 32.2 °C | 15.5 °C | -4.8 °C | 23.4 °C | 9.4 °C | -8.6 °C | 15.7 °C | 4.2 °C | -13.4 °C | 99.3 mm | 3.7 mm | — | — |
| April | 36.2 °C | 22.1 °C | 2.5 °C | 30.2 °C | 15.5 °C | -0.1 °C | 19.0 °C | 9.3 °C | -2.7 °C | 83.3 mm | 3.4 mm | — | — |
| May | 38.8 °C | 27.2 °C | 8.0 °C | 31.0 °C | 20.1 °C | 5.1 °C | 23.0 °C | 13.1 °C | -0.0 °C | 81.9 mm | 2.2 mm | — | — |
| June | 44.1 °C | 33.0 °C | 15.5 °C | 34.8 °C | 25.2 °C | 11.8 °C | 26.0 °C | 16.7 °C | 8.4 °C | 49.1 mm | 0.4 mm | — | — |
| July | 49.0 °C | 36.2 °C | 24.1 °C | 36.4 °C | 27.9 °C | 17.4 °C | 27.4 °C | 18.7 °C | 10.9 °C | 14.2 mm | 0.1 mm | — | — |
| August | 45.0 °C | 35.1 °C | 22.2 °C | 35.3 °C | 26.0 °C | 17.3 °C | 27.0 °C | 16.8 °C | 8.1 °C | 29.8 mm | 0.0 mm | — | — |
| September | 39.7 °C | 30.8 °C | 13.8 °C | 31.9 °C | 21.0 °C | 10.0 °C | 23.4 °C | 12.1 °C | 3.0 °C | 9.7 mm | 0.1 mm | — | — |
| October | 36.8 °C | 23.9 °C | 0.9 °C | 27.7 °C | 14.7 °C | -0.3 °C | 19.0 °C | 7.3 °C | -4.4 °C | 42.5 mm | 0.8 mm | — | — |
| November | 31.9 °C | 16.5 °C | -3.0 °C | 21.4 °C | 8.9 °C | -8.8 °C | 16.0 °C | 3.2 °C | -15.0 °C | 39.7 mm | 1.6 mm | — | — |
| December | 24.5 °C | 10.4 °C | -10.2 °C | 17.6 °C | 4.3 °C | -13.5 °C | 12.5 °C | -0.1 °C | -19.5 °C | 42.8 mm | 1.9 mm | — | — |
Data Visualisations
Remove WatermarksCurrent Year Climate Trends vs Historical


Max Temperature this Year | 1 of 6
Climate 12-Month Moving Averages


Max Temperature 12-Month MA | 1 of 6
Daily Data Points and Averages Throughout the Year


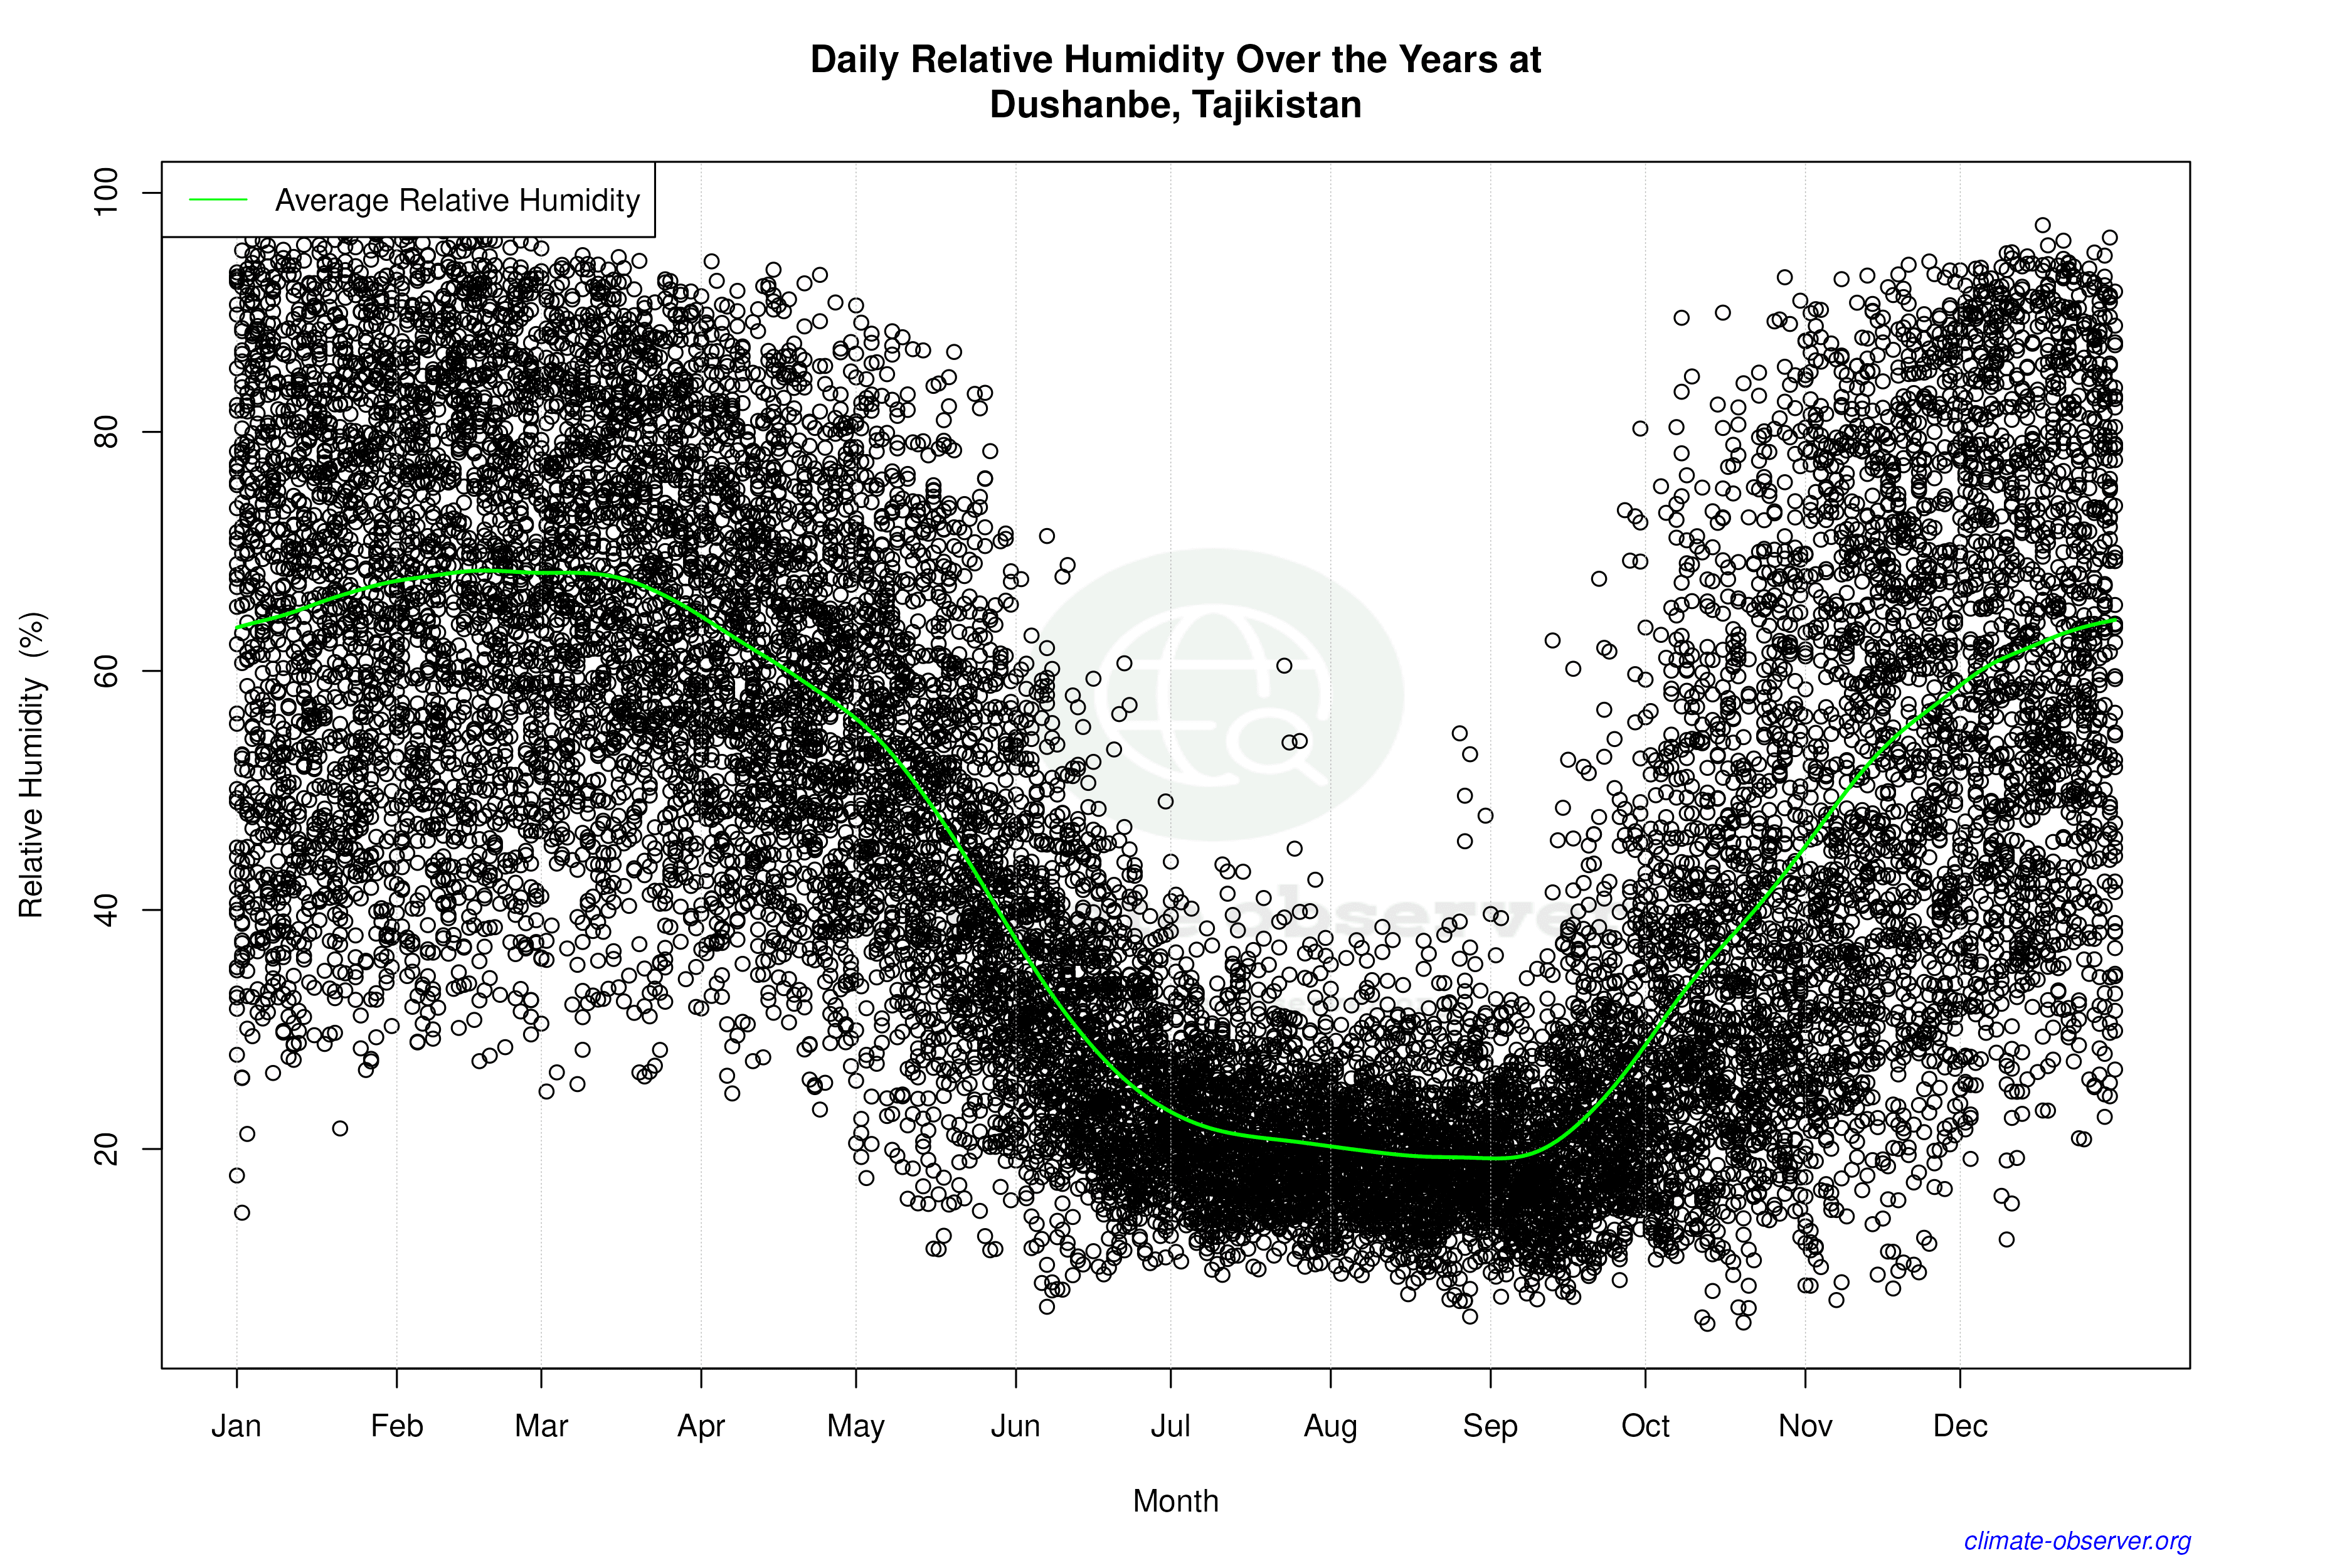

Average Max Temperature Throughout Year | 1 of 5
