Climate for Station: Cet Central England, England, United Kingdom
Loading live weather...
Climate Analysis & Overview
Central England is experiencing a warming trend, with both high and low temperatures rising over the past decade. Precipitation is becoming slightly more concentrated, suggesting changes in rainfall patterns. These shifts are crucial as the UK aims for climate resilience.
Gradual Warming in Central England
Located in the West Midlands, Central England, specifically around Solihull, experiences a temperate maritime climate, classified as Cfb under the Köppen climate classification. This region is characterized by mild summers and cool winters, influenced by its inland position away from moderating coastal effects. Over the all-time record, the area has seen a warming trend with high temperatures increasing by 0.11°C (0.20°F) and lows by 0.09°C (0.17°F). This gradual rise aligns with broader UK climate goals to monitor and adapt to temperature changes as part of its sustainability initiatives.
Decadal Temperature Shifts
In the last decade, the warming trend has accelerated. High temperatures have increased by 0.79°C (1.42°F), while low temperatures have risen by 0.65°C (1.17°F). These changes suggest a more pronounced warming pattern compared to the all-time trends, indicating a potential shift in seasonal temperature dynamics. This could impact local agriculture and energy consumption, necessitating adaptive strategies in line with the UK's climate action plans.
Precipitation Patterns and PCI Insights
The Precipitation Concentration Index (PCI) for Central England has shown a slight increase from a baseline of 10.84 to a current value of 11.16. This marginal rise indicates that precipitation events are becoming slightly more concentrated, occurring in fewer, more intense episodes. While not yet at the level of high concentration, this shift could affect water management and flood prevention strategies in the region, underscoring the importance of ongoing monitoring.
Record Extremes and Implications
Central England has recorded a maximum temperature of 36.0°C (96.8°F) and a minimum of -15.9°C (3.4°F). These extremes highlight the variability within the region's climate, which can pose challenges to infrastructure and public health. As the UK experiences more frequent extreme weather events, understanding these records is vital for developing resilience measures.
Regional Climate Context
The West Midlands' geography, with its rolling hills and river systems, plays a role in its climate patterns. The area's topography can influence local weather, contributing to microclimatic variations. As the UK works towards reducing carbon emissions and enhancing climate resilience, understanding these localised trends is crucial for informed policy-making and community preparedness.
Station Statistics
10-Year Trend
High: +0.76 °C/decade
Low: +0.71 °C/decade
Rain: +0.06 mm/decade
25-Year Trend
High: +0.35 °C/decade
Low: +0.21 °C/decade
Rain: +0.04 mm/decade
50-Year Trend
High: +0.35 °C/decade
Low: +0.24 °C/decade
Rain: +0.03 mm/decade
All-Time Trend
High: +0.11 °C/decade
Low: +0.09 °C/decade
Rain: +0.03 mm/decade
Percentage Above-Average Days
Last 12 Months: 55.9%
This Year: 63.6%
Precipitation Concentration Index (PCI) ℹ️
Last 12 Months: 10.6
Historical Average: 10.1
Percentile Rank of Last 12 Months ℹ️
High: 99th percentile
Low: 98th percentile
Rain: 44th percentile
Change in Variance ℹ️
High: +1.0%
Low: -0.7%
Intraday: +14.9%
Data Coverage
66.7%
First Year of Data
1880
Station Location
Historical Weather Records
| Max High | Avg High | Min High | Max Avg | Avg Avg | Min Avg | Max Low | Avg Low | Min Low | Max Precipitation | Avg Precipitation | Max Snow | Avg Snow | |
|---|---|---|---|---|---|---|---|---|---|---|---|---|---|
| Record | 36.0 °C | — | -5.6 °C | 27.8 °C | — | -14.3 °C | 19.4 °C | — | -15.9 °C | 51.0 mm | — | — | — |
| January | 14.0 °C | 6.7 °C | -5.6 °C | 12.8 °C | 4.1 °C | -14.3 °C | 10.9 °C | 1.2 °C | -13.4 °C | 21.6 mm | 2.2 mm | — | — |
| February | 18.4 °C | 7.2 °C | -4.4 °C | 13.5 °C | 4.4 °C | -6.2 °C | 11.1 °C | 1.3 °C | -13.6 °C | 24.4 mm | 1.8 mm | — | — |
| March | 22.1 °C | 9.6 °C | -0.7 °C | 15.1 °C | 6.2 °C | -4.0 °C | 11.2 °C | 2.3 °C | -9.5 °C | 22.8 mm | 1.8 mm | — | — |
| April | 25.4 °C | 12.5 °C | 2.3 °C | 18.4 °C | 8.3 °C | 0.3 °C | 12.3 °C | 4.0 °C | -5.1 °C | 24.5 mm | 1.7 mm | — | — |
| May | 29.7 °C | 16.1 °C | 6.2 °C | 22.6 °C | 11.6 °C | 3.1 °C | 15.8 °C | 6.8 °C | -1.5 °C | 30.2 mm | 1.9 mm | — | — |
| June | 32.7 °C | 19.0 °C | 10.3 °C | 24.8 °C | 14.7 °C | 6.8 °C | 18.0 °C | 9.8 °C | 1.2 °C | 32.1 mm | 2.1 mm | — | — |
| July | 36.0 °C | 20.7 °C | 12.7 °C | 27.8 °C | 16.7 °C | 11.0 °C | 19.4 °C | 11.7 °C | 4.7 °C | 51.0 mm | 2.0 mm | — | — |
| August | 33.2 °C | 20.1 °C | 12.2 °C | 26.7 °C | 16.3 °C | 10.5 °C | 18.7 °C | 11.5 °C | 3.8 °C | 44.1 mm | 2.1 mm | — | — |
| September | 29.8 °C | 17.6 °C | 8.5 °C | 22.8 °C | 13.7 °C | 5.9 °C | 18.4 °C | 9.6 °C | 0.1 °C | 29.7 mm | 2.1 mm | — | — |
| October | 25.5 °C | 13.5 °C | 3.1 °C | 20.2 °C | 10.4 °C | 0.7 °C | 17.0 °C | 6.8 °C | -4.0 °C | 33.5 mm | 2.5 mm | — | — |
| November | 18.7 °C | 9.5 °C | -1.0 °C | 15.2 °C | 6.9 °C | -6.4 °C | 13.5 °C | 3.7 °C | -8.9 °C | 44.5 mm | 2.4 mm | — | — |
| December | 15.3 °C | 7.3 °C | -3.9 °C | 14.0 °C | 4.9 °C | -8.5 °C | 11.8 °C | 1.9 °C | -15.9 °C | 24.6 mm | 2.4 mm | — | — |
Data Visualisations
Remove WatermarksCurrent Year Climate Trends vs Historical


Max Temperature this Year | 1 of 6
Climate 12-Month Moving Averages


Max Temperature 12-Month MA | 1 of 6
Daily Data Points and Averages Throughout the Year

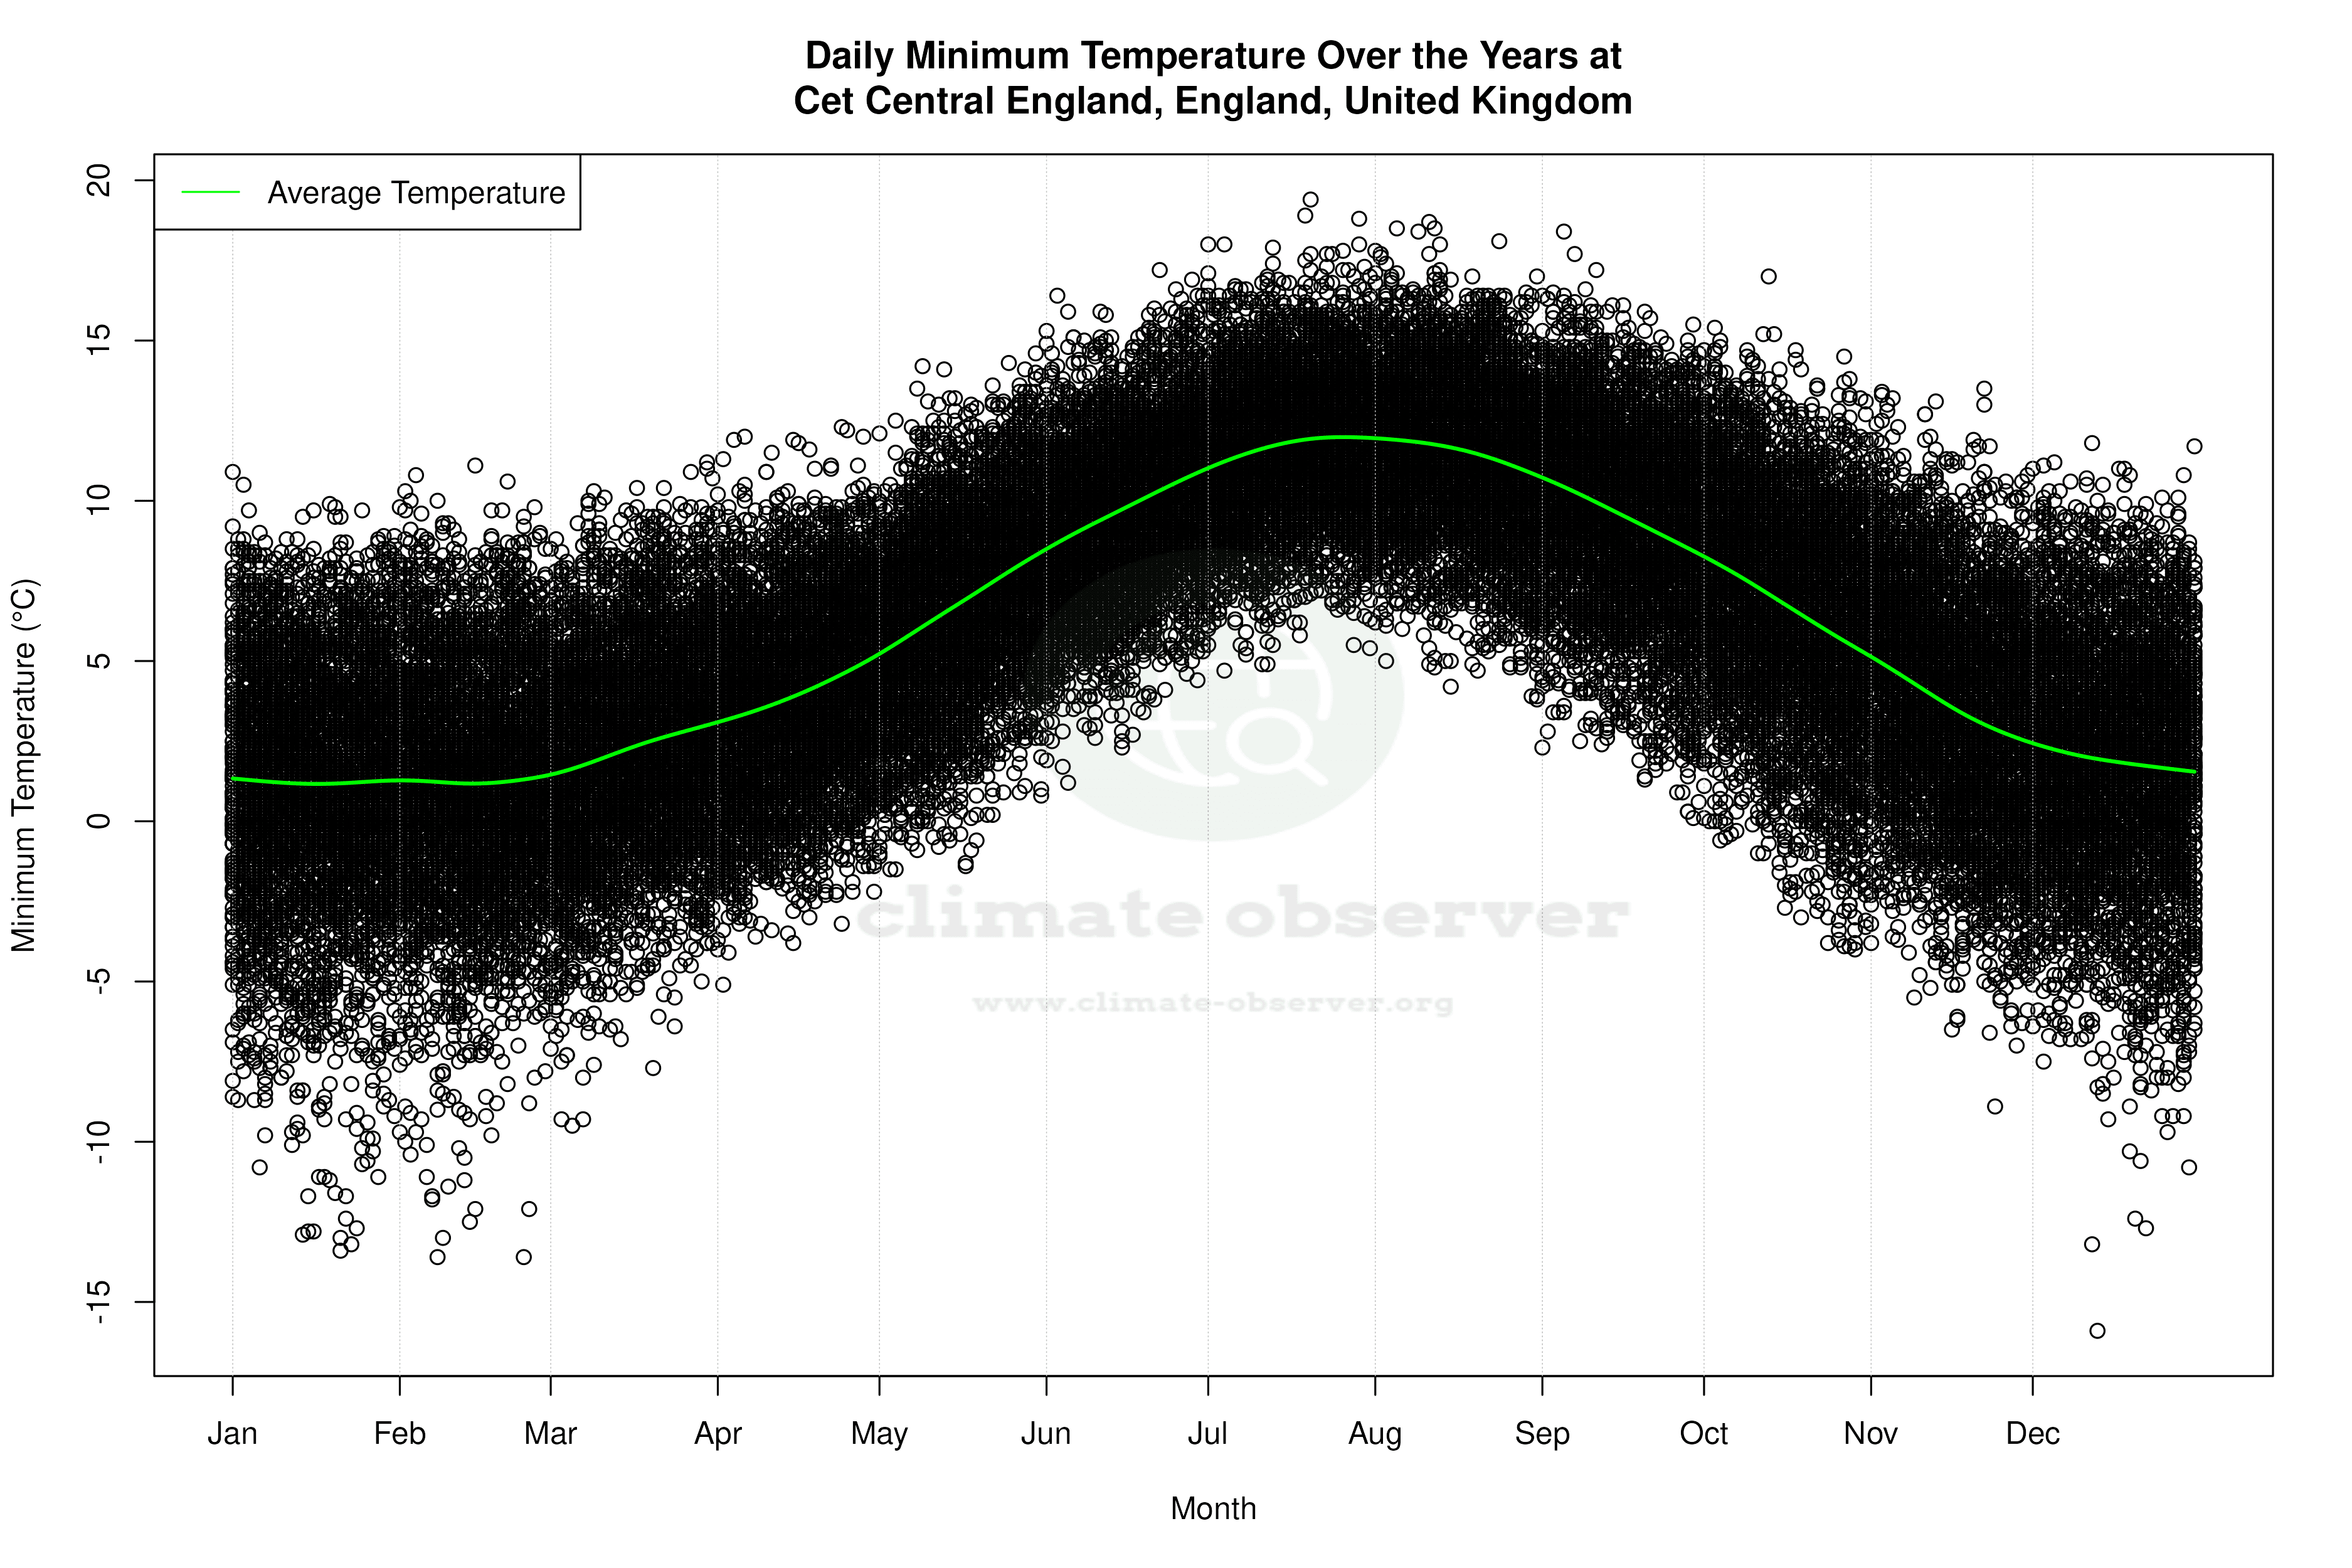

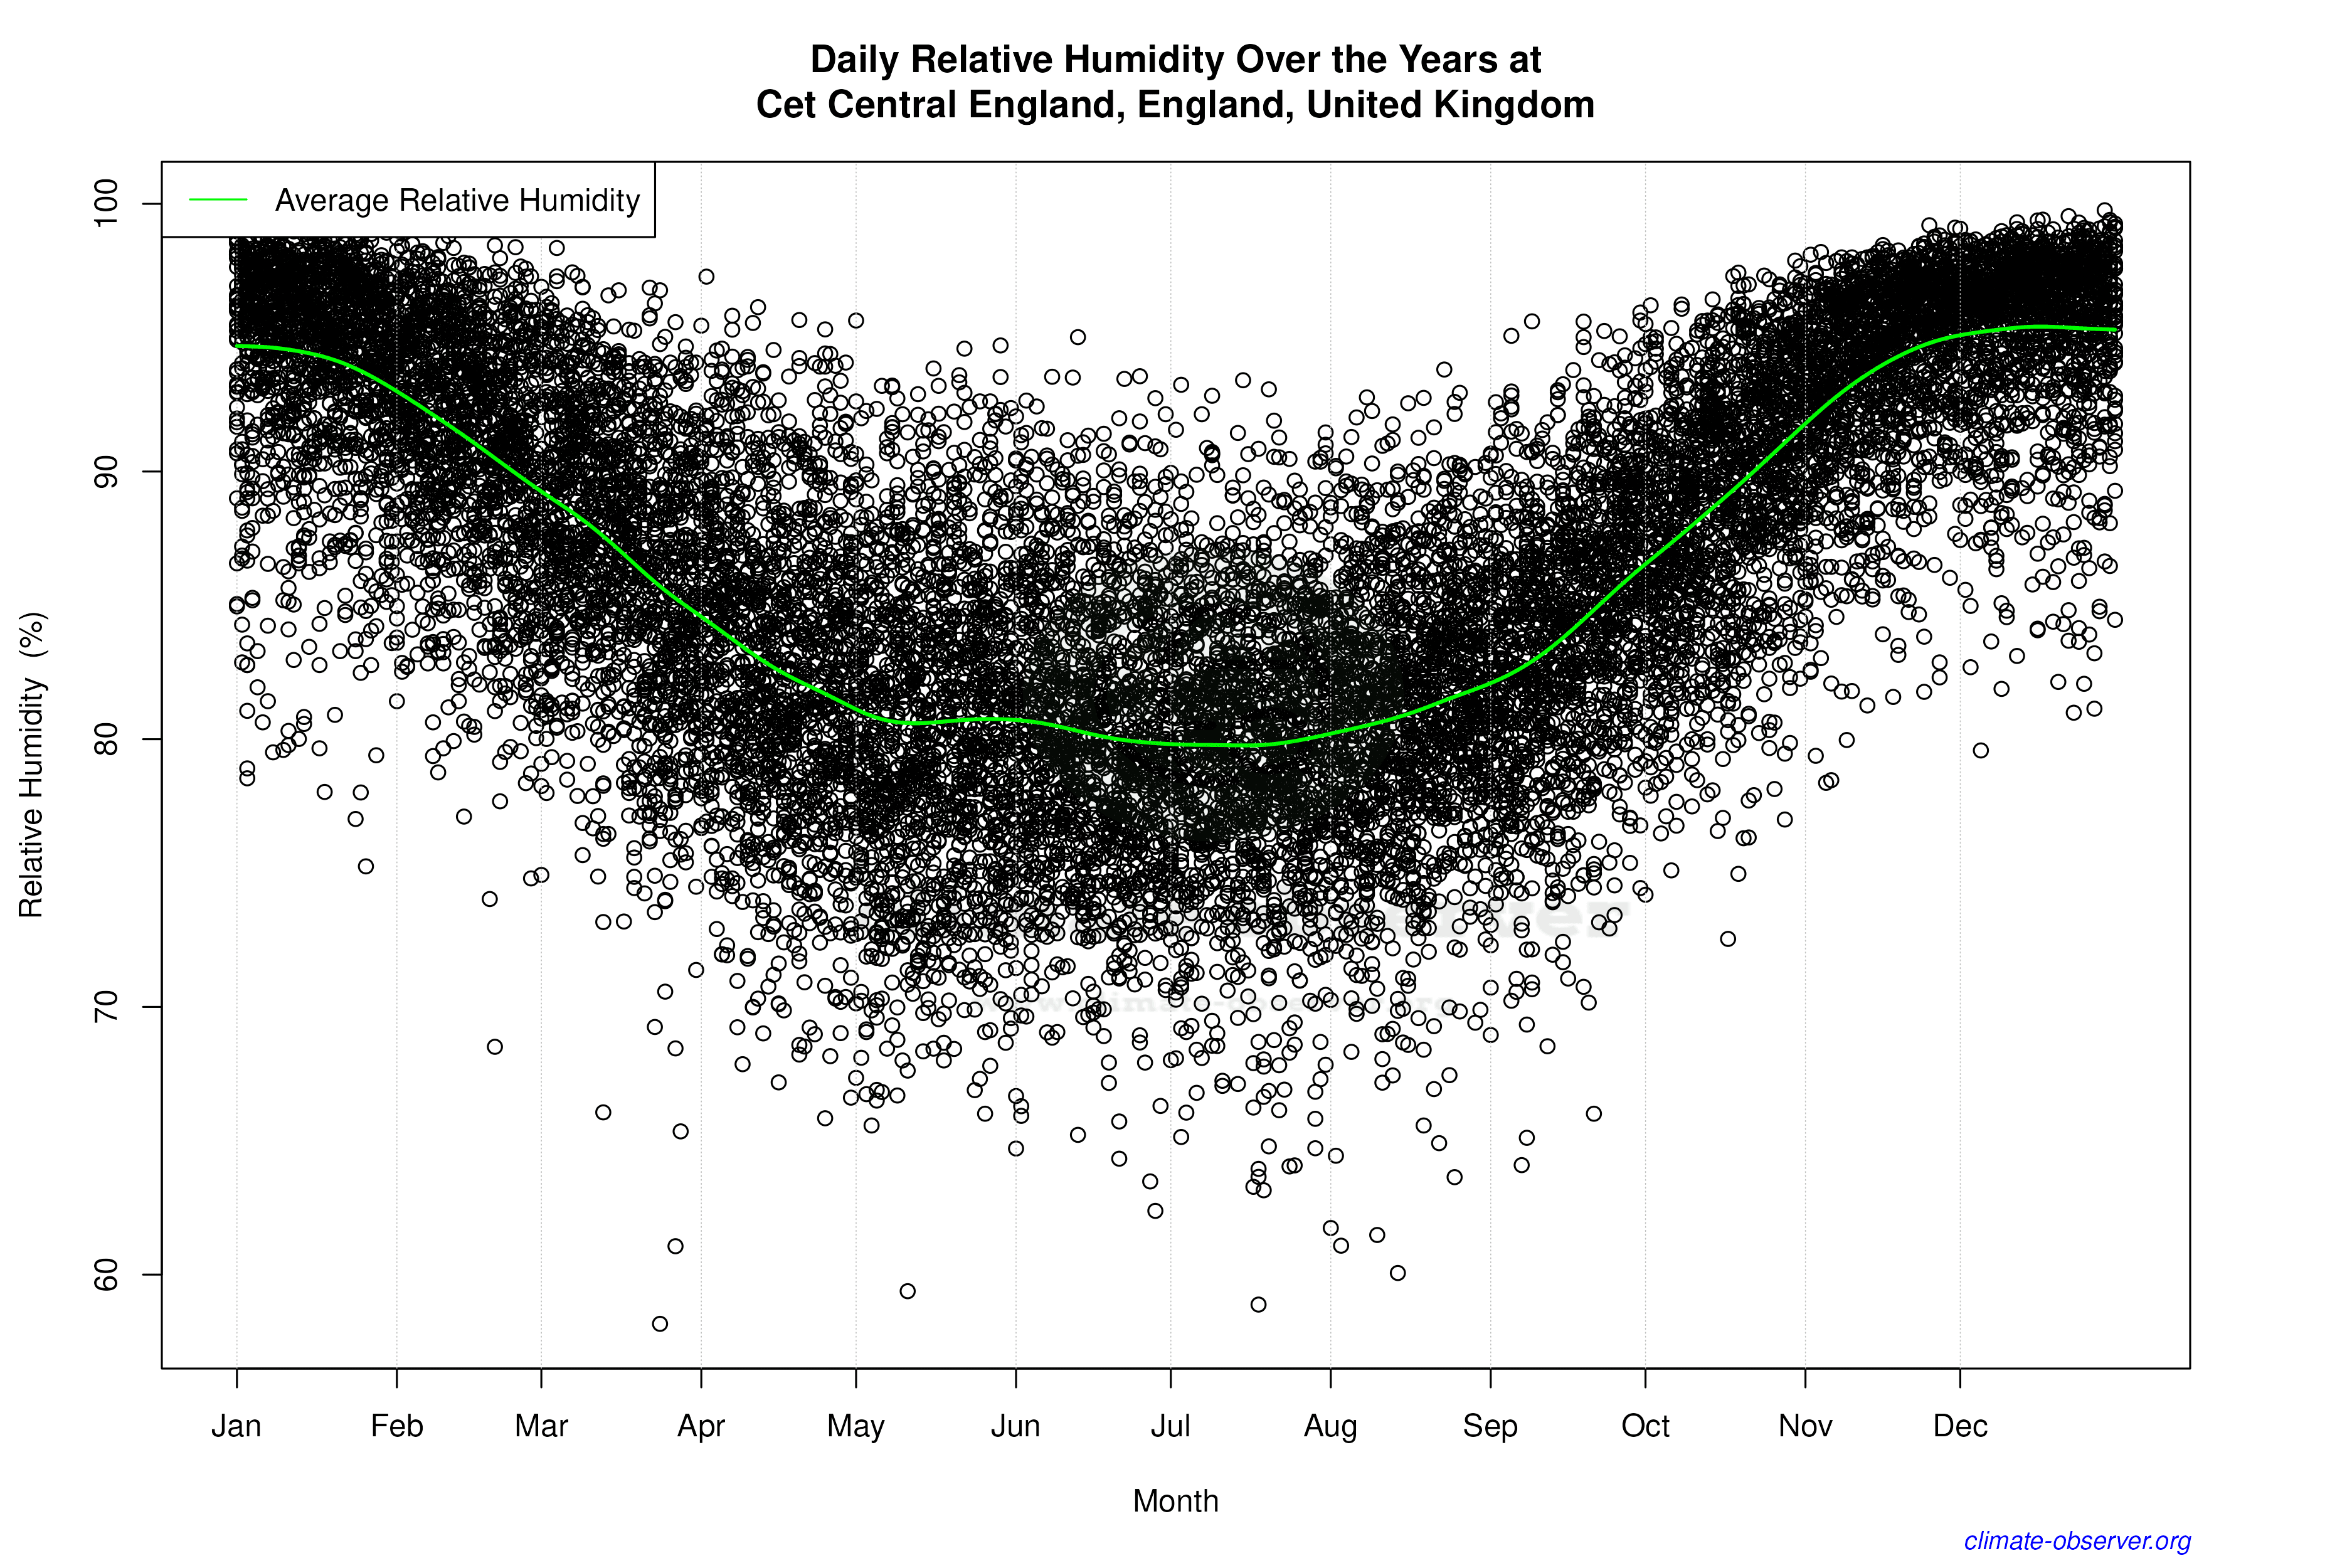

Average Max Temperature Throughout Year | 1 of 5
