Climate for Station: Lerwick, Shetland, United Kingdom
Loading live weather...
Climate Analysis & Overview
Lerwick's climate is experiencing a subtle warming trend, with a more even distribution of rainfall. The past decade shows a sharper increase in temperatures compared to the all-time trend, highlighting the nuanced dynamics of climate change in this region.
Maritime Climate Dynamics
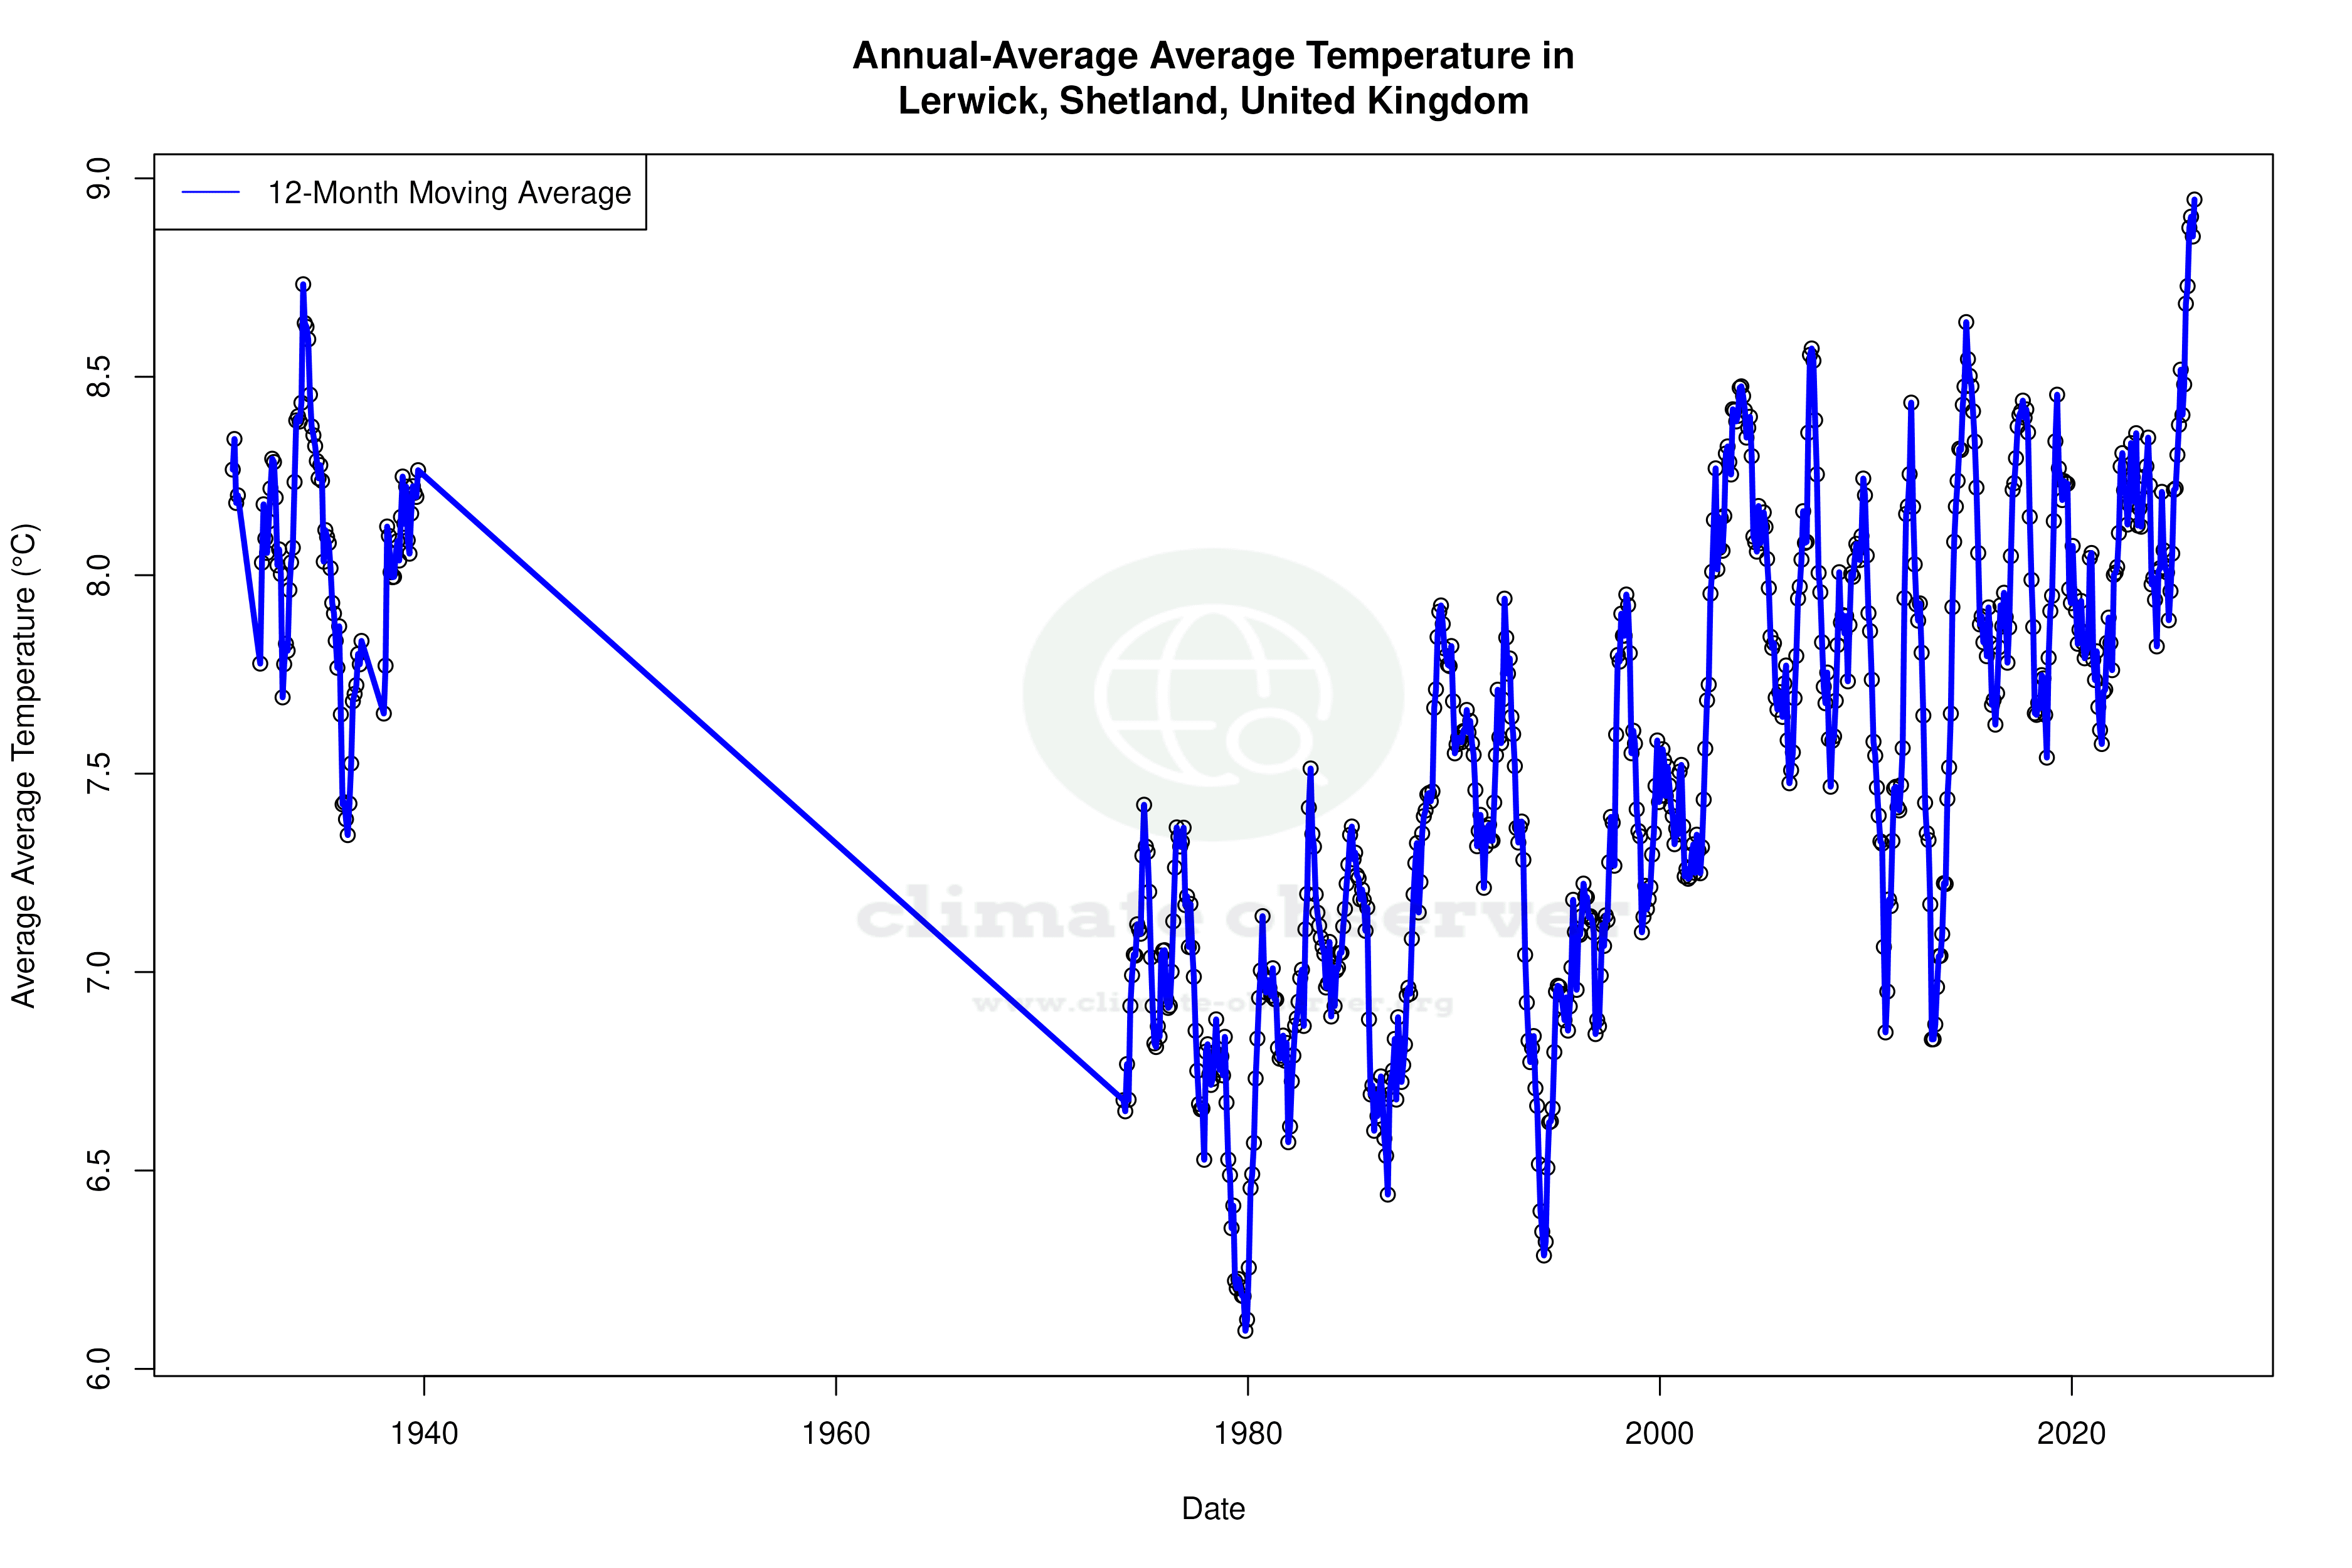
Lerwick, located at 60.1331°N, -1.1831°W in the Shetland Islands, experiences a maritime climate, classified as Cfc under the Köppen system. This classification indicates a subpolar oceanic climate, characterized by cool summers and mild winters, heavily influenced by its proximity to the North Atlantic Ocean. The ocean acts as a thermal buffer, moderating temperature extremes. The all-time temperature trends reveal a slight warming, with highs increasing by 0.09°C (0.16°F) and lows by 0.14°C (0.25°F). These changes are indicative of a gradual rise, aligning with broader regional climate patterns in the UK.
Decadal Temperature Shifts
In contrast to the all-time trends, the past decade has seen a more pronounced warming, with highs rising by 0.46°C (0.83°F) and lows by 0.45°C (0.81°F). This sharper increase suggests that recent years have experienced more significant thermal shifts, possibly due to intensified climate change effects. These trends are particularly relevant as the UK aims to mitigate climate impacts through its ambitious net-zero targets.
Precipitation Patterns
The Precipitation Concentration Index (PCI) for Lerwick has decreased from a baseline of 10.59 to 9.28, indicating a more even distribution of rainfall events. In simpler terms, precipitation is now spread more consistently throughout the year, rather than being concentrated in fewer, more intense events. This shift towards a more even rainfall pattern is beneficial for local ecosystems and agriculture, reducing the risk of flooding and drought.
Temperature Extremes
Lerwick's recorded temperature extremes provide a snapshot of its climatic boundaries, with a maximum of 23.0°C (73.4°F) and a minimum of -8.9°C (16.0°F). These records underscore the moderating influence of the surrounding ocean, which prevents the extreme highs and lows seen in more continental climates. Such moderation is a hallmark of maritime climates and is crucial for maintaining the unique biodiversity of the Shetland Islands.
Climate Implications and Regional Context
The observed trends in Lerwick are reflective of broader climatic changes across the UK, where warming temperatures and altered precipitation patterns are becoming more common. These changes have significant implications for local infrastructure, agriculture, and biodiversity. As the UK continues to address climate change through policy and innovation, understanding localised trends such as those in Lerwick is vital for effective adaptation and mitigation strategies.
Station Statistics
10-Year Trend
High: +0.23 °C/decade
Low: +0.25 °C/decade
Rain: +0.02 mm/decade
25-Year Trend
High: +0.34 °C/decade
Low: +0.27 °C/decade
Rain: -0.04 mm/decade
50-Year Trend
High: +0.31 °C/decade
Low: +0.39 °C/decade
Rain: +0.02 mm/decade
All-Time Trend
High: +0.10 °C/decade
Low: +0.15 °C/decade
Rain: +0.07 mm/decade
Percentage Above-Average Days
Last 12 Months: 59.7%
This Year: 38.5%
Precipitation Concentration Index (PCI) ℹ️
Last 12 Months: 10.0
Historical Average: 11.4
Percentile Rank of Last 12 Months ℹ️
High: 96th percentile
Low: 96th percentile
Rain: 42nd percentile
Change in Variance ℹ️
High: -7.9%
Low: -4.4%
Intraday: +17.0%
Data Coverage
87.6%
First Year of Data
1995
Station Location
Historical Weather Records
| Max High | Avg High | Min High | Max Avg | Avg Avg | Min Avg | Max Low | Avg Low | Min Low | Max Precipitation | Avg Precipitation | Max Snow | Avg Snow | |
|---|---|---|---|---|---|---|---|---|---|---|---|---|---|
| Record | 23.4 °C | — | -3.9 °C | 18.3 °C | — | -4.6 °C | 16.2 °C | — | -8.9 °C | 106.9 mm | — | — | — |
| January | 12.8 °C | 5.7 °C | -3.9 °C | 9.8 °C | 4.3 °C | -2.9 °C | 9.0 °C | 1.5 °C | -8.9 °C | 87.1 mm | 4.5 mm | — | — |
| February | 11.7 °C | 5.5 °C | -3.0 °C | 9.4 °C | 4.0 °C | -4.4 °C | 8.7 °C | 1.3 °C | -7.4 °C | 96.0 mm | 3.8 mm | — | — |
| March | 13.3 °C | 6.4 °C | -1.7 °C | 9.8 °C | 4.5 °C | -4.6 °C | 8.6 °C | 2.0 °C | -8.3 °C | 94.0 mm | 3.4 mm | — | — |
| April | 16.1 °C | 8.1 °C | 0.1 °C | 10.4 °C | 5.6 °C | -1.1 °C | 9.2 °C | 3.1 °C | -5.7 °C | 78.0 mm | 2.5 mm | — | — |
| May | 20.7 °C | 10.5 °C | 2.8 °C | 16.0 °C | 7.8 °C | 0.6 °C | 12.2 °C | 5.3 °C | -2.2 °C | 82.0 mm | 1.9 mm | — | — |
| June | 22.8 °C | 12.7 °C | 7.2 °C | 17.6 °C | 10.1 °C | 3.3 °C | 14.9 °C | 7.7 °C | -0.6 °C | 90.4 mm | 2.2 mm | — | — |
| July | 23.4 °C | 14.3 °C | 8.7 °C | 18.1 °C | 11.9 °C | 7.6 °C | 16.2 °C | 9.7 °C | 3.5 °C | 106.9 mm | 2.3 mm | — | — |
| August | 22.1 °C | 14.4 °C | 8.9 °C | 18.3 °C | 12.2 °C | 7.8 °C | 16.0 °C | 9.9 °C | 2.8 °C | 79.5 mm | 2.8 mm | — | — |
| September | 20.7 °C | 12.8 °C | 6.1 °C | 16.9 °C | 10.7 °C | 4.2 °C | 14.1 °C | 8.6 °C | -0.6 °C | 57.4 mm | 3.7 mm | — | — |
| October | 17.2 °C | 10.4 °C | 2.5 °C | 13.4 °C | 8.6 °C | 0.4 °C | 12.6 °C | 6.4 °C | -3.3 °C | 89.4 mm | 4.3 mm | — | — |
| November | 14.0 °C | 7.9 °C | -0.9 °C | 12.0 °C | 6.4 °C | -2.3 °C | 11.5 °C | 3.9 °C | -5.7 °C | 90.4 mm | 4.7 mm | — | — |
| December | 12.8 °C | 6.6 °C | -1.9 °C | 10.9 °C | 4.9 °C | -3.9 °C | 10.1 °C | 2.4 °C | -8.2 °C | 90.9 mm | 4.7 mm | — | — |
Data Visualisations
Remove WatermarksCurrent Year Climate Trends vs Historical


Max Temperature this Year | 1 of 6
Climate 12-Month Moving Averages
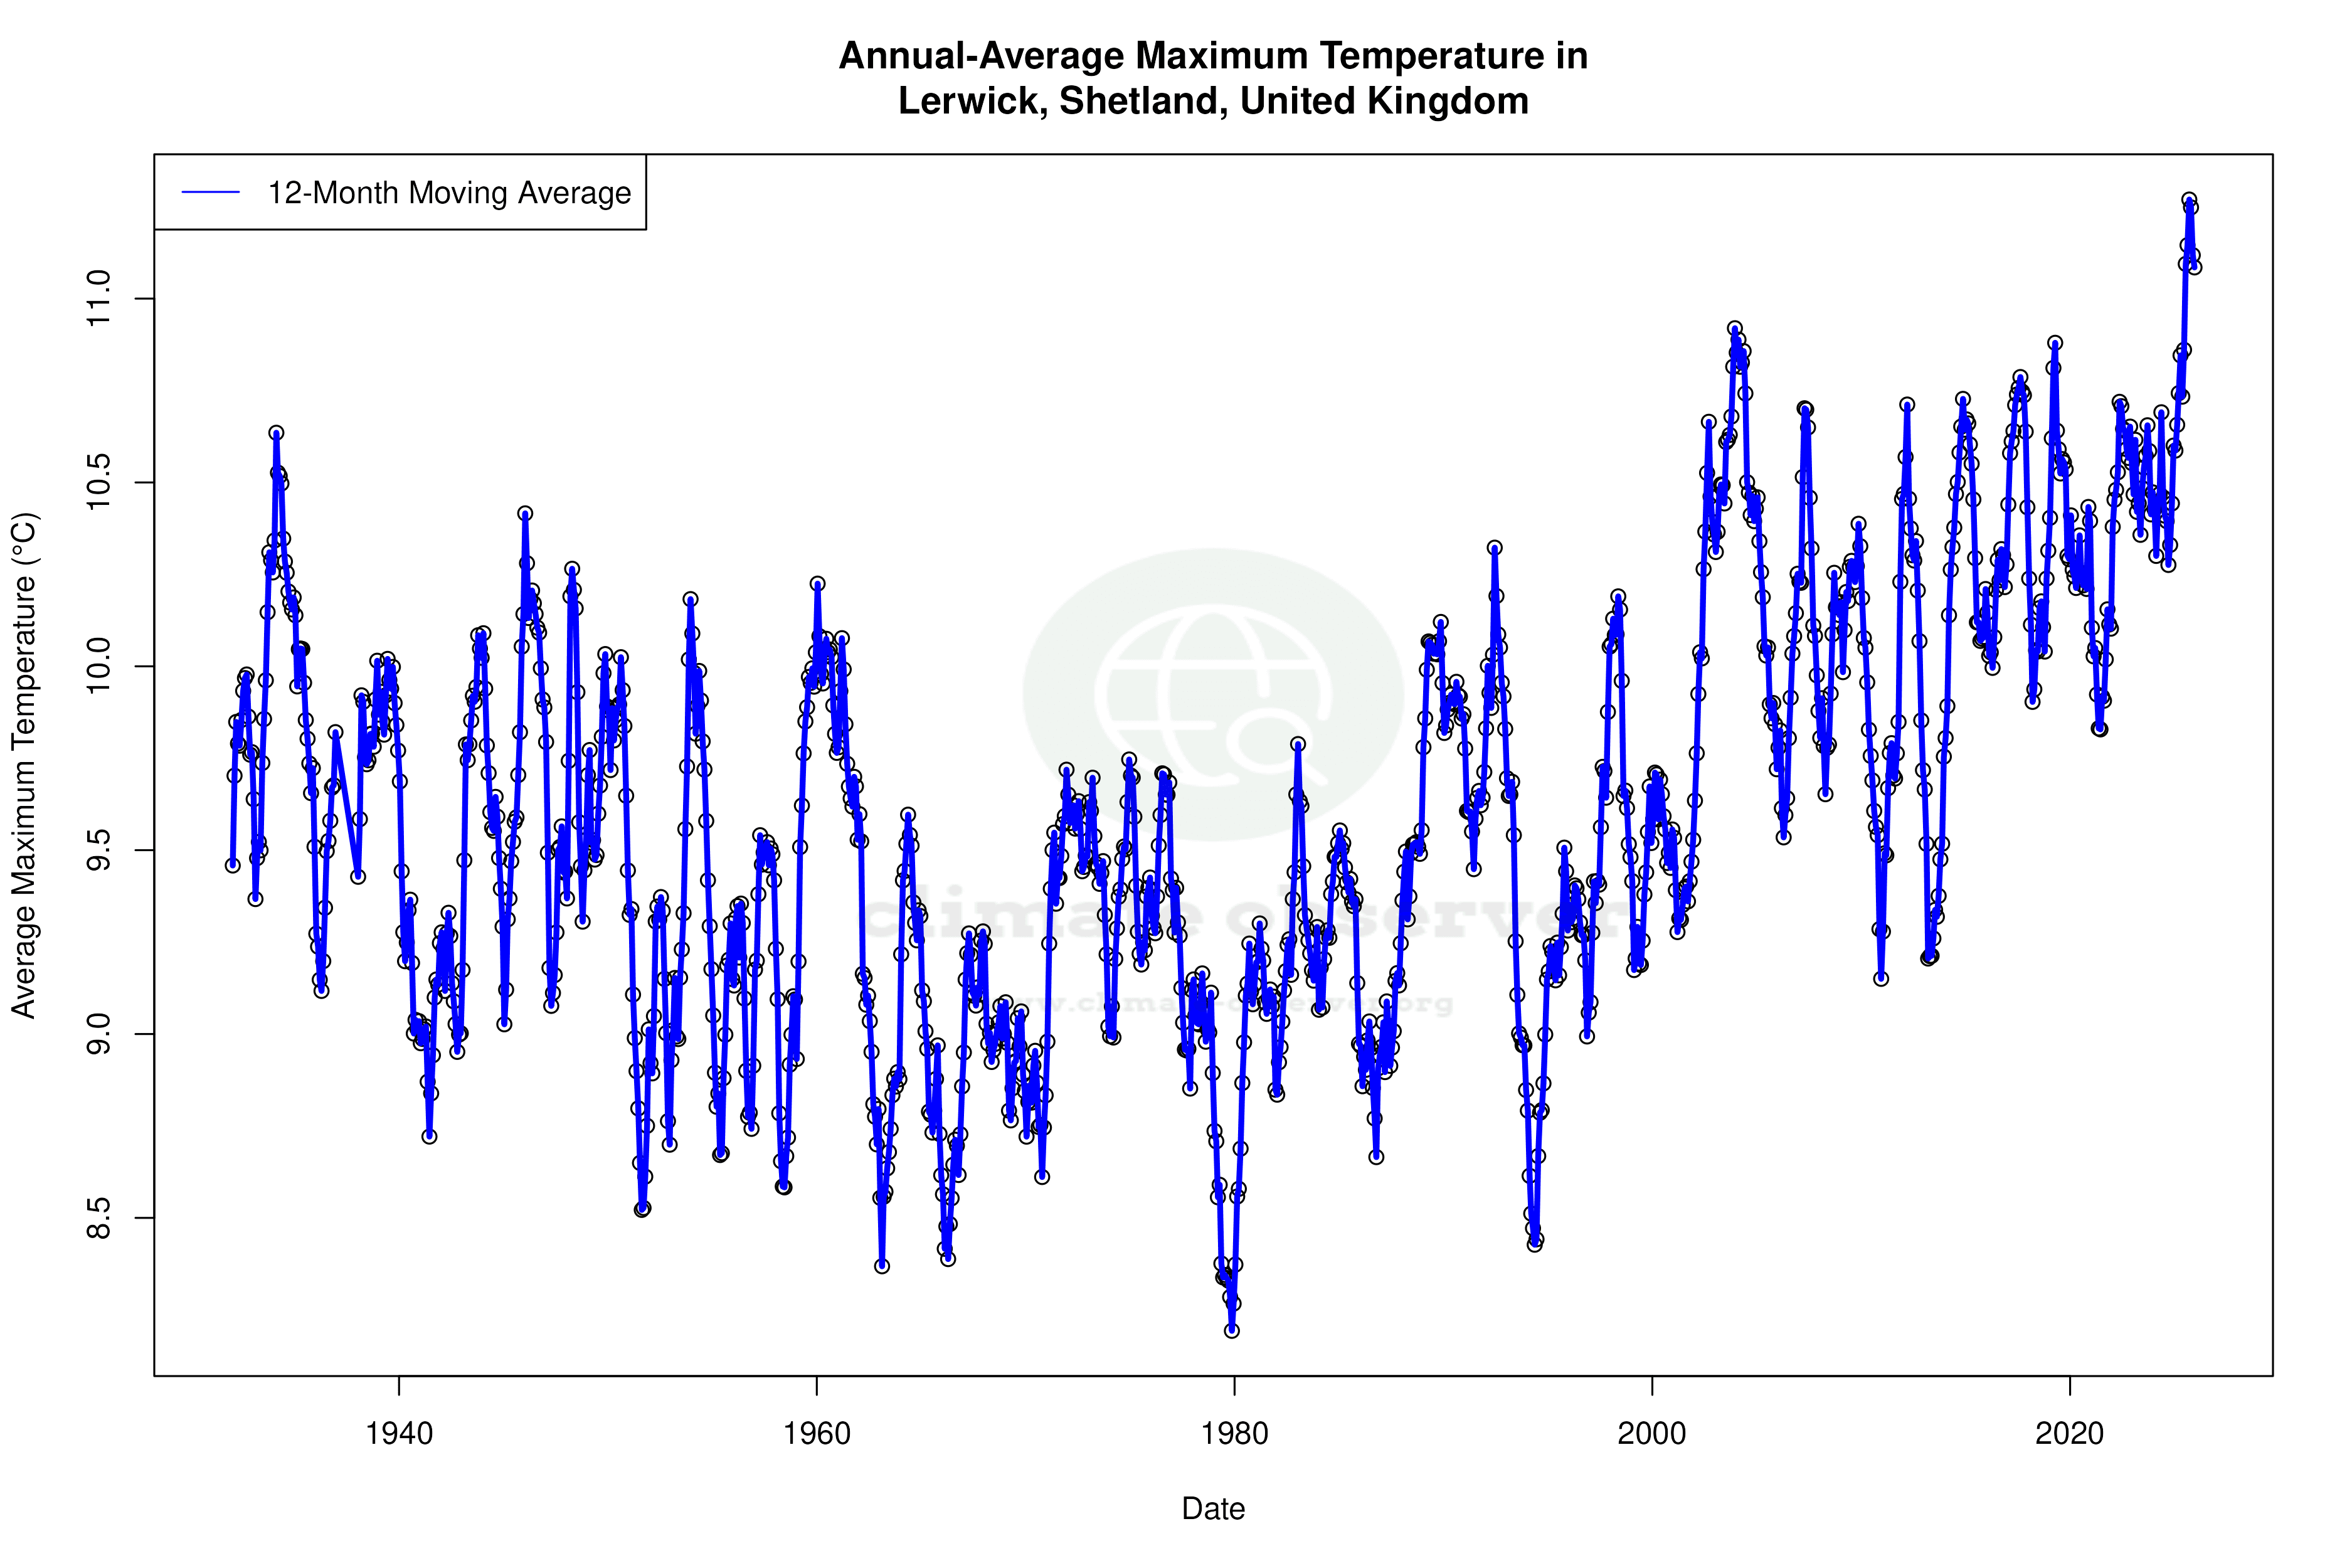


Max Temperature 12-Month MA | 1 of 6
Daily Data Points and Averages Throughout the Year


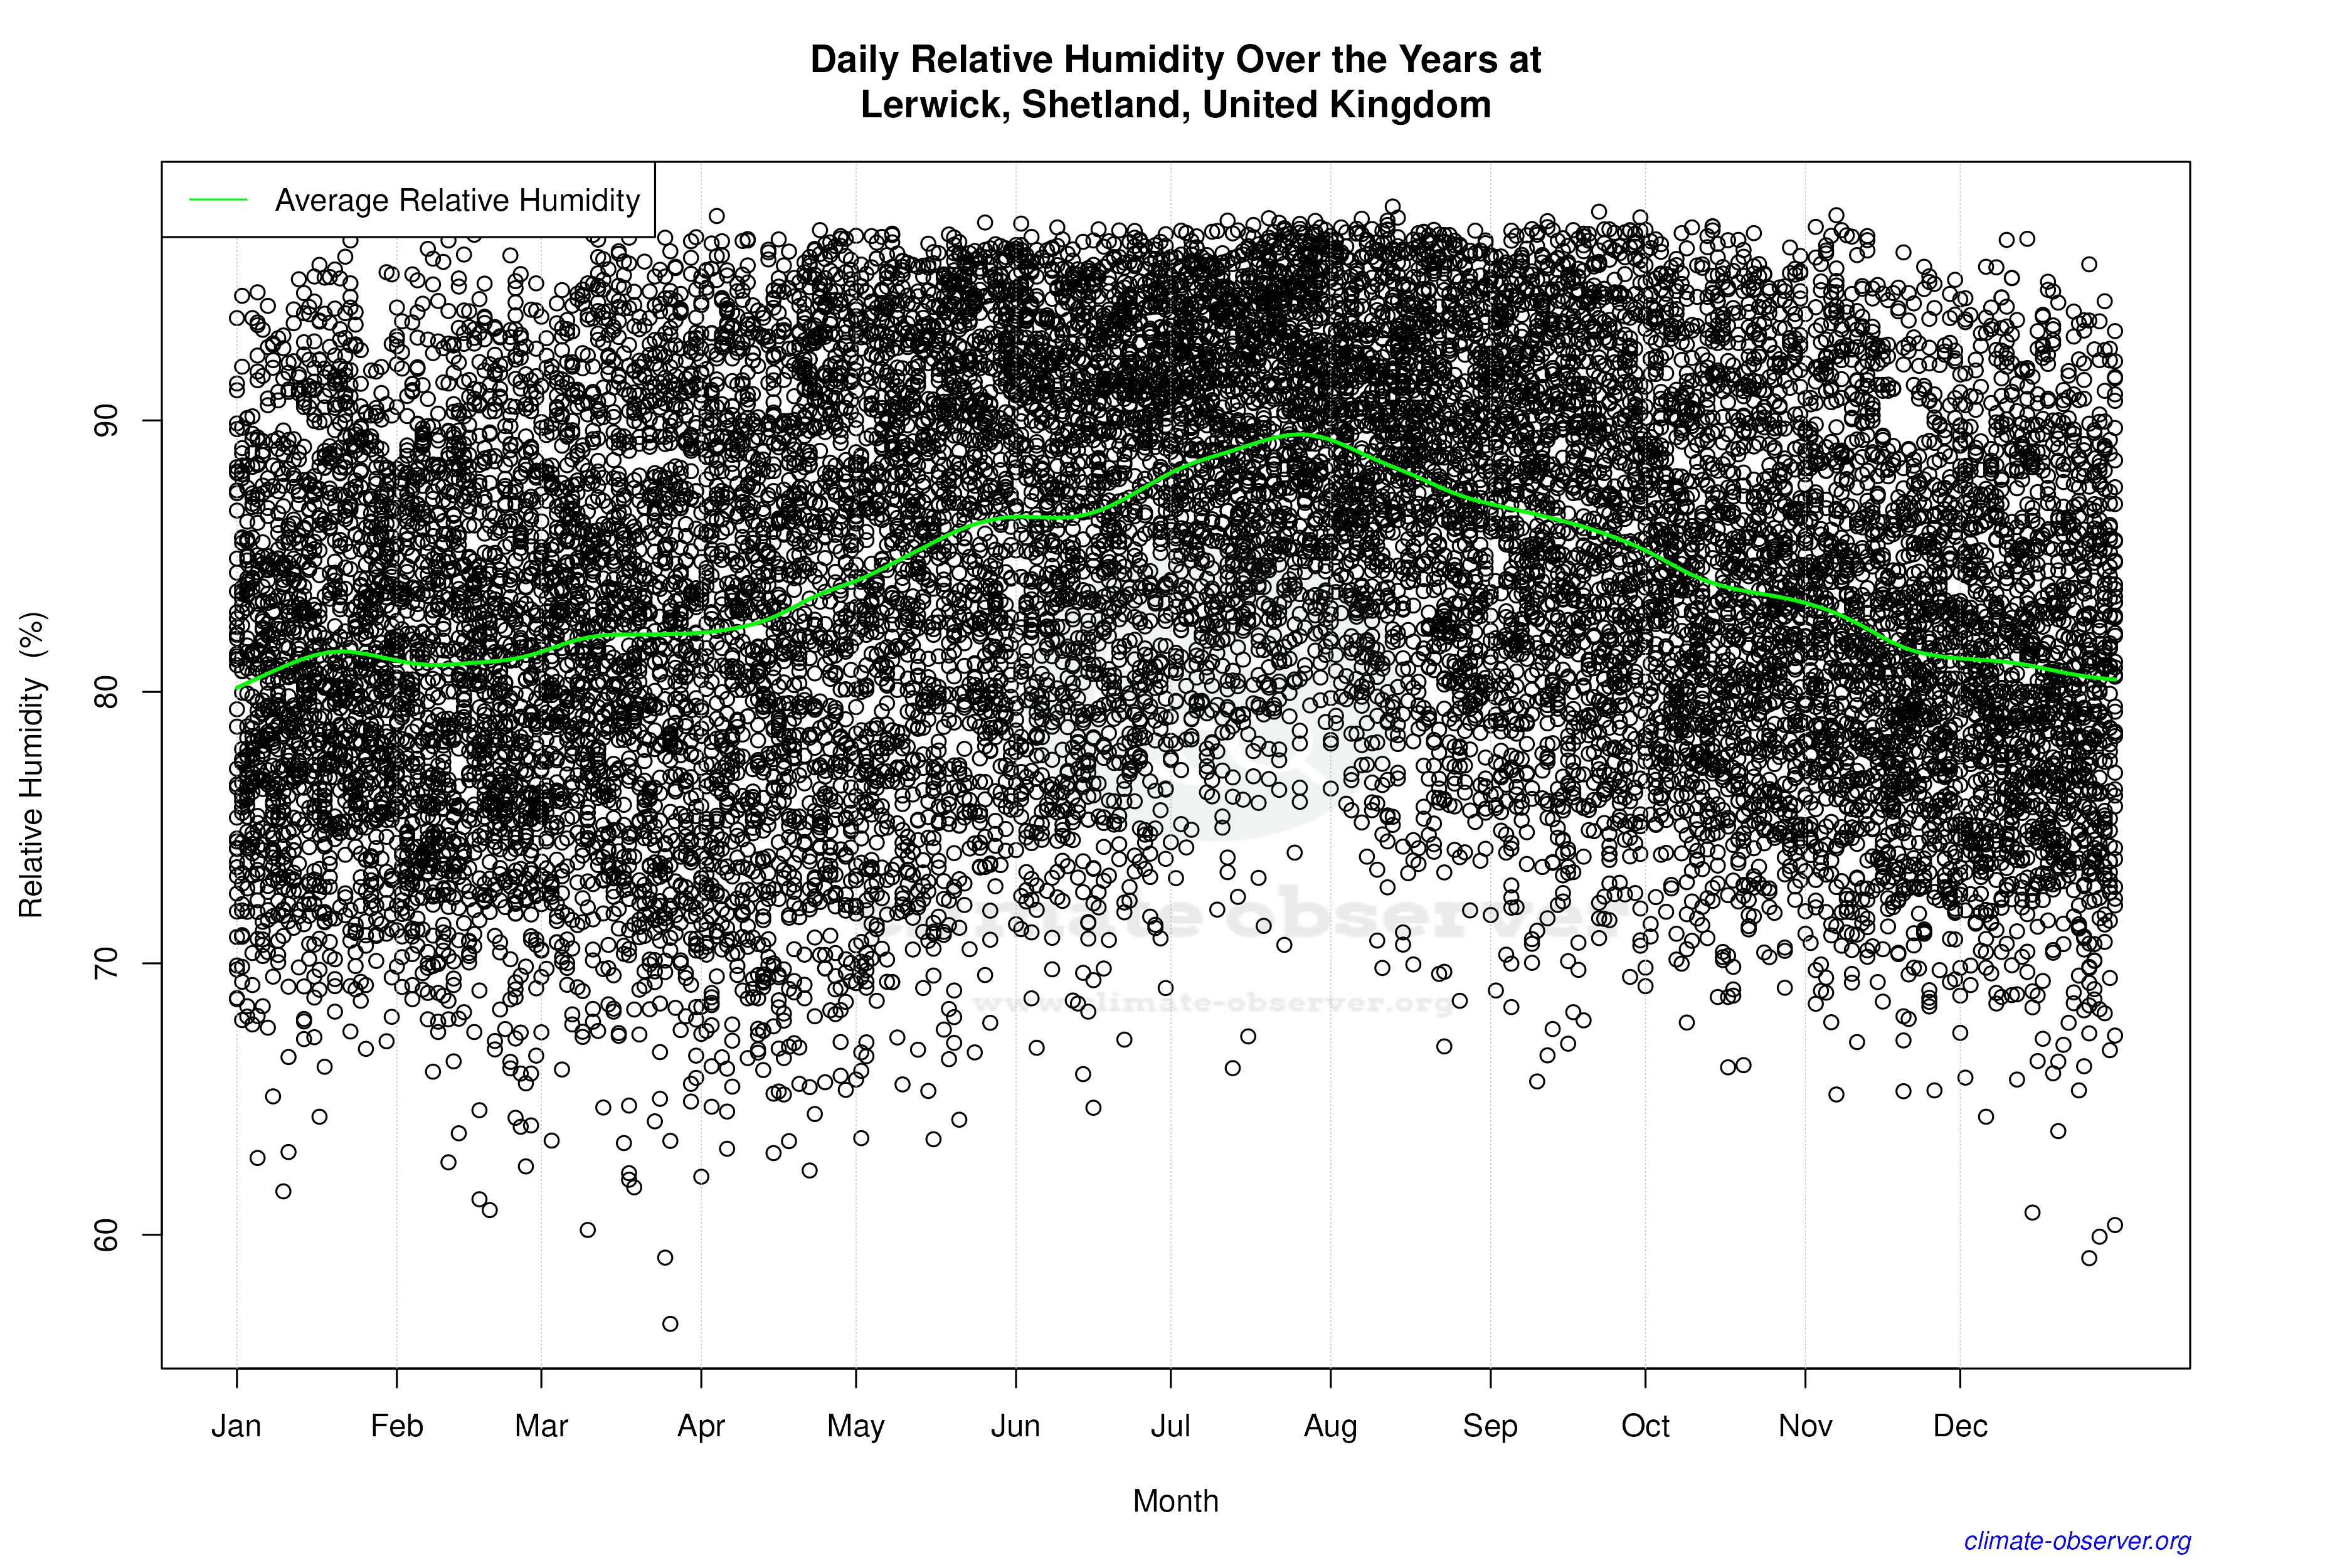

Average Max Temperature Throughout Year | 1 of 5
