Climate for Station: Armagh, United Kingdom
Loading live weather...
Climate Analysis & Overview
Armagh, located in Northern Ireland, is experiencing a warming trend with notable increases in both high and low temperatures over the past decade. The Precipitation Concentration Index indicates a slight increase in precipitation concentration, suggesting more intense rainfall events. These changes align with broader climate shifts observed across the United Kingdom.
Geographic and Climatic Context
Armagh is situated at 54.35°N, -6.65°W in Northern Ireland, characterised by a temperate maritime climate under the Köppen classification. This climate type is marked by mild temperatures and relatively consistent rainfall throughout the year. The local geography, including the proximity to the Irish Sea and the shelter provided by the surrounding hills, influences its weather patterns, often moderating extreme temperature fluctuations.
Warming Trends and Temperature Records
The all-time temperature trends for Armagh reveal a gradual warming, with highs increasing by 0.06°C (0.11°F) and lows by 0.06°C (0.11°F). This long-term warming is consistent with global climate trends. However, a more pronounced warming is evident over the past decade, with highs rising by 0.88°C (1.58°F) and lows by 1.05°C (1.89°F). This accelerated warming in recent years may be attributed to anthropogenic climate change, a concern echoed in the UK's regional climate goals, which aim to mitigate such impacts. The station has recorded extreme temperatures, with a maximum of 31.3°C (88.3°F) and a minimum of -15.1°C (5.8°F), illustrating the range of thermal conditions experienced in this area.
Precipitation Patterns and PCI Analysis
The Precipitation Concentration Index (PCI) for Armagh has shown a slight increase from a baseline of 10.29 to a current value of 11.10. This suggests a marginal shift towards more concentrated rainfall events, meaning that precipitation is increasingly occurring in fewer, more intense episodes. While this change is not drastic, it highlights a potential shift in precipitation patterns that could have implications for water management and flood risk in the region.
Regional Implications and Climate Goals
These climatic changes in Armagh are reflective of broader trends across the United Kingdom, where efforts are underway to address climate change through policy and innovation. The UK's commitment to reducing greenhouse gas emissions and enhancing climate resilience is crucial in managing the impacts of these observed trends. Recent weather events, such as increased rainfall and warmer summers, underscore the importance of these initiatives in safeguarding communities and ecosystems.
Future Considerations
As Armagh continues to experience these climatic shifts, understanding the implications for agriculture, infrastructure, and biodiversity will be essential. Continued monitoring and research are vital to adapting to and mitigating the impacts of climate change in this region.
Station Statistics
10-Year Trend
High: +0.82 °C/decade
Low: +1.00 °C/decade
Rain: -0.01 mm/decade
25-Year Trend
High: +0.32 °C/decade
Low: +0.20 °C/decade
Rain: -0.30 mm/decade
50-Year Trend
High: +0.38 °C/decade
Low: +0.21 °C/decade
Rain: +0.13 mm/decade
All-Time Trend
High: +0.05 °C/decade
Low: +0.06 °C/decade
Rain: +0.02 mm/decade
Percentage Above-Average Days
Last 12 Months: 43.6%
This Year: 74.2%
Precipitation Concentration Index (PCI) ℹ️
Last 12 Months: 13.2
Historical Average: 10.3
Percentile Rank of Last 12 Months ℹ️
High: 97th percentile
Low: 95th percentile
Rain: 3rd percentile
Change in Variance ℹ️
High: +0.2%
Low: +2.5%
Intraday: +50.3%
Data Coverage
73.1%
First Year of Data
2025
Station Location
Historical Weather Records
| Max High | Avg High | Min High | Max Avg | Avg Avg | Min Avg | Max Low | Avg Low | Min Low | Max Precipitation | Avg Precipitation | Max Snow | Avg Snow | |
|---|---|---|---|---|---|---|---|---|---|---|---|---|---|
| Record | 31.3 °C | — | -8.0 °C | — | — | — | 19.2 °C | — | -14.6 °C | 83.0 mm | — | — | — |
| January | 15.7 °C | 7.1 °C | -5.7 °C | — | — | — | 12.6 °C | 1.7 °C | -14.3 °C | 35.3 mm | 2.4 mm | — | — |
| February | 17.0 °C | 7.8 °C | -1.9 °C | — | — | — | 12.0 °C | 1.8 °C | -13.8 °C | 83.0 mm | 2.1 mm | — | — |
| March | 21.8 °C | 9.6 °C | 0.3 °C | — | — | — | 11.5 °C | 2.4 °C | -12.4 °C | 80.0 mm | 1.9 mm | — | — |
| April | 23.4 °C | 12.4 °C | 2.0 °C | — | — | — | 13.3 °C | 3.9 °C | -7.1 °C | 63.0 mm | 1.9 mm | — | — |
| May | 26.2 °C | 15.4 °C | 2.9 °C | — | — | — | 15.2 °C | 6.3 °C | -2.3 °C | 63.0 mm | 2.0 mm | — | — |
| June | 30.4 °C | 18.0 °C | 8.5 °C | — | — | — | 17.3 °C | 9.2 °C | 0.0 °C | 61.0 mm | 2.2 mm | — | — |
| July | 31.3 °C | 19.2 °C | 10.4 °C | — | — | — | 19.2 °C | 10.9 °C | 0.0 °C | 62.0 mm | 2.4 mm | — | — |
| August | 29.4 °C | 18.9 °C | 10.2 °C | — | — | — | 18.8 °C | 10.8 °C | 2.0 °C | 78.3 mm | 2.8 mm | — | — |
| September | 28.5 °C | 16.7 °C | 8.4 °C | — | — | — | 18.3 °C | 8.9 °C | -0.6 °C | 47.8 mm | 2.3 mm | — | — |
| October | 22.7 °C | 13.0 °C | 2.3 °C | — | — | — | 15.9 °C | 6.3 °C | -5.6 °C | 55.4 mm | 2.6 mm | — | — |
| November | 17.6 °C | 9.4 °C | -1.6 °C | — | — | — | 14.3 °C | 3.5 °C | -8.3 °C | 77.3 mm | 2.5 mm | — | — |
| December | 18.2 °C | 7.5 °C | -8.0 °C | — | — | — | 13.1 °C | 2.1 °C | -14.6 °C | 40.9 mm | 2.5 mm | — | — |
Data Visualisations
Remove WatermarksCurrent Year Climate Trends vs Historical


Max Temperature this Year | 1 of 6
Climate 12-Month Moving Averages
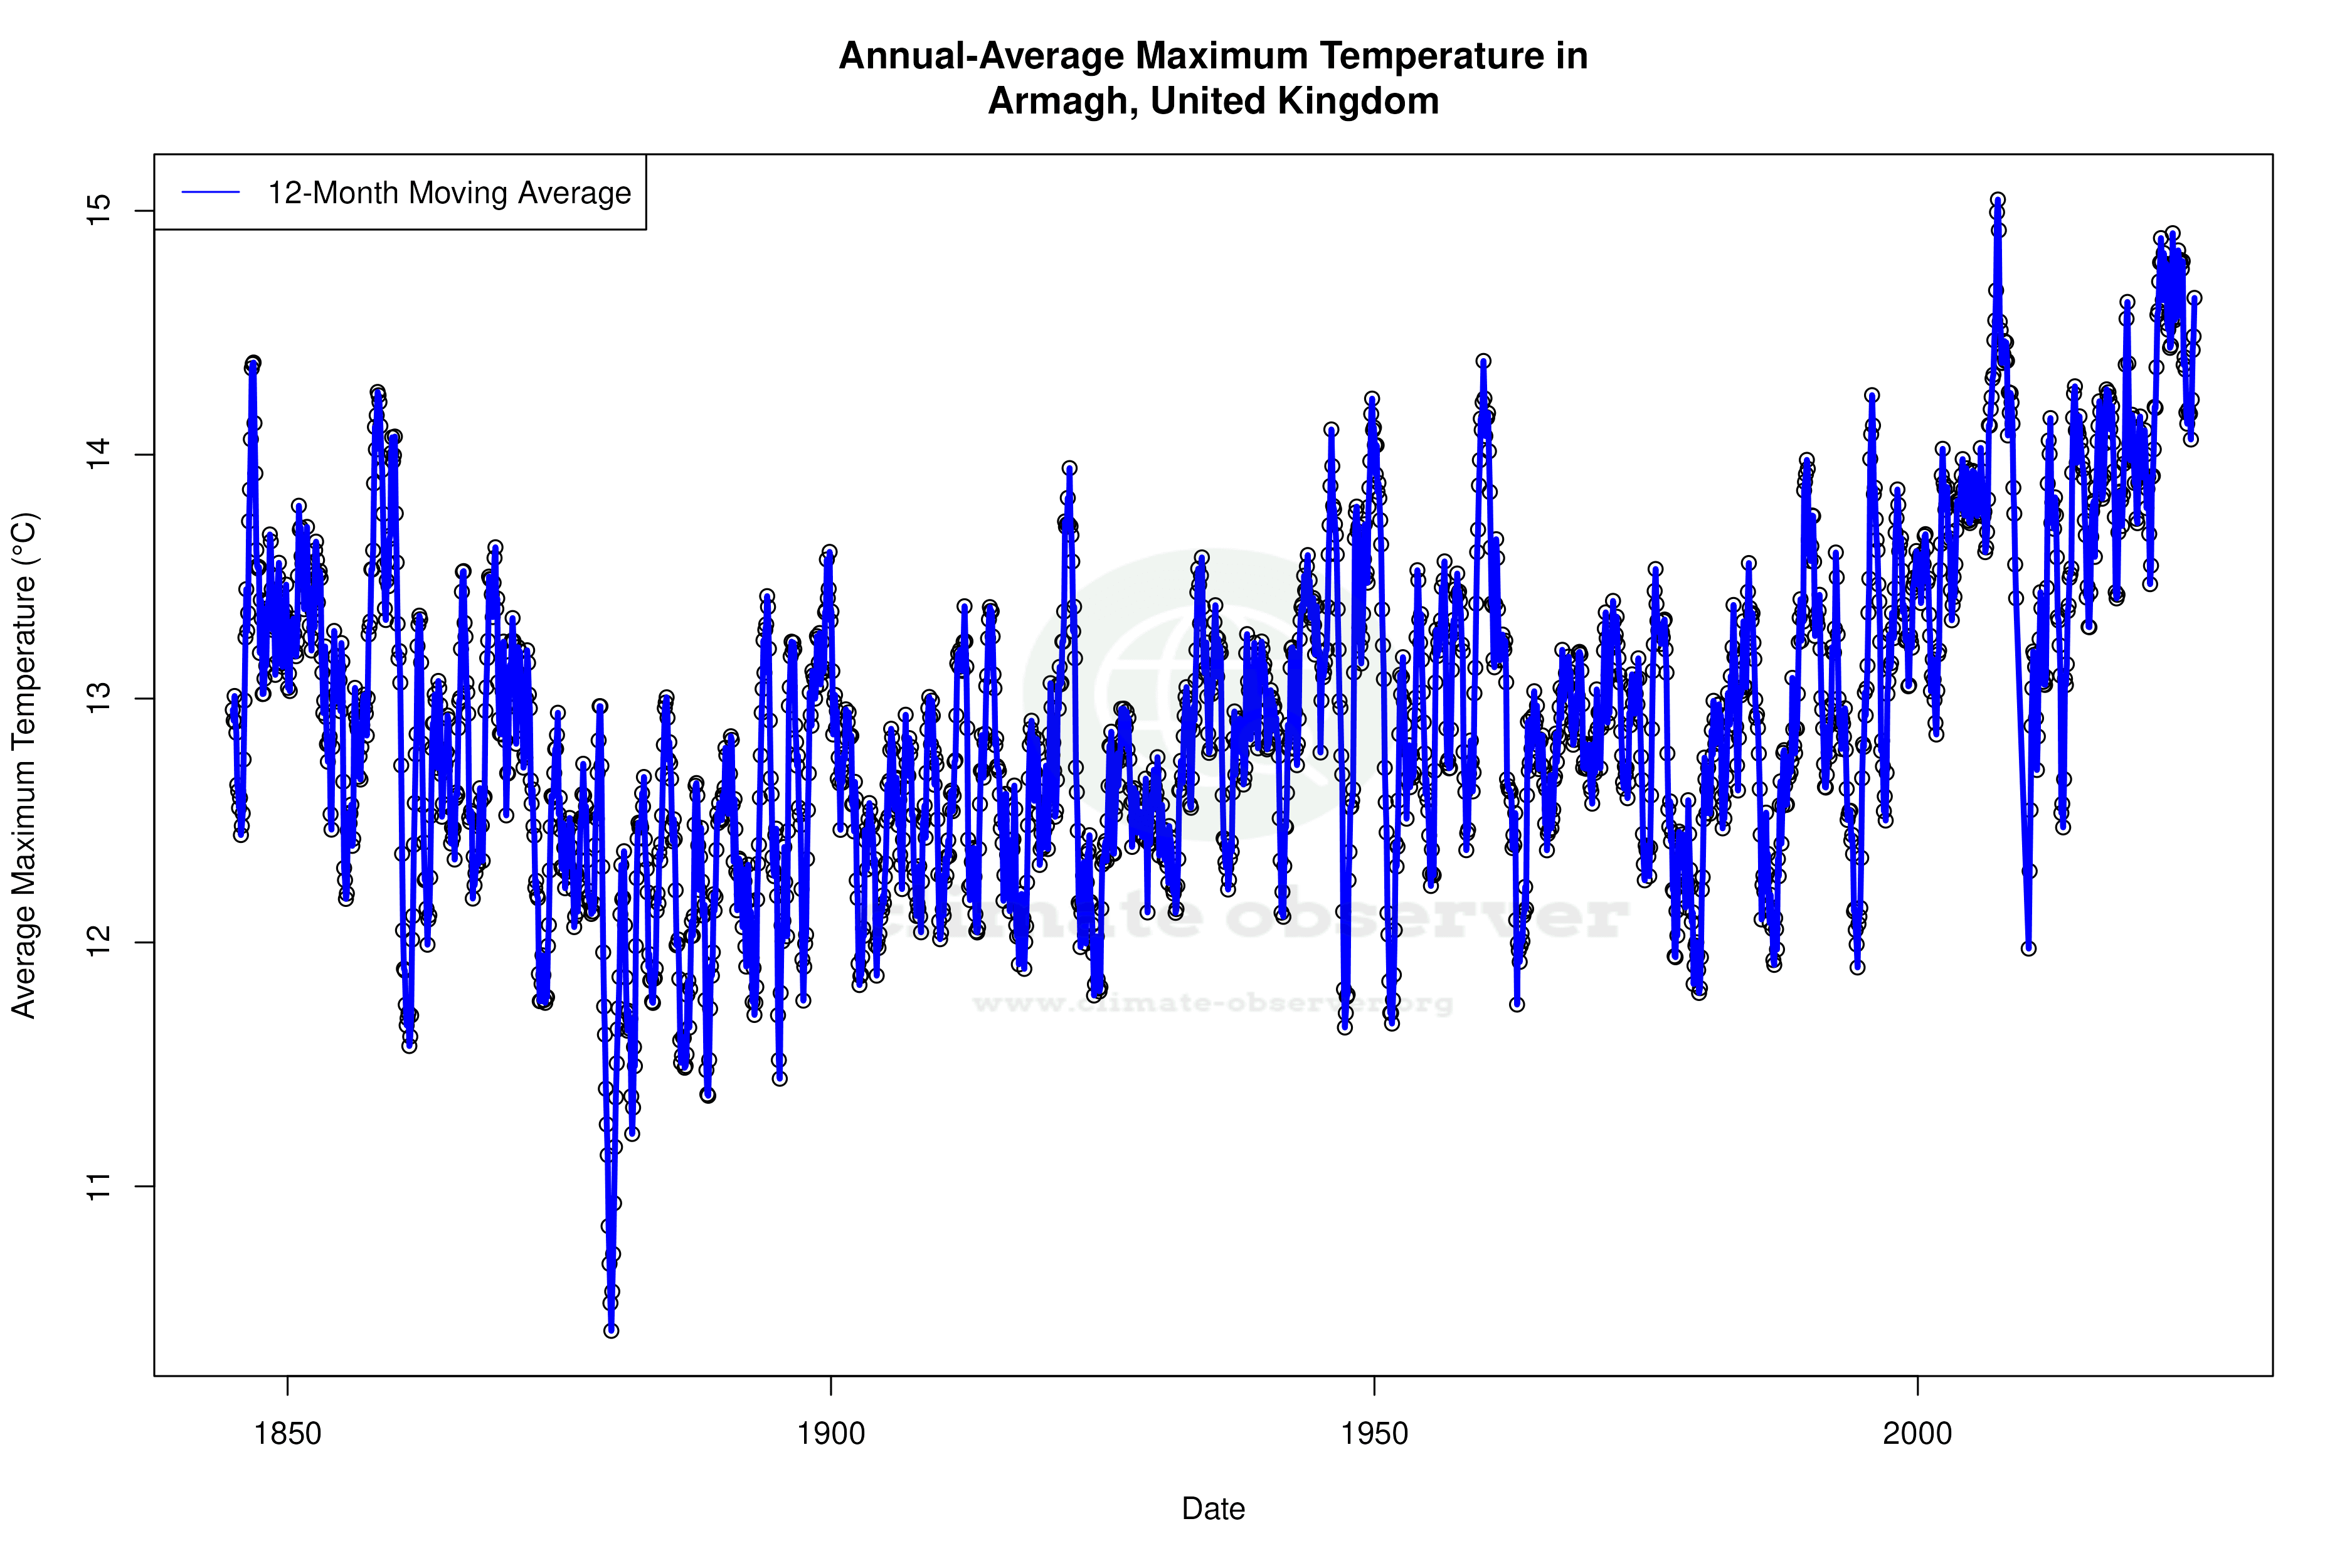
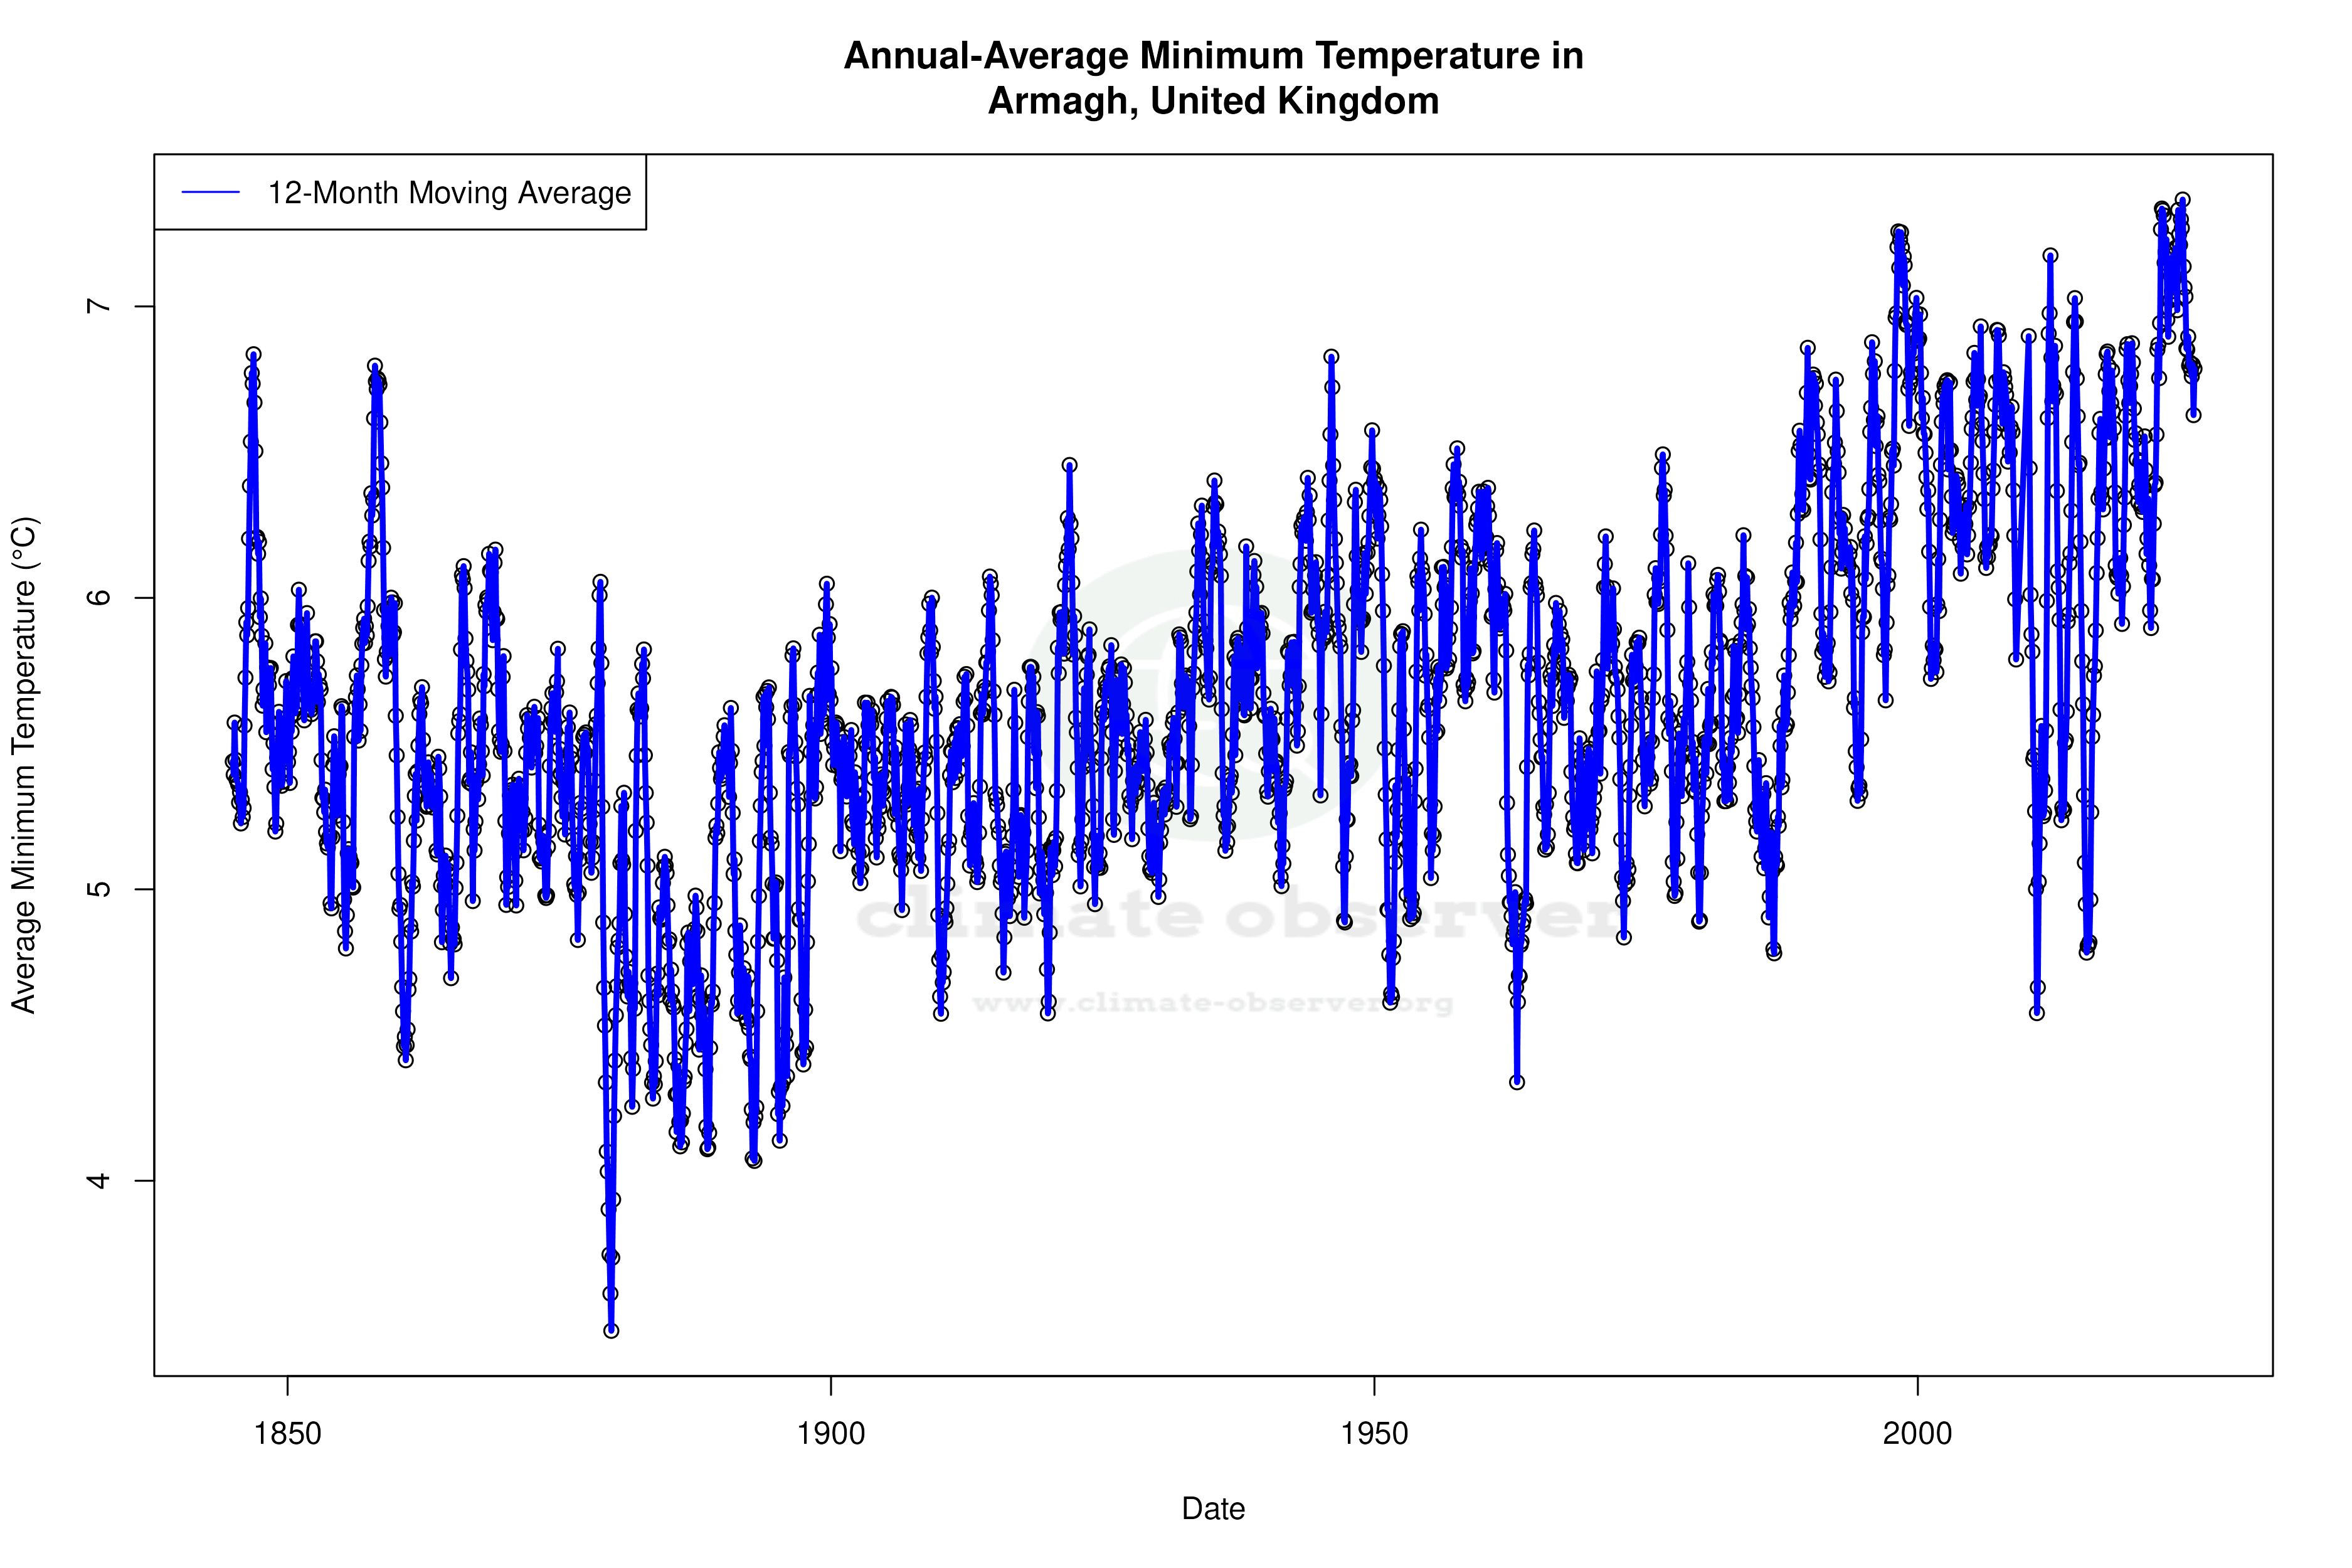


Max Temperature 12-Month MA | 1 of 6
Daily Data Points and Averages Throughout the Year


Average Max Temperature Throughout Year | 1 of 5
