Climate for Station: Oxford, Oxfordshire, United Kingdom
Loading live weather...
Climate Analysis & Overview
Oxford's climate is experiencing a warming trend, with both high and low temperatures rising over the past decade. The precipitation pattern shows a slight increase in concentration, indicating more intense rainfall events. These changes align with broader regional climate goals to understand and mitigate the impacts of climate change.
Warming Trends in Oxford
Oxford, located in the heart of England, is classified under the Köppen climate classification as Cfb, which denotes a temperate oceanic climate. This classification is characterized by mild temperatures and relatively even precipitation throughout the year. However, recent data indicates a warming trend in the region. Over the past decade, high temperatures have increased by 0.29°C (0.52°F), while low temperatures have risen by 0.38°C (0.69°F). These short-term trends are more pronounced than the all-time trends, where highs have increased by 0.09°C (0.16°F) and lows by 0.08°C (0.15°F). This suggests a more rapid warming in recent years, possibly influenced by regional weather patterns and global climate change.
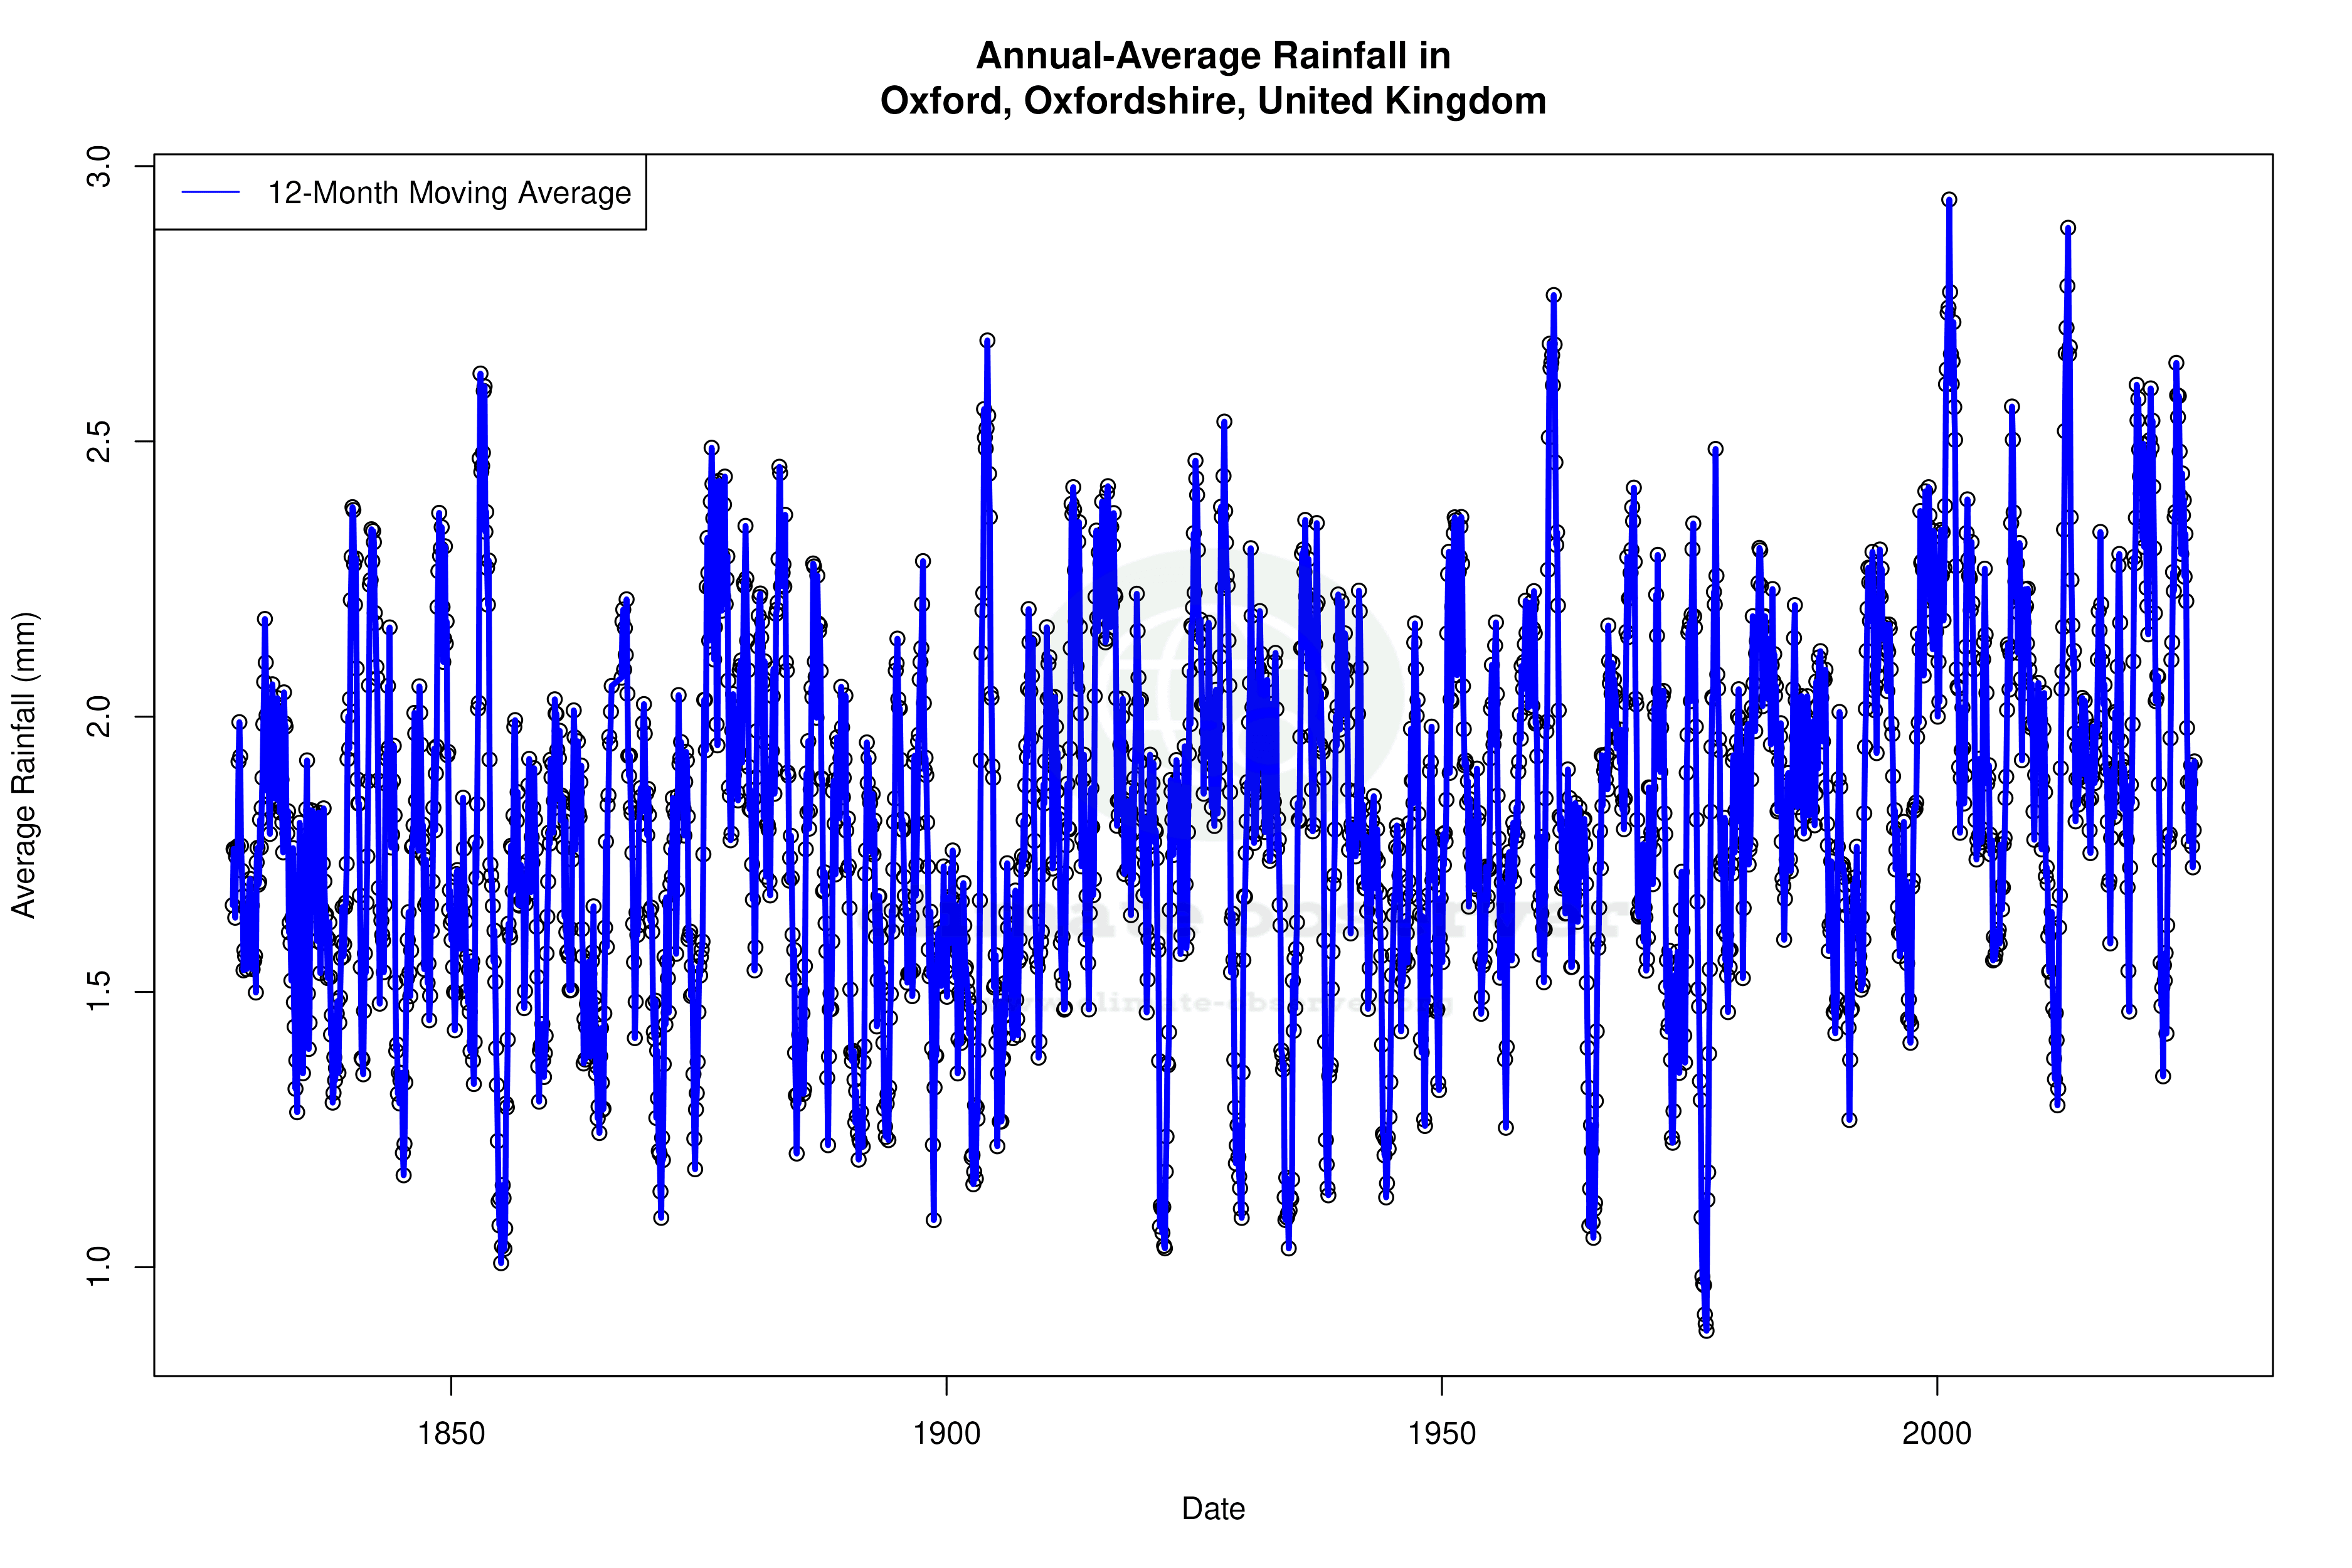
Precipitation Patterns and Concentration
The Precipitation Concentration Index (PCI) is a measure of how rainfall is distributed over time. A higher PCI indicates that precipitation is concentrated in fewer, more intense events. Oxford's PCI has increased slightly from a baseline of 10.9 to a current value of 11.2, suggesting a marginal shift towards more concentrated rainfall. While this change is not drastic, it points to a trend where rain may fall in heavier bursts, potentially leading to localized flooding or water management challenges.
Temperature Extremes and Records
Oxford has experienced notable temperature extremes, with a record high of 38.1°C (100.6°F) and a record low of -16.6°C (2.1°F). These extremes highlight the variability within the region's climate, which can be influenced by factors such as atmospheric circulation patterns and urban heat effects. The city's location in a relatively flat area, with the River Thames running through it, can also contribute to temperature variations and microclimatic conditions.
Regional Climate Goals and Implications
The United Kingdom has set ambitious climate goals to reduce greenhouse gas emissions and adapt to climate change impacts. Oxford's warming trends and changing precipitation patterns provide valuable data for these efforts. Understanding local climate dynamics is crucial for developing strategies to mitigate adverse effects, such as heatwaves or increased flood risk. Recent weather events, such as the summer heatwaves, underscore the importance of resilient infrastructure and adaptive planning to cope with these changes.
Local Geography and Climate Influence
Oxford's geographical setting plays a significant role in its climate profile. The absence of significant elevation changes and its proximity to the River Thames contribute to its temperate climate. This geography, combined with the urban environment, can exacerbate heat retention, leading to higher temperatures in built-up areas. The city's climate data, therefore, not only reflects natural trends but also the impact of human activities and urbanization on local weather patterns.
Station Statistics
10-Year Trend
High: +0.24 °C/decade
Low: +0.41 °C/decade
Rain: +0.15 mm/decade
25-Year Trend
High: +0.29 °C/decade
Low: +0.24 °C/decade
Rain: +0.04 mm/decade
50-Year Trend
High: +0.46 °C/decade
Low: +0.25 °C/decade
Rain: +0.05 mm/decade
All-Time Trend
High: +0.09 °C/decade
Low: +0.09 °C/decade
Rain: +0.01 mm/decade
Percentage Above-Average Days
Last 12 Months: 54.8%
This Year: 67.9%
Precipitation Concentration Index (PCI) ℹ️
Last 12 Months: 9.9
Historical Average: 10.2
Percentile Rank of Last 12 Months ℹ️
High: 98th percentile
Low: 96th percentile
Rain: 70th percentile
Change in Variance ℹ️
High: +0.4%
Low: -4.5%
Intraday: +10.9%
Data Coverage
81.0%
First Year of Data
1814
Station Location
Historical Weather Records
| Max High | Avg High | Min High | Max Avg | Avg Avg | Min Avg | Max Low | Avg Low | Min Low | Max Precipitation | Avg Precipitation | Max Snow | Avg Snow | |
|---|---|---|---|---|---|---|---|---|---|---|---|---|---|
| Record | 38.1 °C | — | -9.6 °C | 28.3 °C | — | -11.3 °C | 21.2 °C | — | -16.6 °C | 87.9 mm | — | — | — |
| January | 15.9 °C | 6.6 °C | -9.6 °C | 12.6 °C | 4.2 °C | -11.3 °C | 11.9 °C | 1.1 °C | -16.6 °C | 36.1 mm | 1.8 mm | — | — |
| February | 18.8 °C | 7.5 °C | -7.9 °C | 13.1 °C | 4.6 °C | -6.4 °C | 12.0 °C | 1.4 °C | -16.1 °C | 40.8 mm | 1.6 mm | — | — |
| March | 22.6 °C | 10.1 °C | -4.1 °C | 15.3 °C | 6.4 °C | -4.0 °C | 12.8 °C | 2.4 °C | -12.0 °C | 32.6 mm | 1.4 mm | — | — |
| April | 27.6 °C | 13.3 °C | 0.8 °C | 18.2 °C | 8.7 °C | 1.1 °C | 13.8 °C | 4.3 °C | -5.6 °C | 46.7 mm | 1.5 mm | — | — |
| May | 30.6 °C | 17.0 °C | 6.1 °C | 23.0 °C | 12.0 °C | 3.6 °C | 16.7 °C | 7.2 °C | -3.4 °C | 36.9 mm | 1.7 mm | — | — |
| June | 34.3 °C | 20.2 °C | 9.8 °C | 25.1 °C | 15.1 °C | 7.1 °C | 19.6 °C | 10.3 °C | 0.4 °C | 81.3 mm | 1.9 mm | — | — |
| July | 38.1 °C | 21.9 °C | 11.8 °C | 28.3 °C | 17.0 °C | 10.9 °C | 21.2 °C | 12.2 °C | 2.4 °C | 87.9 mm | 2.0 mm | — | — |
| August | 35.1 °C | 21.2 °C | 11.7 °C | 26.7 °C | 16.6 °C | 10.7 °C | 20.5 °C | 12.0 °C | 0.2 °C | 70.8 mm | 2.0 mm | — | — |
| September | 33.4 °C | 18.4 °C | 7.9 °C | 23.3 °C | 14.1 °C | 7.1 °C | 20.6 °C | 9.8 °C | -3.3 °C | 84.8 mm | 1.9 mm | — | — |
| October | 28.9 °C | 14.0 °C | 2.3 °C | 19.2 °C | 10.8 °C | 0.9 °C | 17.1 °C | 6.9 °C | -5.7 °C | 48.3 mm | 2.2 mm | — | — |
| November | 18.9 °C | 9.6 °C | -2.7 °C | 15.1 °C | 7.2 °C | -3.8 °C | 15.0 °C | 3.6 °C | -10.1 °C | 41.1 mm | 2.1 mm | — | — |
| December | 15.9 °C | 7.3 °C | -6.7 °C | 14.3 °C | 5.1 °C | -10.3 °C | 12.5 °C | 1.9 °C | -16.1 °C | 34.1 mm | 1.9 mm | — | — |
Data Visualisations
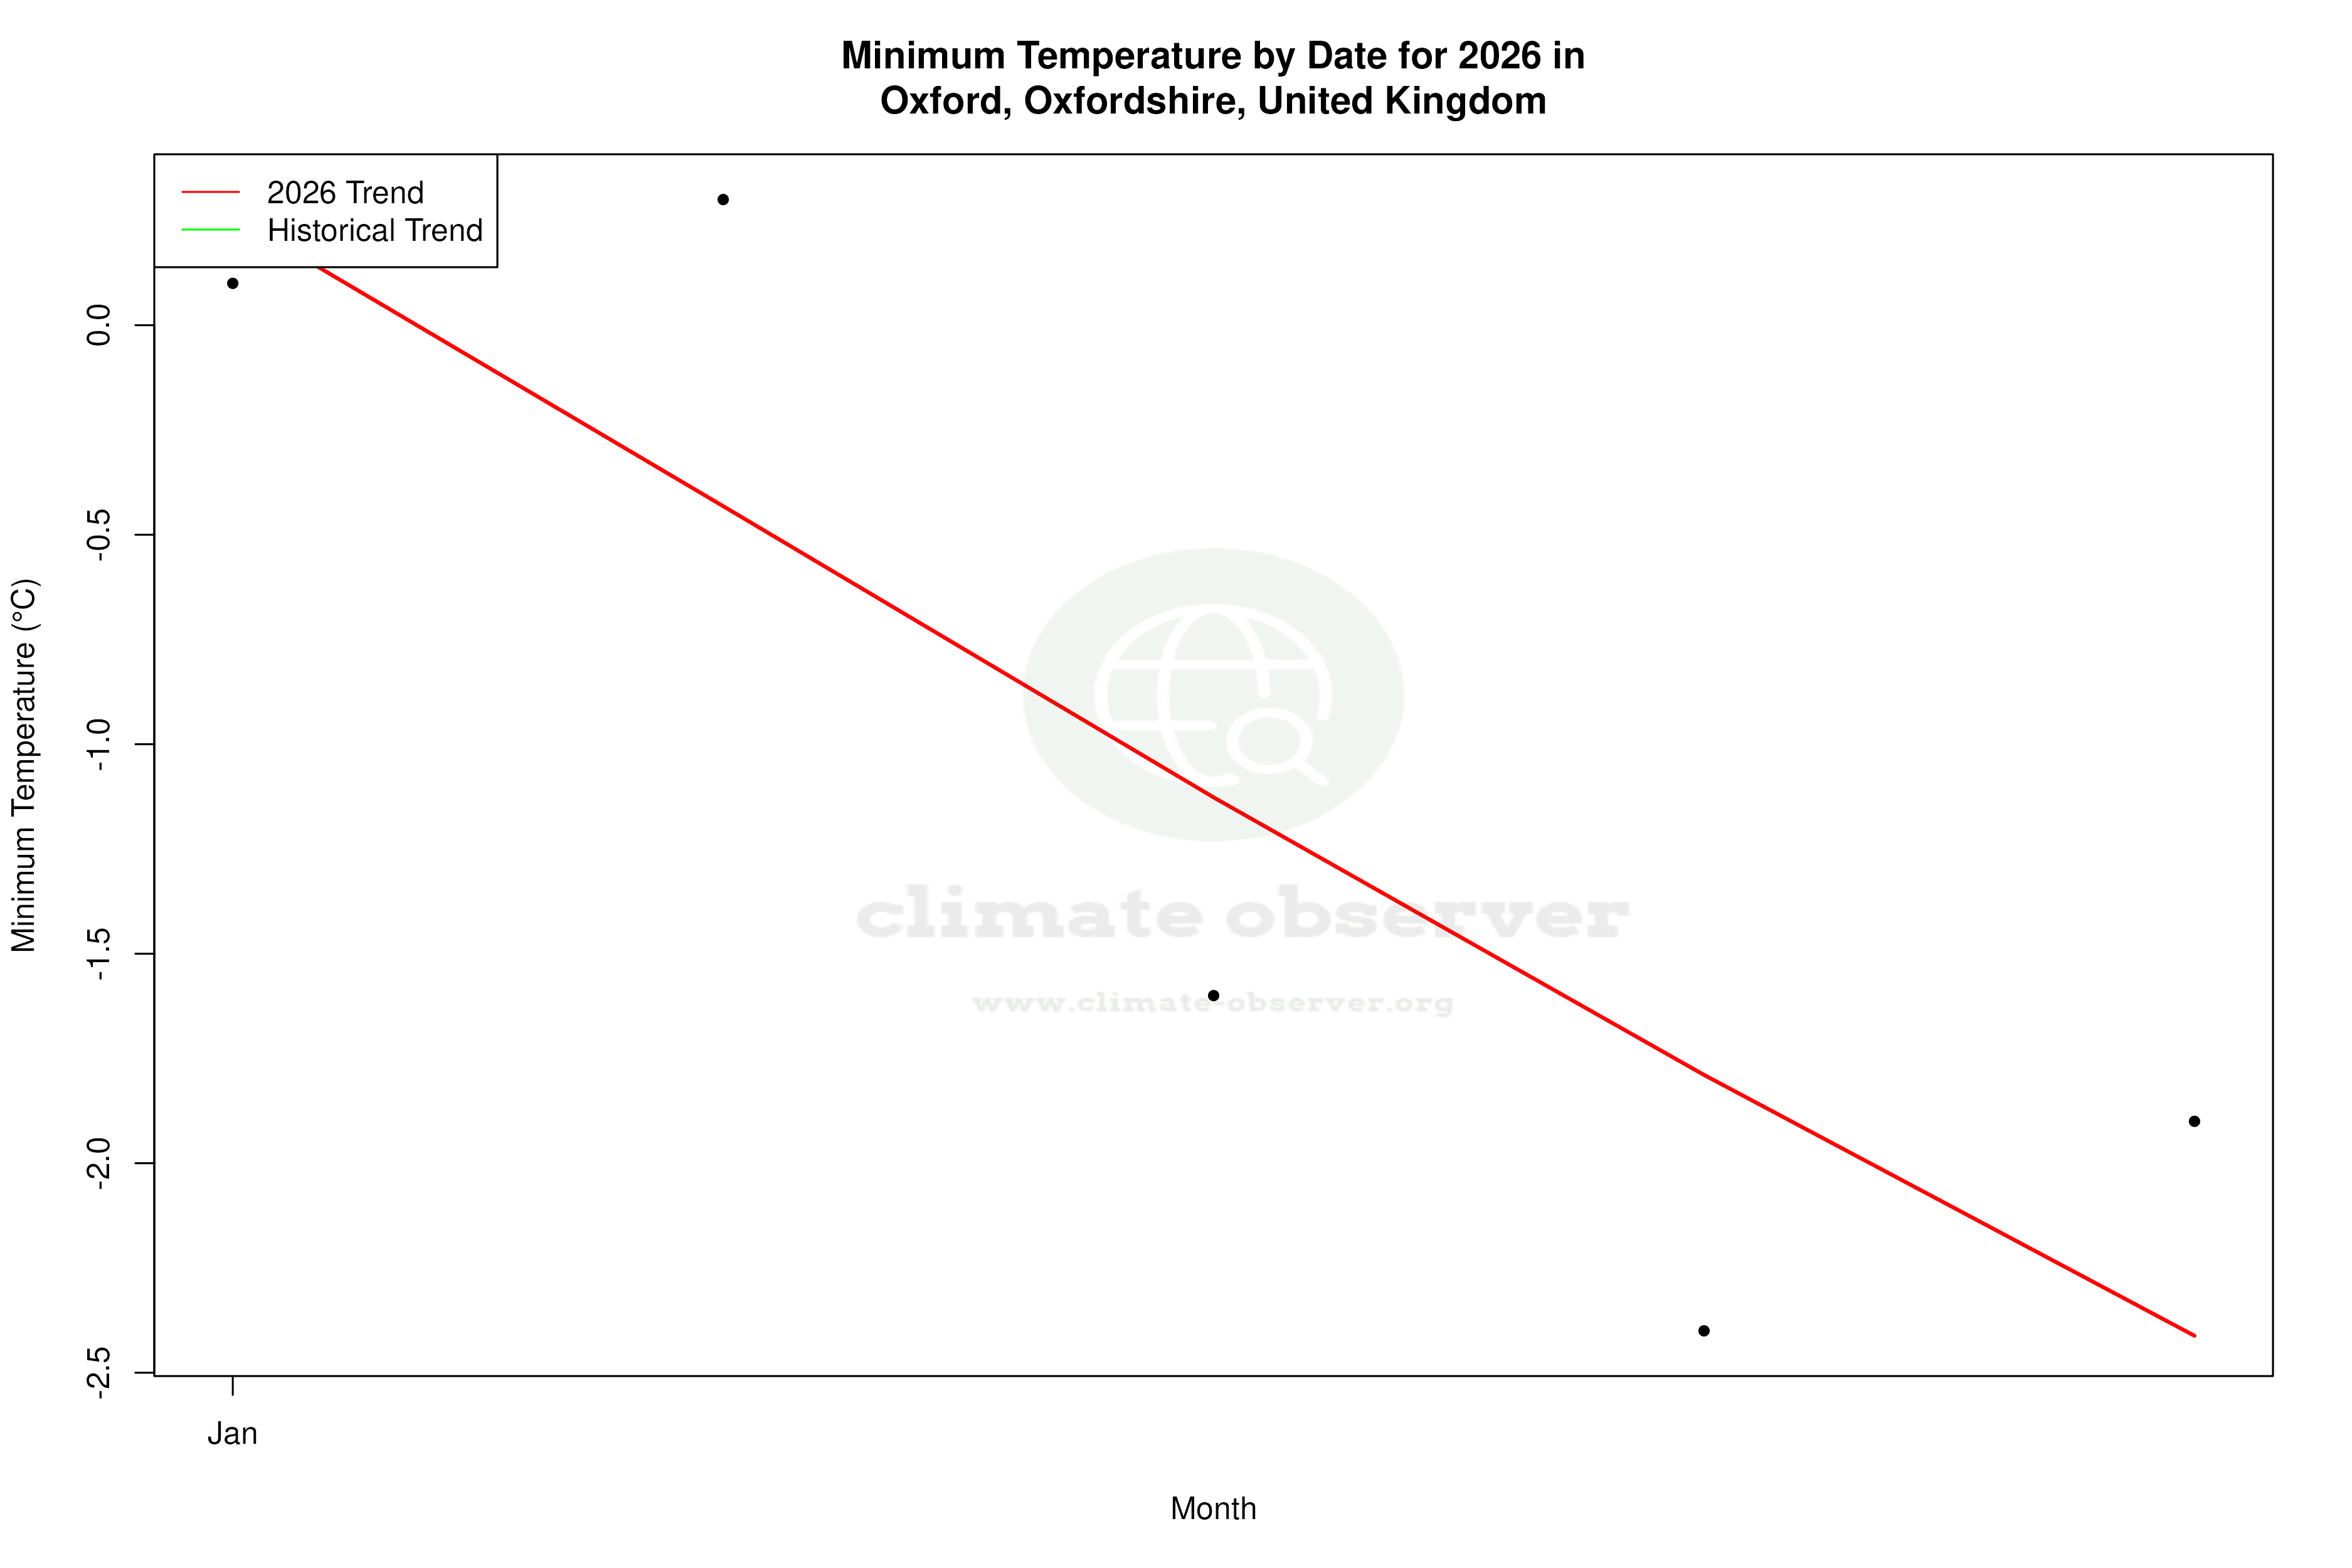
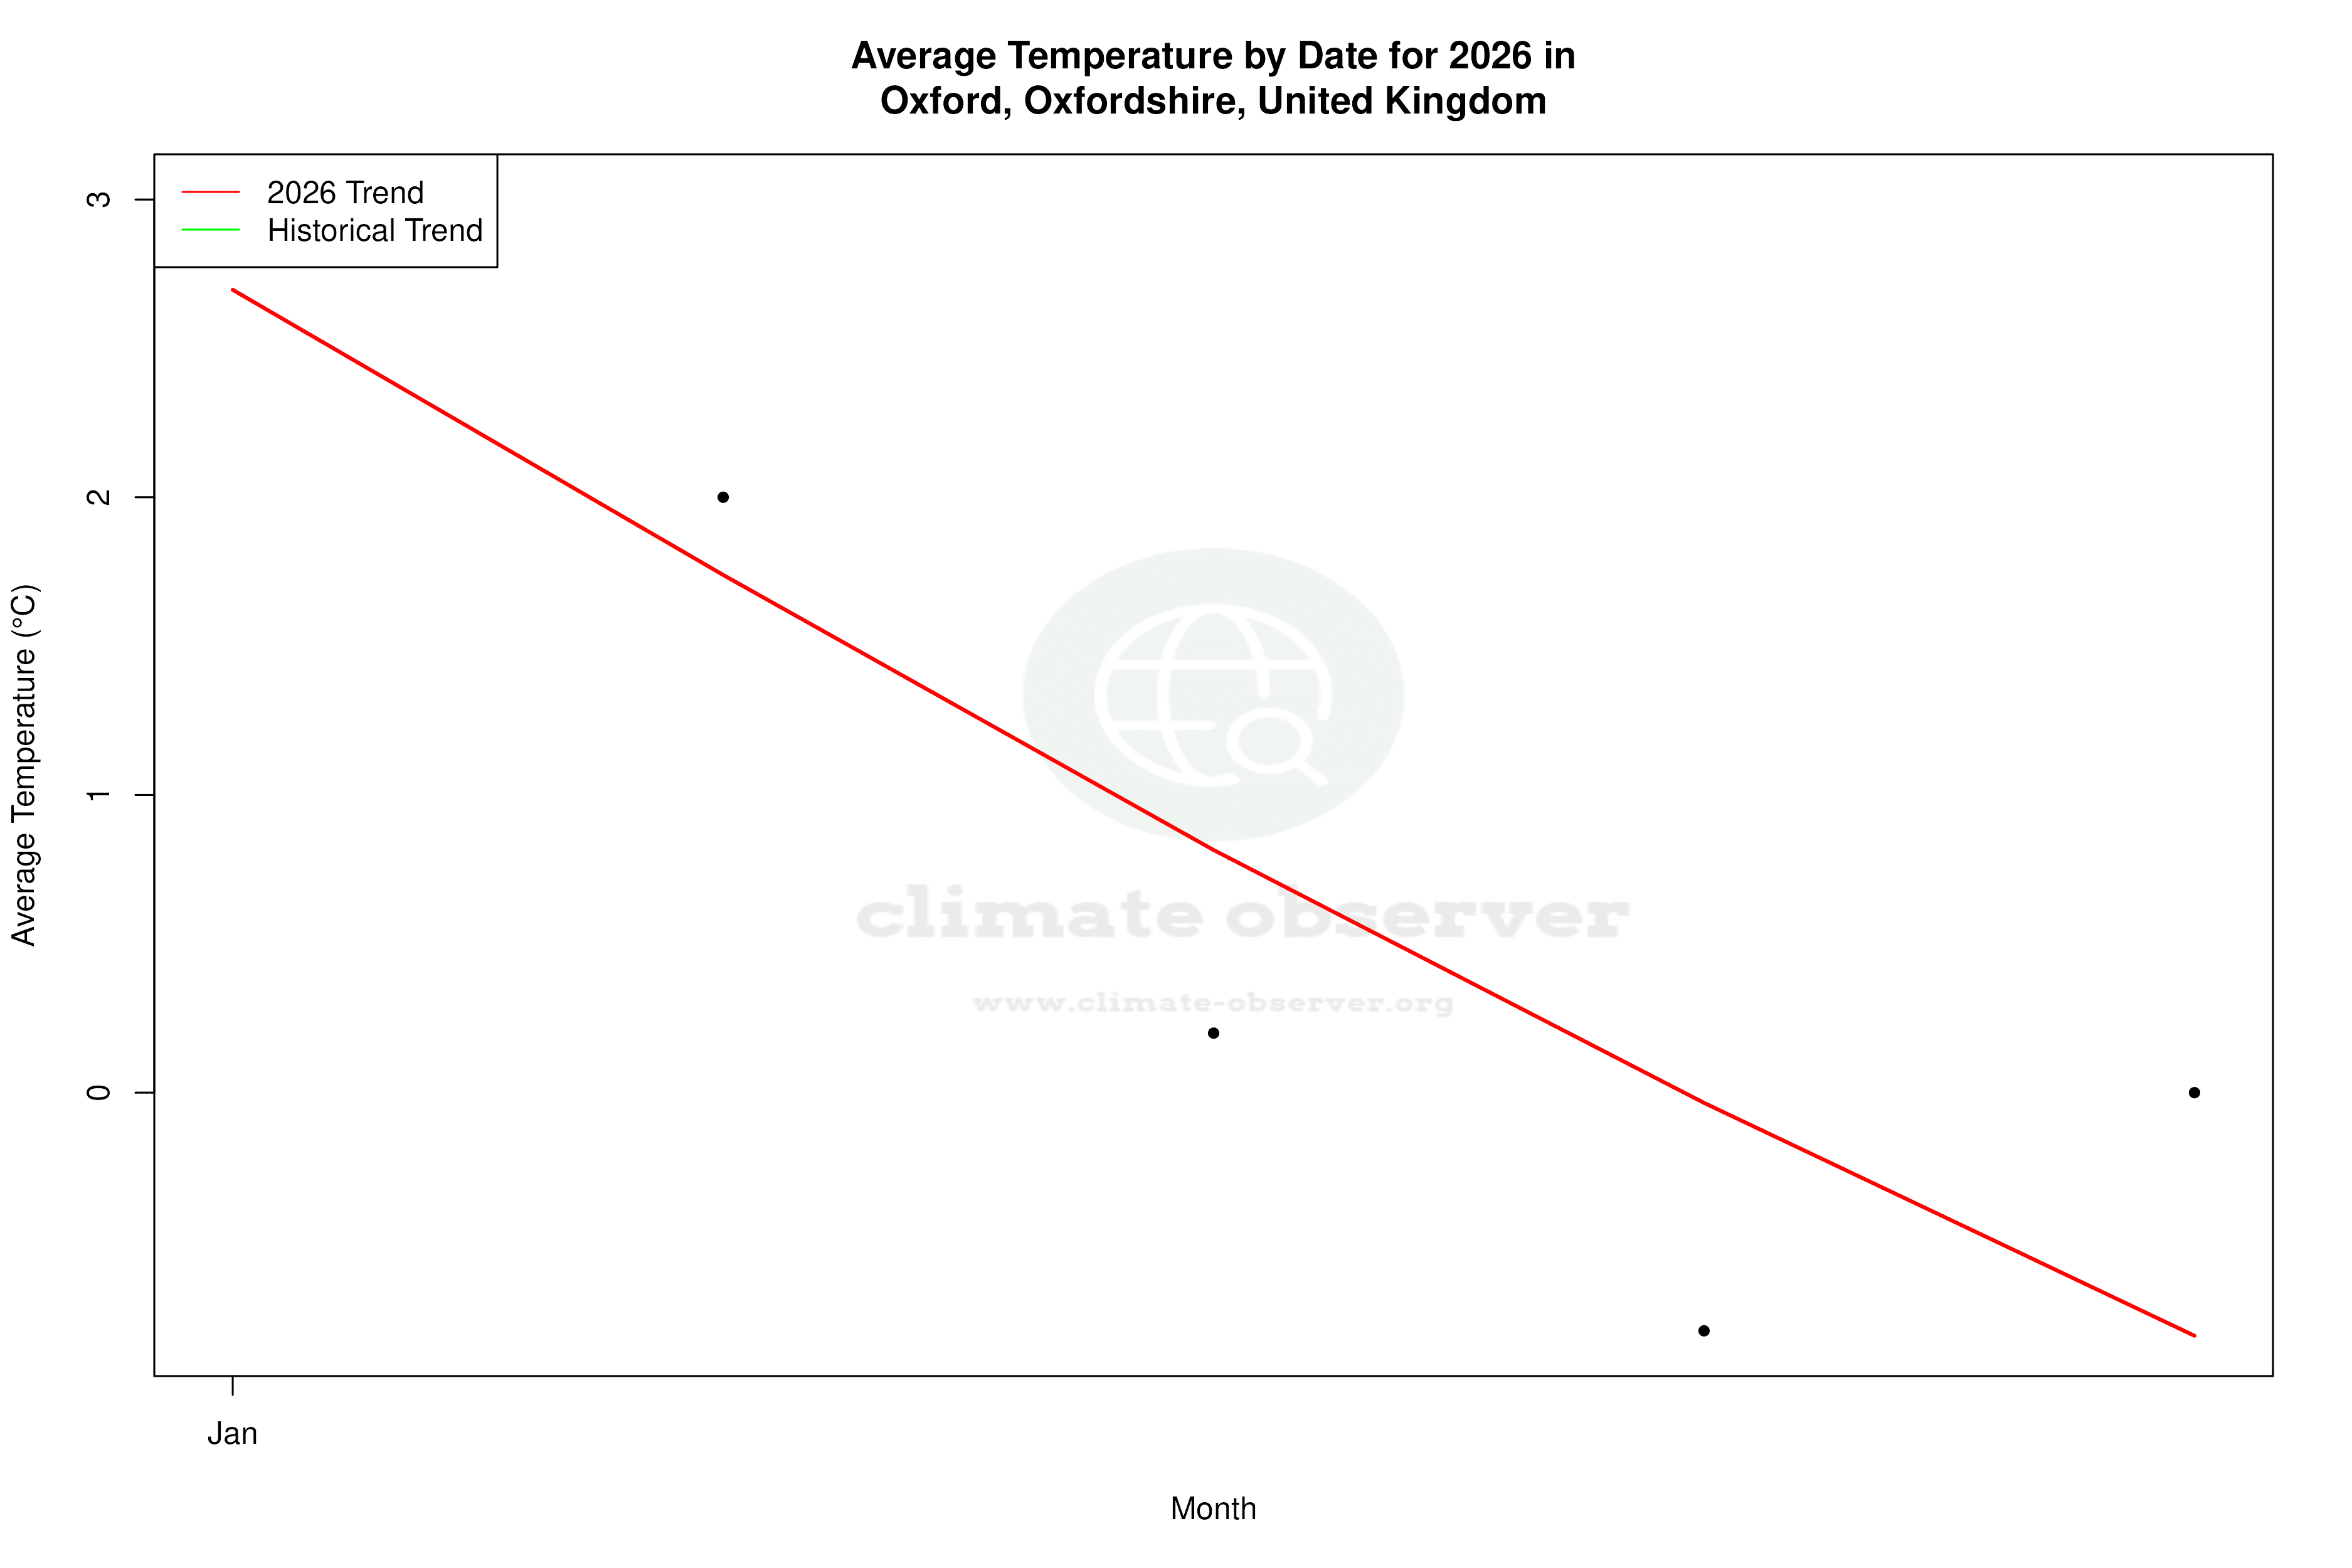
Remove WatermarksCurrent Year Climate Trends vs Historical
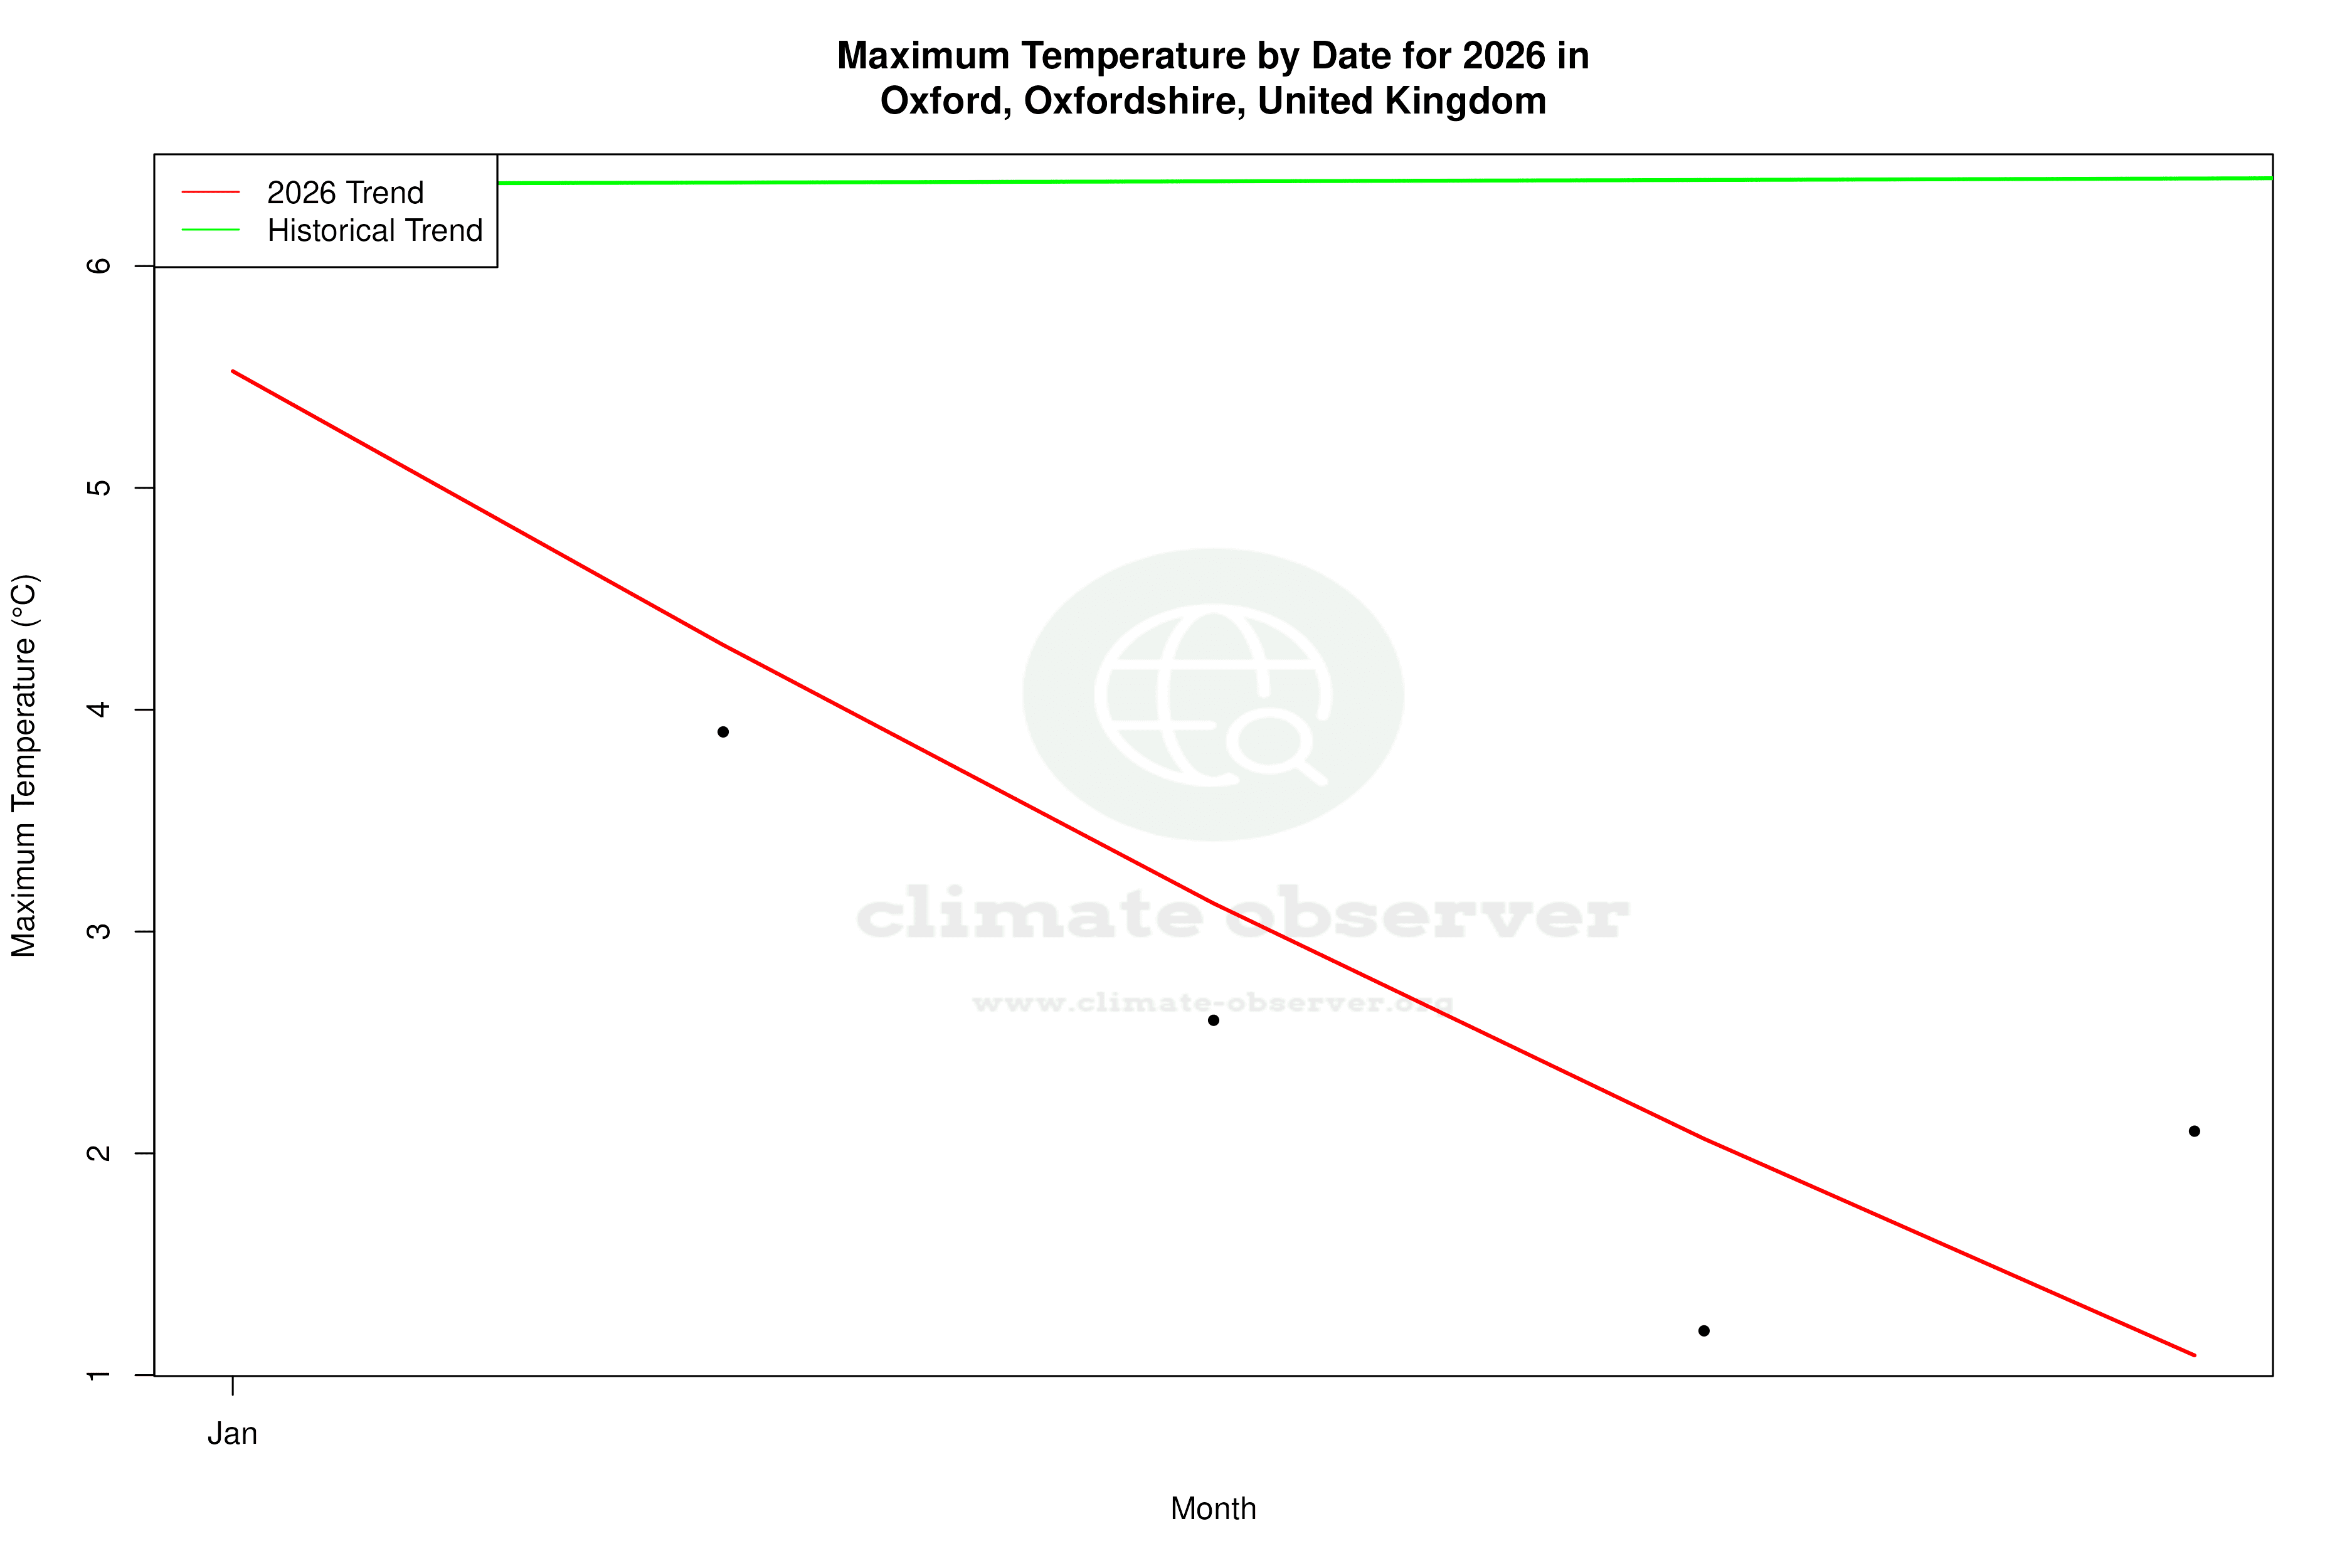


Max Temperature this Year | 1 of 6
Climate 12-Month Moving Averages

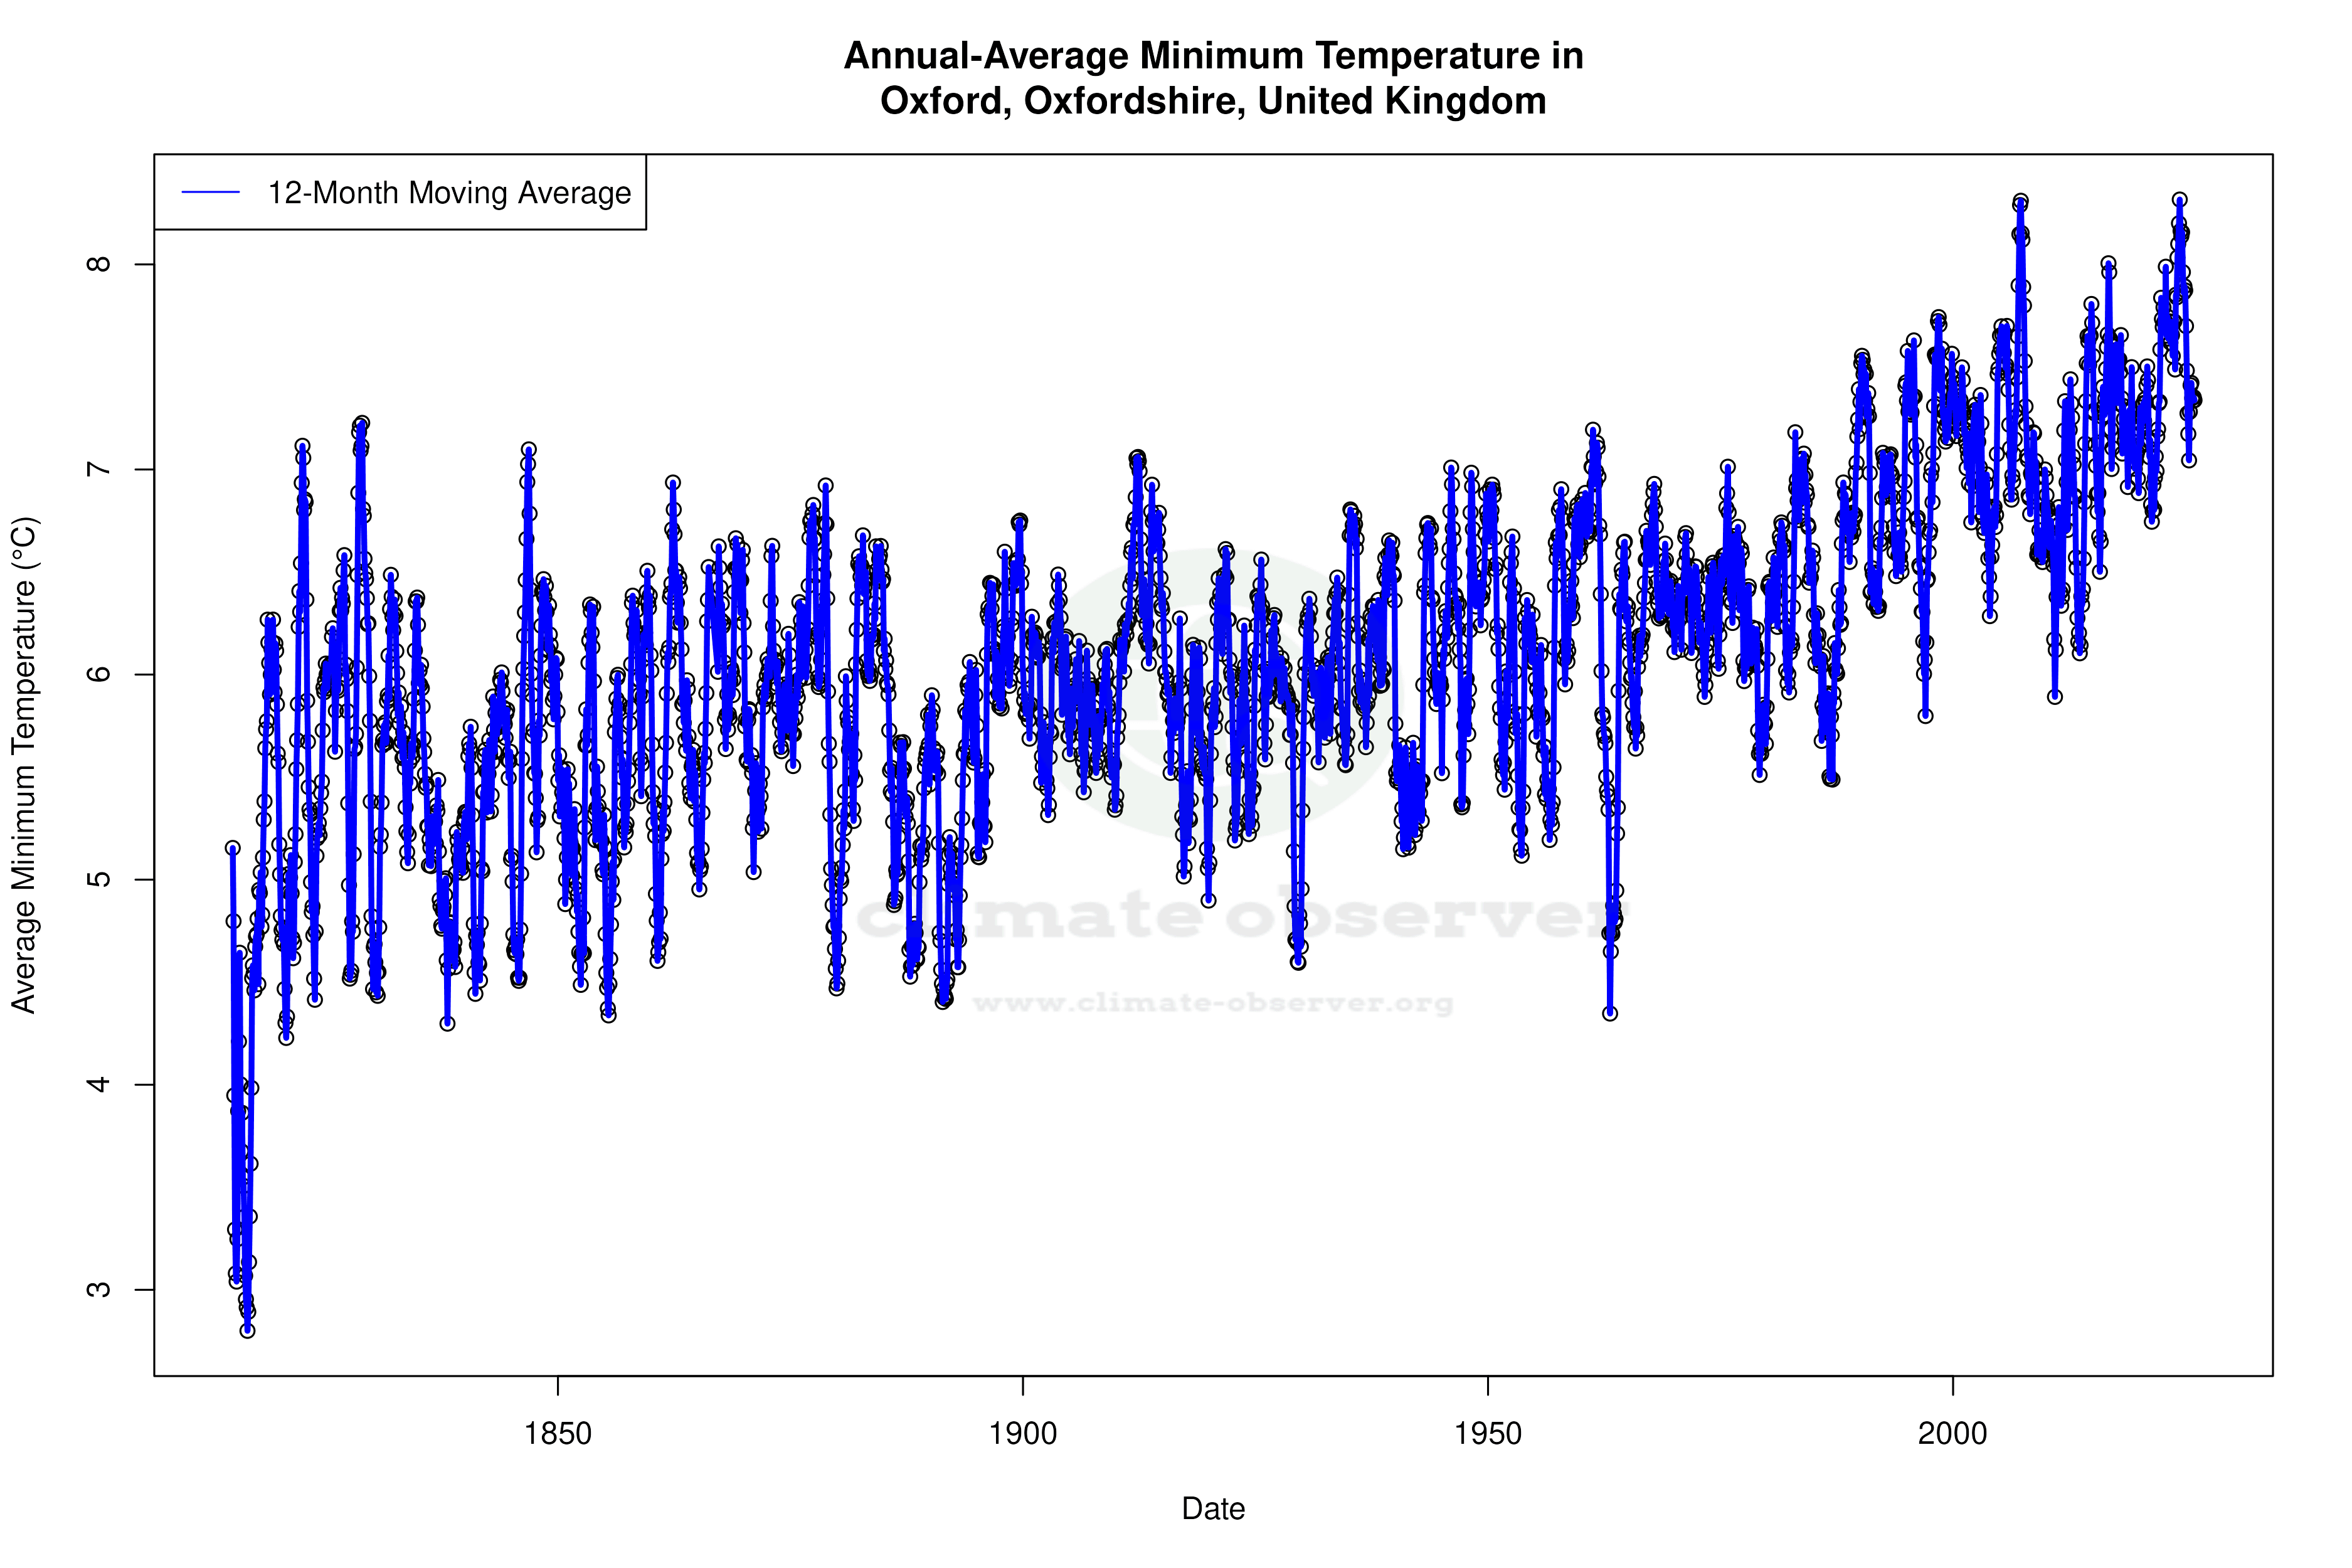


Max Temperature 12-Month MA | 1 of 6
Daily Data Points and Averages Throughout the Year

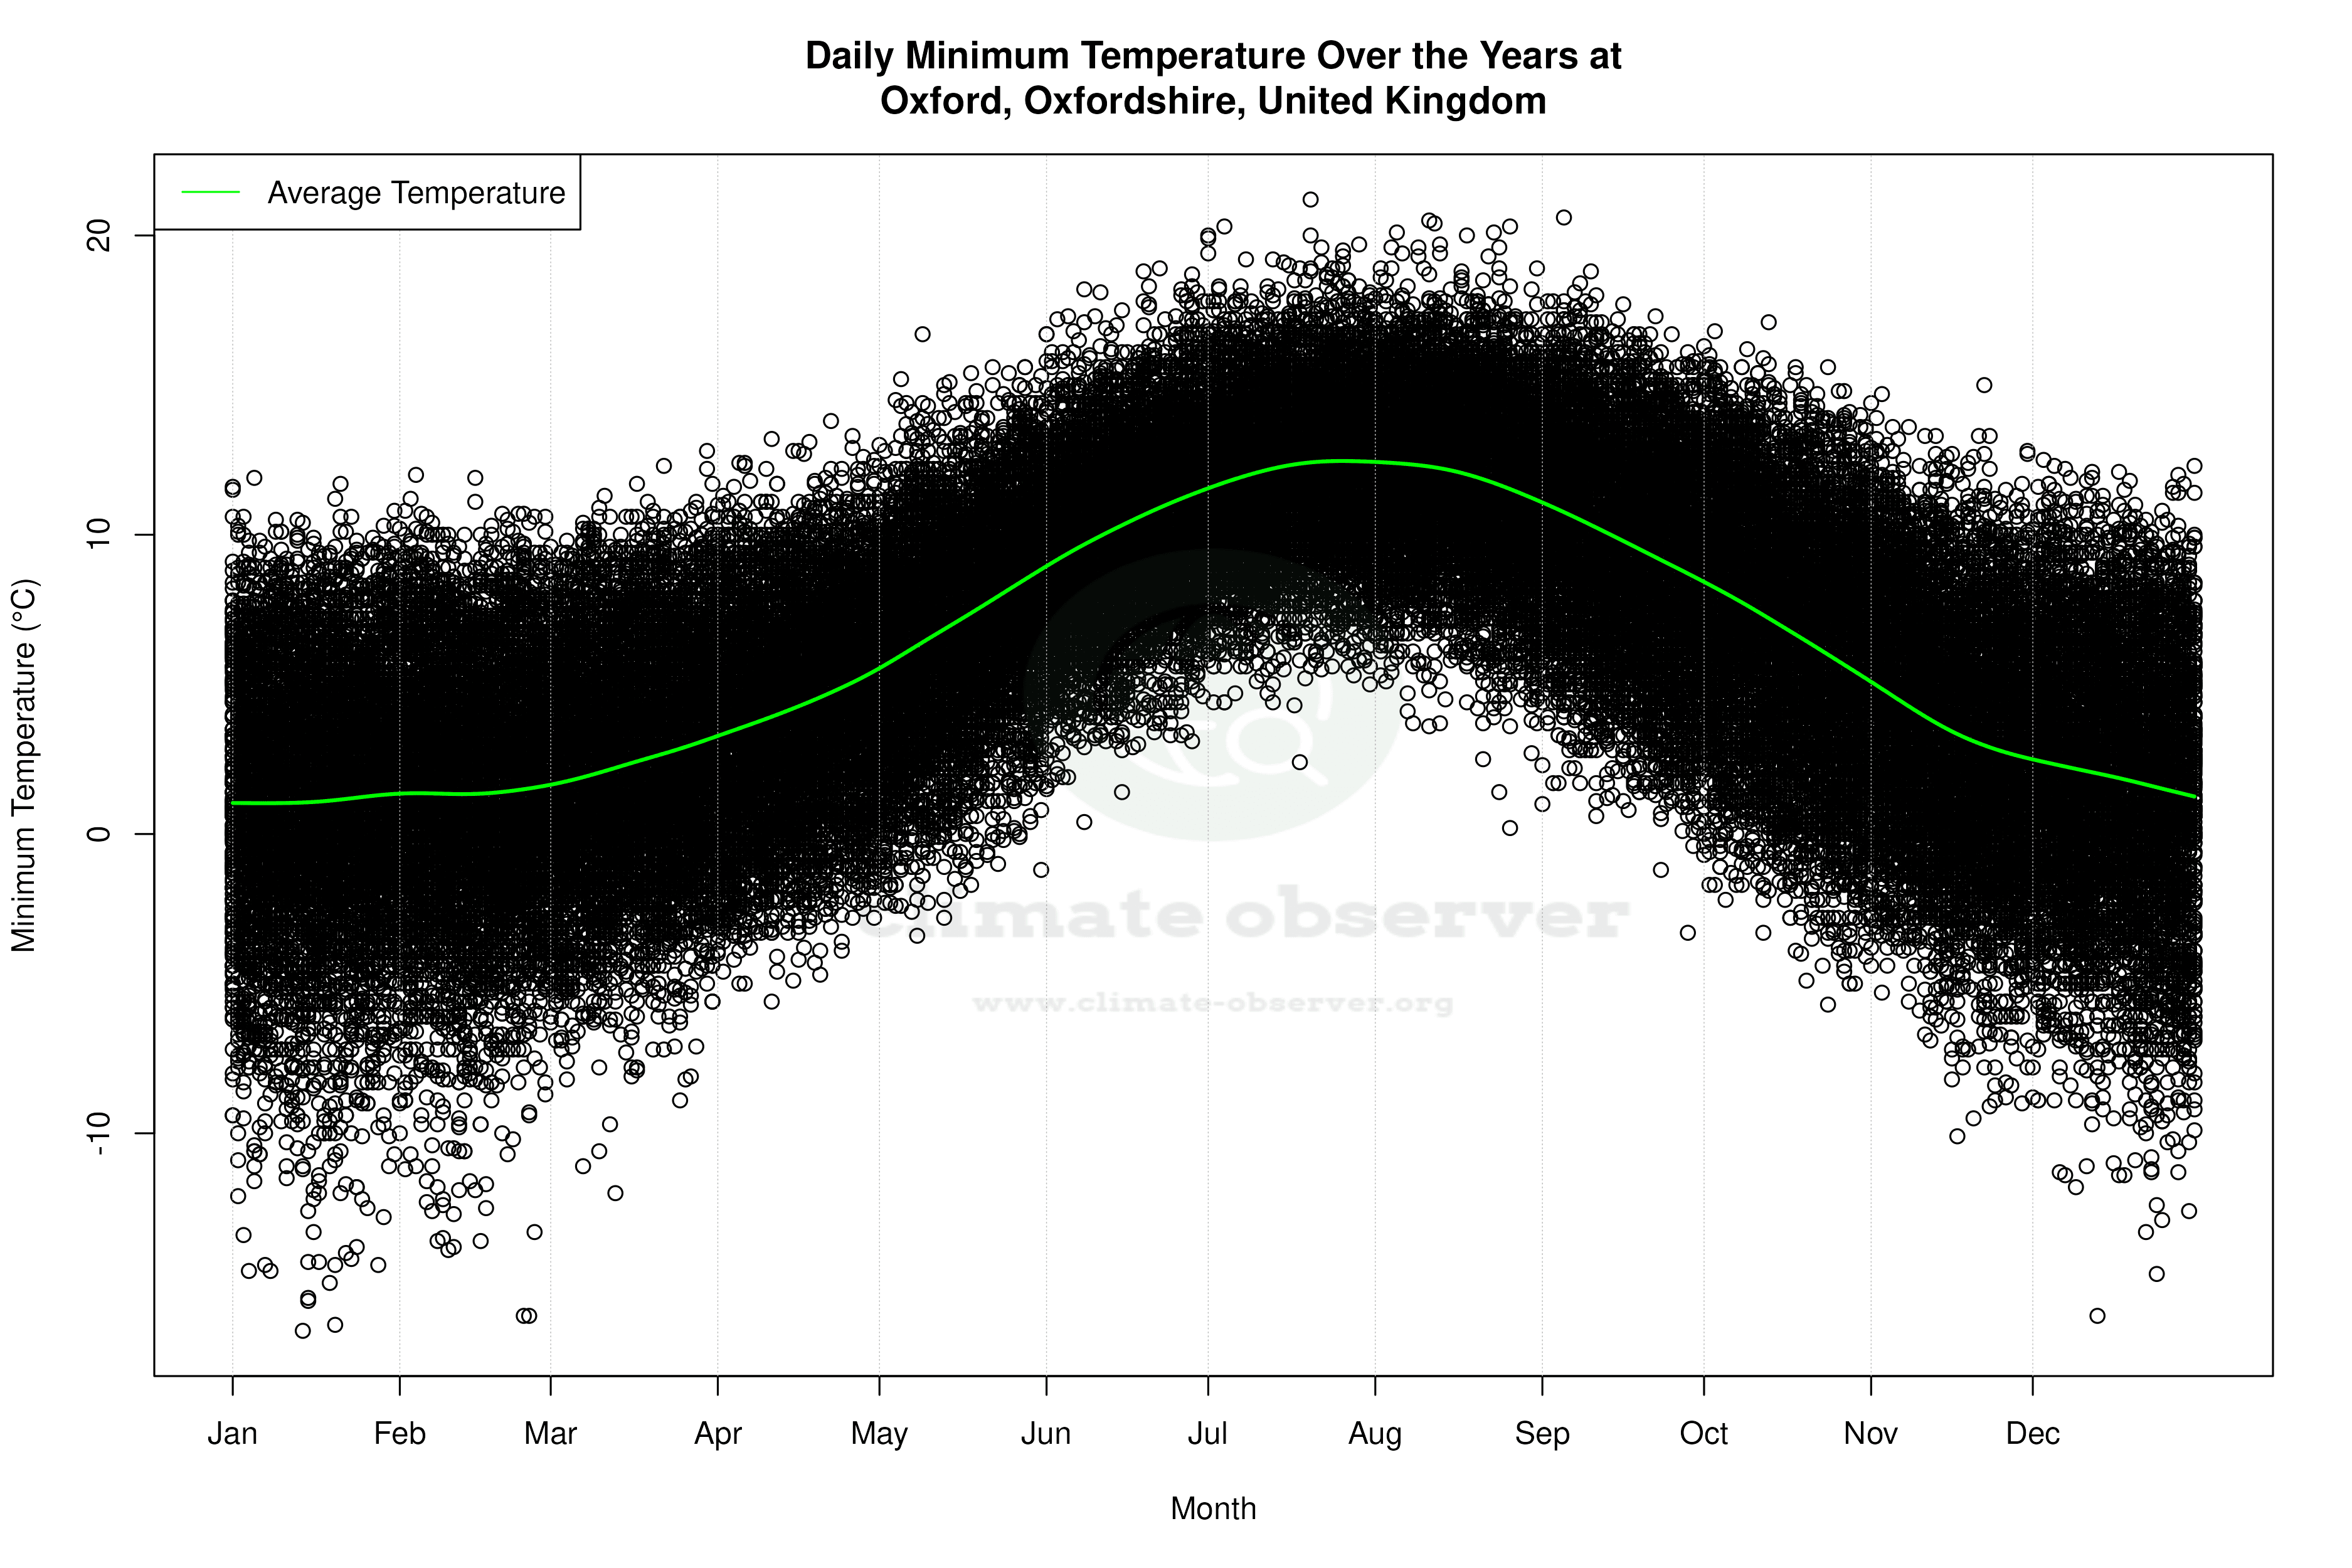


Average Max Temperature Throughout Year | 1 of 5
