Climate for Station: Edinburgh: Royal Botanic Garde, City of Edinburgh, United Kingdom
Loading live weather...
Climate Analysis & Overview
The Royal Botanic Garden Edinburgh is experiencing a warming trend, with both highs and lows increasing over the past decade and all-time records. Precipitation patterns have become slightly more evenly distributed, reflecting a minor change in the area's precipitation dynamics.
Temperate Maritime Climate Dynamics
Situated in the heart of Edinburgh, the Royal Botanic Garden is influenced by a temperate maritime climate, classified as Cfb according to the Köppen system. This classification is characterized by mild temperatures and moderate rainfall, largely due to the proximity of the North Sea. The garden's geographical position, nestled between the coast and the Scottish Highlands, creates a unique microclimate that is reflected in its weather data.
Warming Trends in Edinburgh
Over the past decade, the garden has seen a notable warming trend. The average high temperatures have increased by 0.83°C (1.49°F), while the lows have risen by 0.72°C (1.30°F). These changes are more pronounced than the all-time trends, which show a rise of 0.29°C (0.52°F) for highs and 0.23°C (0.41°F) for lows. This suggests an acceleration in warming over recent years, aligning with broader regional climate patterns across the United Kingdom.
Record Extremes and Temperature Variability
The garden has recorded a maximum temperature of 31.0°C (87.8°F), indicating the potential for significant heat events even in this typically mild region. Conversely, the minimum recorded temperature stands at -15.5°C (4.1°F), highlighting the variability in seasonal extremes. These records underscore the garden's capacity to experience a broad range of temperatures, influenced by both local and regional atmospheric conditions.
Precipitation Patterns and Distribution
The Precipitation Concentration Index (PCI) for the garden has shown a slight decrease from a baseline of 10.72 to a current value of 9.93. This change indicates a more even distribution of rainfall events, suggesting that precipitation is becoming less concentrated in intense downpours. Such a shift, although minor, could have implications for local water management and garden maintenance practices.
Implications for Regional Climate Goals
The observed warming trends and changes in precipitation distribution at the Royal Botanic Garden Edinburgh are consistent with the broader climate objectives of the United Kingdom, which aims to mitigate climate change impacts through adaptation and resilience strategies. Recent weather events, such as the increased frequency of heatwaves, further emphasize the need for continued monitoring and strategic planning to address these evolving climatic conditions.
Station Statistics
10-Year Trend
High: +0.67 °C/decade
Low: +0.68 °C/decade
Rain: -0.03 mm/decade
25-Year Trend
High: +0.28 °C/decade
Low: +0.17 °C/decade
Rain: +0.01 mm/decade
50-Year Trend
High: +0.32 °C/decade
Low: +0.23 °C/decade
Rain: +0.11 mm/decade
All-Time Trend
High: +0.28 °C/decade
Low: +0.23 °C/decade
Rain: +0.15 mm/decade
Percentage Above-Average Days
Last 12 Months: 50.7%
This Year: 35.3%
Precipitation Concentration Index (PCI) ℹ️
Last 12 Months: 9.4
Historical Average: 9.9
Percentile Rank of Last 12 Months ℹ️
High: 96th percentile
Low: 93rd percentile
Rain: 40th percentile
Change in Variance ℹ️
High: +3.8%
Low: +2.3%
Intraday: +4.8%
Data Coverage
94.3%
First Year of Data
1959
Station Location
Historical Weather Records
| Max High | Avg High | Min High | Max Avg | Avg Avg | Min Avg | Max Low | Avg Low | Min Low | Max Precipitation | Avg Precipitation | Max Snow | Avg Snow | |
|---|---|---|---|---|---|---|---|---|---|---|---|---|---|
| Record | 31.0 °C | — | -3.5 °C | 23.0 °C | — | -13.0 °C | 18.9 °C | — | -15.5 °C | 58.4 mm | — | — | — |
| January | 15.0 °C | 6.9 °C | -3.5 °C | 12.3 °C | 3.8 °C | -13.0 °C | 12.5 °C | 1.1 °C | -15.5 °C | 33.3 mm | 2.1 mm | — | — |
| February | 16.0 °C | 7.5 °C | -0.7 °C | 13.1 °C | 4.1 °C | -9.6 °C | 12.3 °C | 1.3 °C | -10.7 °C | 33.0 mm | 1.9 mm | — | — |
| March | 21.6 °C | 9.4 °C | 0.0 °C | 14.1 °C | 5.5 °C | -3.1 °C | 11.7 °C | 2.6 °C | -11.1 °C | 38.5 mm | 1.8 mm | — | — |
| April | 24.1 °C | 11.8 °C | 2.8 °C | 15.9 °C | 7.3 °C | -0.1 °C | 13.6 °C | 4.2 °C | -5.0 °C | 24.6 mm | 1.7 mm | — | — |
| May | 29.0 °C | 14.8 °C | 6.1 °C | 18.7 °C | 10.2 °C | 2.5 °C | 14.1 °C | 6.8 °C | -2.4 °C | 36.8 mm | 1.9 mm | — | — |
| June | 27.8 °C | 17.4 °C | 8.5 °C | 21.0 °C | 13.0 °C | 5.6 °C | 17.2 °C | 9.7 °C | 1.1 °C | 31.8 mm | 2.1 mm | — | — |
| July | 31.0 °C | 19.0 °C | 11.1 °C | 23.0 °C | 14.9 °C | 10.0 °C | 18.8 °C | 11.4 °C | 4.4 °C | 40.6 mm | 2.3 mm | — | — |
| August | 30.0 °C | 18.7 °C | 11.9 °C | 21.2 °C | 14.6 °C | 9.5 °C | 18.9 °C | 11.2 °C | 3.0 °C | 48.5 mm | 2.5 mm | — | — |
| September | 26.8 °C | 16.5 °C | 8.9 °C | 20.7 °C | 12.5 °C | 4.8 °C | 18.1 °C | 9.4 °C | -0.7 °C | 50.8 mm | 2.3 mm | — | — |
| October | 22.1 °C | 13.3 °C | 5.3 °C | 17.8 °C | 9.6 °C | -0.5 °C | 15.8 °C | 6.7 °C | -4.6 °C | 58.4 mm | 2.7 mm | — | — |
| November | 17.8 °C | 9.4 °C | 0.0 °C | 15.5 °C | 6.3 °C | -6.0 °C | 14.1 °C | 3.2 °C | -7.2 °C | 34.3 mm | 2.4 mm | — | — |
| December | 15.8 °C | 7.4 °C | -3.4 °C | 13.3 °C | 4.3 °C | -11.7 °C | 11.6 °C | 1.4 °C | -11.5 °C | 29.6 mm | 2.2 mm | — | — |
Data Visualisations
Remove WatermarksCurrent Year Climate Trends vs Historical

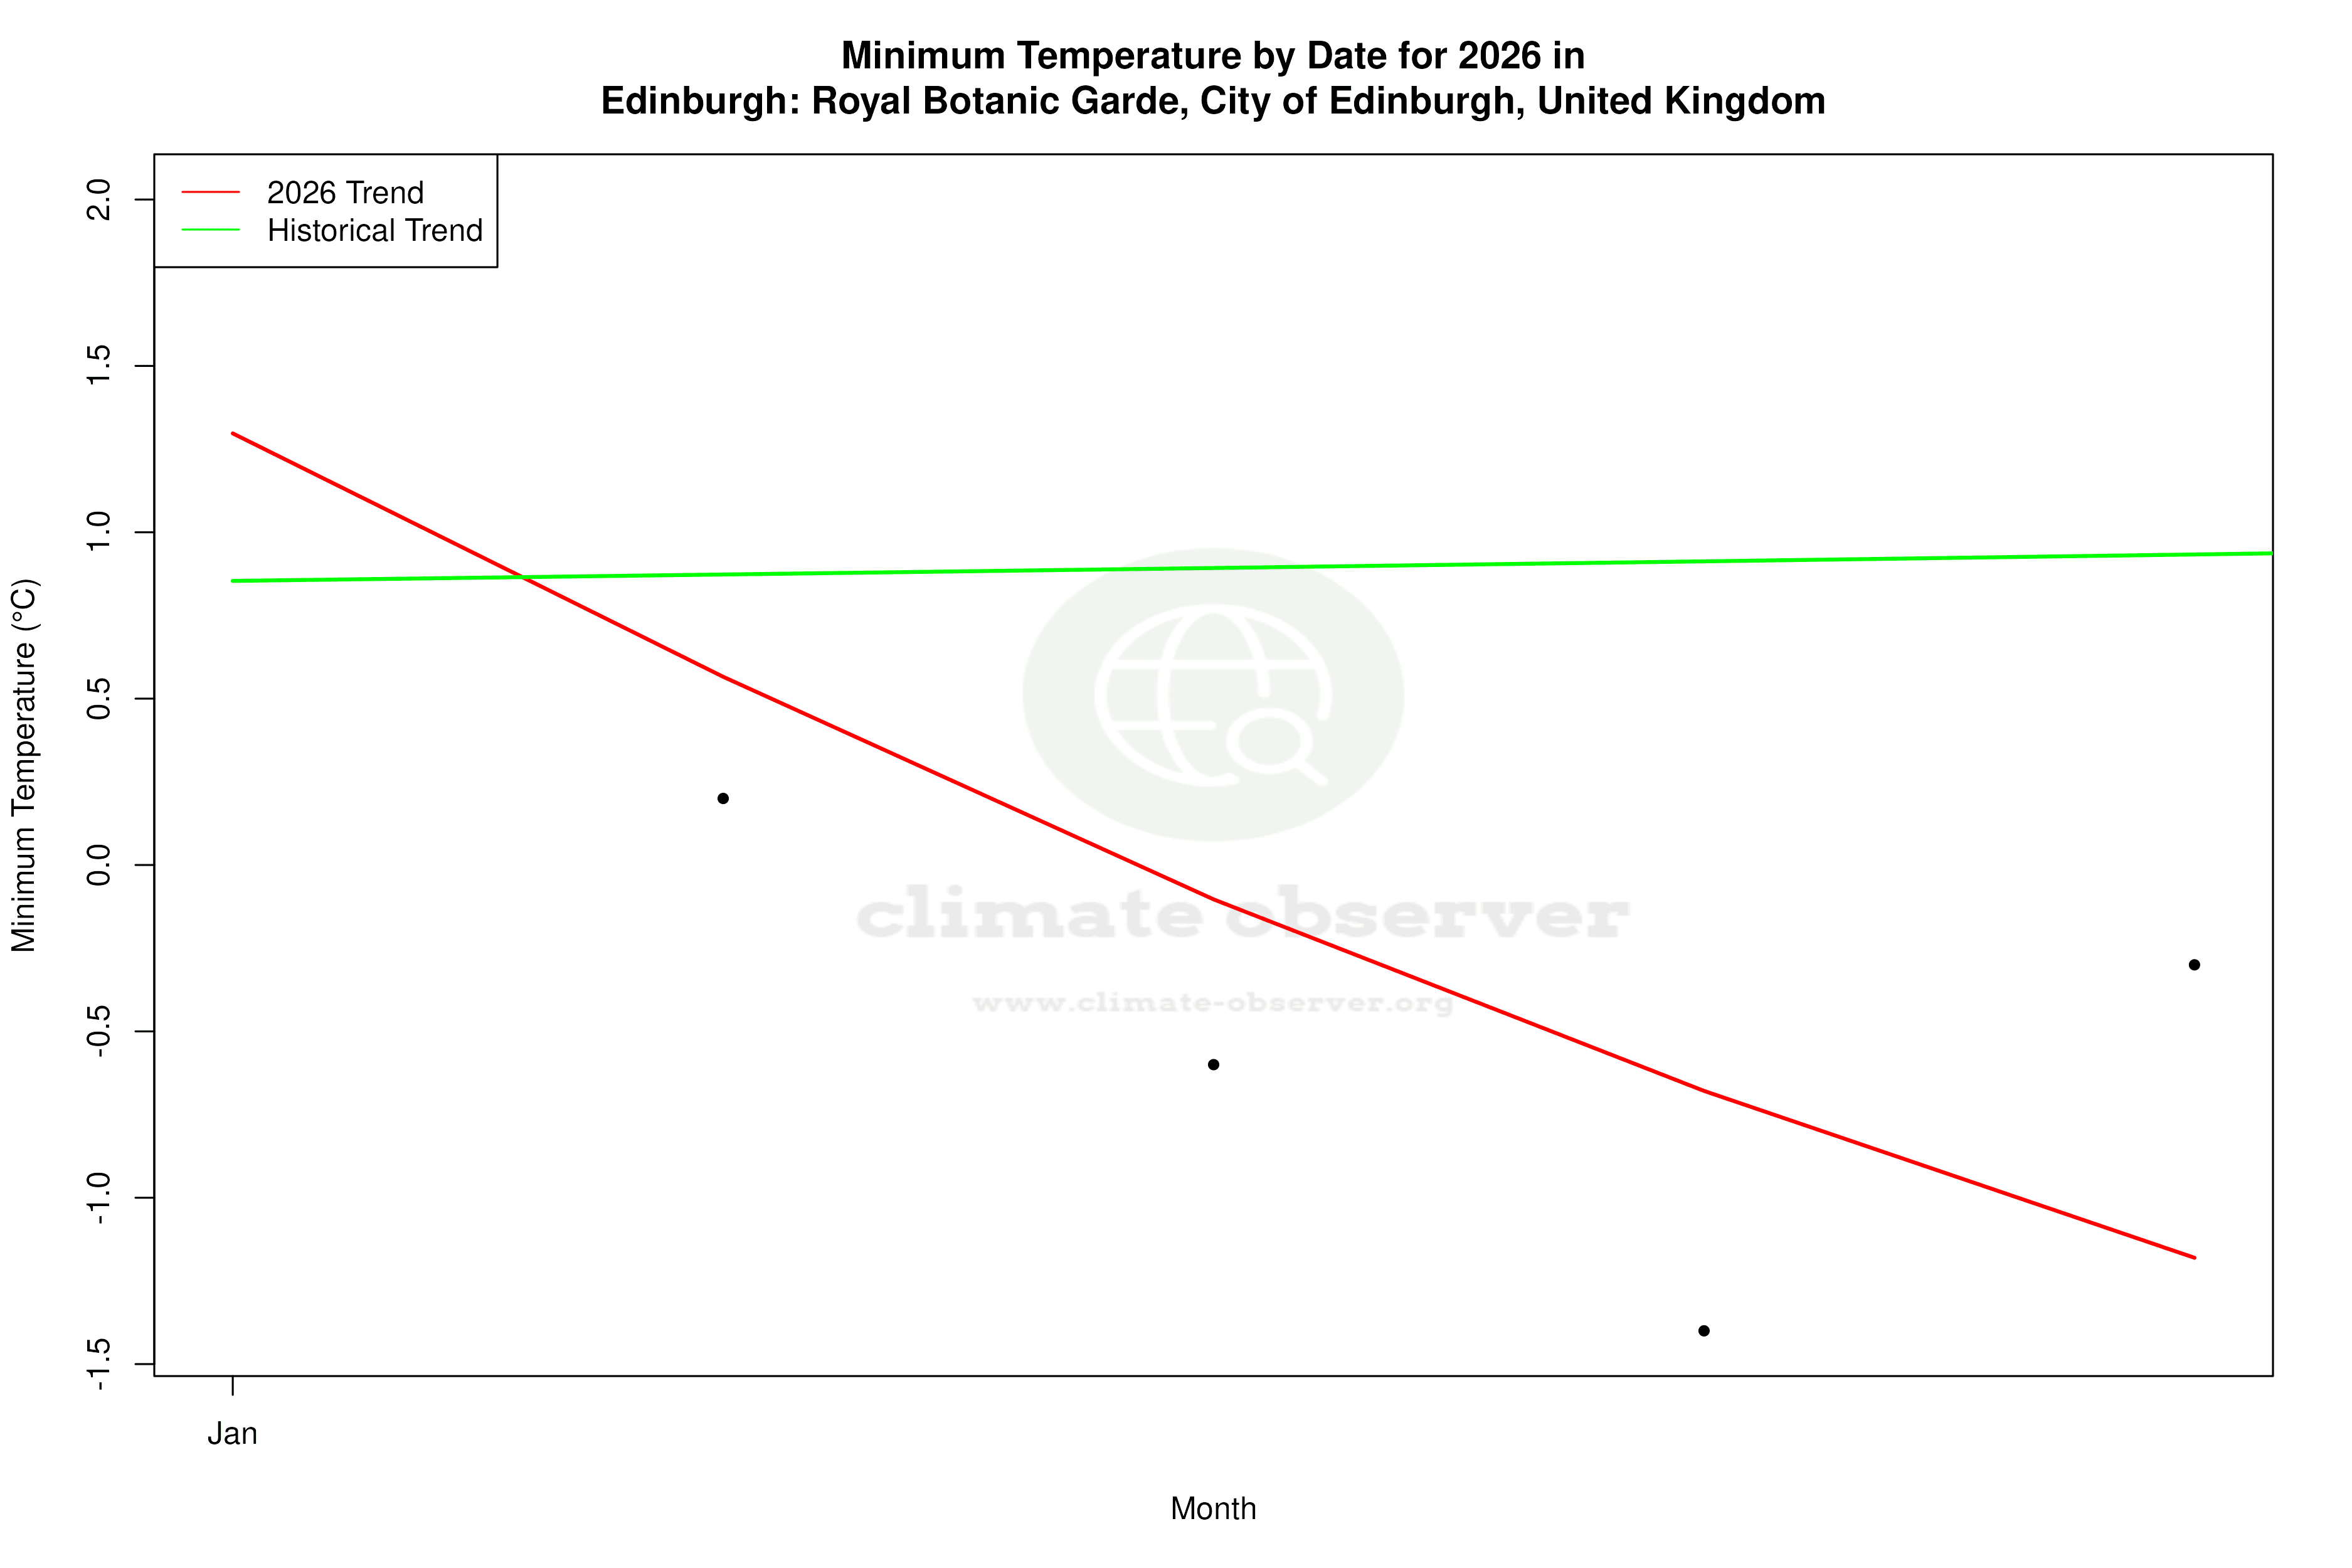


Max Temperature this Year | 1 of 6
Climate 12-Month Moving Averages


Max Temperature 12-Month MA | 1 of 6
Daily Data Points and Averages Throughout the Year


Average Max Temperature Throughout Year | 1 of 5
