Climate for Station: Yeovilton, Somerset, United Kingdom
Loading live weather...
Climate Analysis & Overview
Yeovilton is experiencing a warming trend, with both highs and lows rising over the past decade and historically. The slight decrease in the Precipitation Concentration Index suggests a more even distribution of rainfall, aligning with regional climate goals for sustainable water management.
Climate Classification and Geographic Influence
Yeovilton, located at 51.0058° N, -2.64° W, falls under the Köppen climate classification of Cfb, indicating a temperate oceanic climate. This classification is characterized by mild temperatures and fairly even precipitation throughout the year. The station's proximity to the Bristol Channel and the surrounding Somerset Levels contribute to its moderate climate, with the maritime influence providing a buffer against extreme temperature fluctuations. The nearby Mendip Hills can occasionally alter local weather patterns by influencing wind and precipitation distribution.
Temperature Trends: A Warming Trajectory
Over the past decade, Yeovilton has seen an increase in both high and low temperatures, with highs rising by 0.63°C (1.13°F) and lows by 0.59°C (1.06°F). Historically, the all-time temperature trends also show a warming pattern, with highs increasing by 0.29°C (0.52°F) and lows by 0.28°C (0.50°F). These trends reflect a consistent rise in temperatures, mirroring broader patterns observed across the United Kingdom. The record temperatures at Yeovilton, with a maximum of 35.0°C (95.0°F) and a minimum of -16.1°C (3.0°F), highlight the station's capacity for significant temperature extremes despite its generally moderate climate.
Precipitation Patterns: A More Even Distribution
The Precipitation Concentration Index (PCI) at Yeovilton has experienced a marginal decrease from a baseline of 11.24 to a current value of 11.06. The PCI is a measure of how precipitation is distributed over time; a lower value indicates a more even distribution of rainfall events. This slight decrease suggests that Yeovilton is experiencing more consistent rainfall throughout the year, which can be beneficial for agriculture and water resource management. This change aligns with regional climate initiatives aimed at achieving more sustainable water use.
Regional Climate Context and Goals
The United Kingdom has been actively pursuing climate goals that focus on reducing carbon emissions and adapting to changing weather patterns. The warming trends observed at Yeovilton are consistent with national observations and underscore the importance of these goals. Recent weather events, such as increased frequency of heatwaves, have highlighted the need for adaptive strategies in infrastructure and public health. The more even distribution of precipitation at Yeovilton may aid in mitigating some of the adverse effects of these changes, such as drought and flooding, by providing a steadier supply of water resources.
Station Statistics
10-Year Trend
High: -0.19 °C/decade
Low: +0.23 °C/decade
Rain: +0.11 mm/decade
25-Year Trend
High: +0.37 °C/decade
Low: +0.27 °C/decade
Rain: -0.03 mm/decade
50-Year Trend
High: +0.32 °C/decade
Low: +0.28 °C/decade
Rain: +0.05 mm/decade
All-Time Trend
High: +0.27 °C/decade
Low: +0.26 °C/decade
Rain: +0.06 mm/decade
Percentage Above-Average Days
Last 12 Months: 58.9%
This Year: 46.2%
Precipitation Concentration Index (PCI) ℹ️
Last 12 Months: 11.8
Historical Average: 11.5
Percentile Rank of Last 12 Months ℹ️
High: 79th percentile
Low: 81st percentile
Rain: 45th percentile
Change in Variance ℹ️
High: +2.6%
Low: +0.4%
Intraday: +13.0%
Data Coverage
95.8%
First Year of Data
1968
Station Location
Historical Weather Records
| Max High | Avg High | Min High | Max Avg | Avg Avg | Min Avg | Max Low | Avg Low | Min Low | Max Precipitation | Avg Precipitation | Max Snow | Avg Snow | |
|---|---|---|---|---|---|---|---|---|---|---|---|---|---|
| Record | 35.0 °C | — | -5.7 °C | 25.8 °C | — | -10.9 °C | 20.9 °C | — | -16.1 °C | 62.6 mm | — | — | — |
| January | 16.1 °C | 8.4 °C | -5.7 °C | 13.2 °C | 5.3 °C | -10.9 °C | 12.0 °C | 1.5 °C | -16.1 °C | 37.9 mm | 2.7 mm | — | — |
| February | 17.7 °C | 8.7 °C | -4.0 °C | 13.2 °C | 5.5 °C | -5.6 °C | 11.6 °C | 1.6 °C | -13.5 °C | 55.7 mm | 2.3 mm | — | — |
| March | 21.3 °C | 11.0 °C | 0.9 °C | 14.2 °C | 7.0 °C | -3.3 °C | 11.7 °C | 2.7 °C | -10.0 °C | 29.8 mm | 2.0 mm | — | — |
| April | 27.1 °C | 13.6 °C | 4.4 °C | 16.5 °C | 8.8 °C | 1.5 °C | 12.1 °C | 4.0 °C | -6.4 °C | 35.5 mm | 1.8 mm | — | — |
| May | 27.5 °C | 16.9 °C | 8.5 °C | 20.7 °C | 12.1 °C | 3.8 °C | 16.6 °C | 7.1 °C | -4.1 °C | 54.8 mm | 1.9 mm | — | — |
| June | 33.6 °C | 19.9 °C | 12.5 °C | 24.8 °C | 15.0 °C | 8.8 °C | 19.7 °C | 10.1 °C | 0.0 °C | 44.6 mm | 1.9 mm | — | — |
| July | 35.0 °C | 21.8 °C | 14.1 °C | 25.8 °C | 17.0 °C | 11.6 °C | 20.4 °C | 12.0 °C | 4.4 °C | 62.6 mm | 2.0 mm | — | — |
| August | 34.9 °C | 21.4 °C | 14.3 °C | 25.8 °C | 16.7 °C | 10.4 °C | 20.9 °C | 11.9 °C | 2.9 °C | 38.4 mm | 2.0 mm | — | — |
| September | 29.9 °C | 18.9 °C | 9.9 °C | 23.3 °C | 14.3 °C | 6.6 °C | 18.8 °C | 9.8 °C | -1.8 °C | 42.1 mm | 2.1 mm | — | — |
| October | 25.6 °C | 15.2 °C | 7.4 °C | 19.0 °C | 11.4 °C | 2.3 °C | 16.4 °C | 7.4 °C | -4.8 °C | 34.6 mm | 2.7 mm | — | — |
| November | 18.5 °C | 11.2 °C | -1.2 °C | 15.8 °C | 8.0 °C | -3.7 °C | 14.4 °C | 3.9 °C | -8.0 °C | 49.9 mm | 2.7 mm | — | — |
| December | 16.0 °C | 9.2 °C | -3.2 °C | 14.7 °C | 6.2 °C | -9.3 °C | 12.8 °C | 2.2 °C | -14.2 °C | 50.2 mm | 2.8 mm | — | — |
Data Visualisations
Remove WatermarksCurrent Year Climate Trends vs Historical


Max Temperature this Year | 1 of 6
Climate 12-Month Moving Averages


Max Temperature 12-Month MA | 1 of 6
Daily Data Points and Averages Throughout the Year


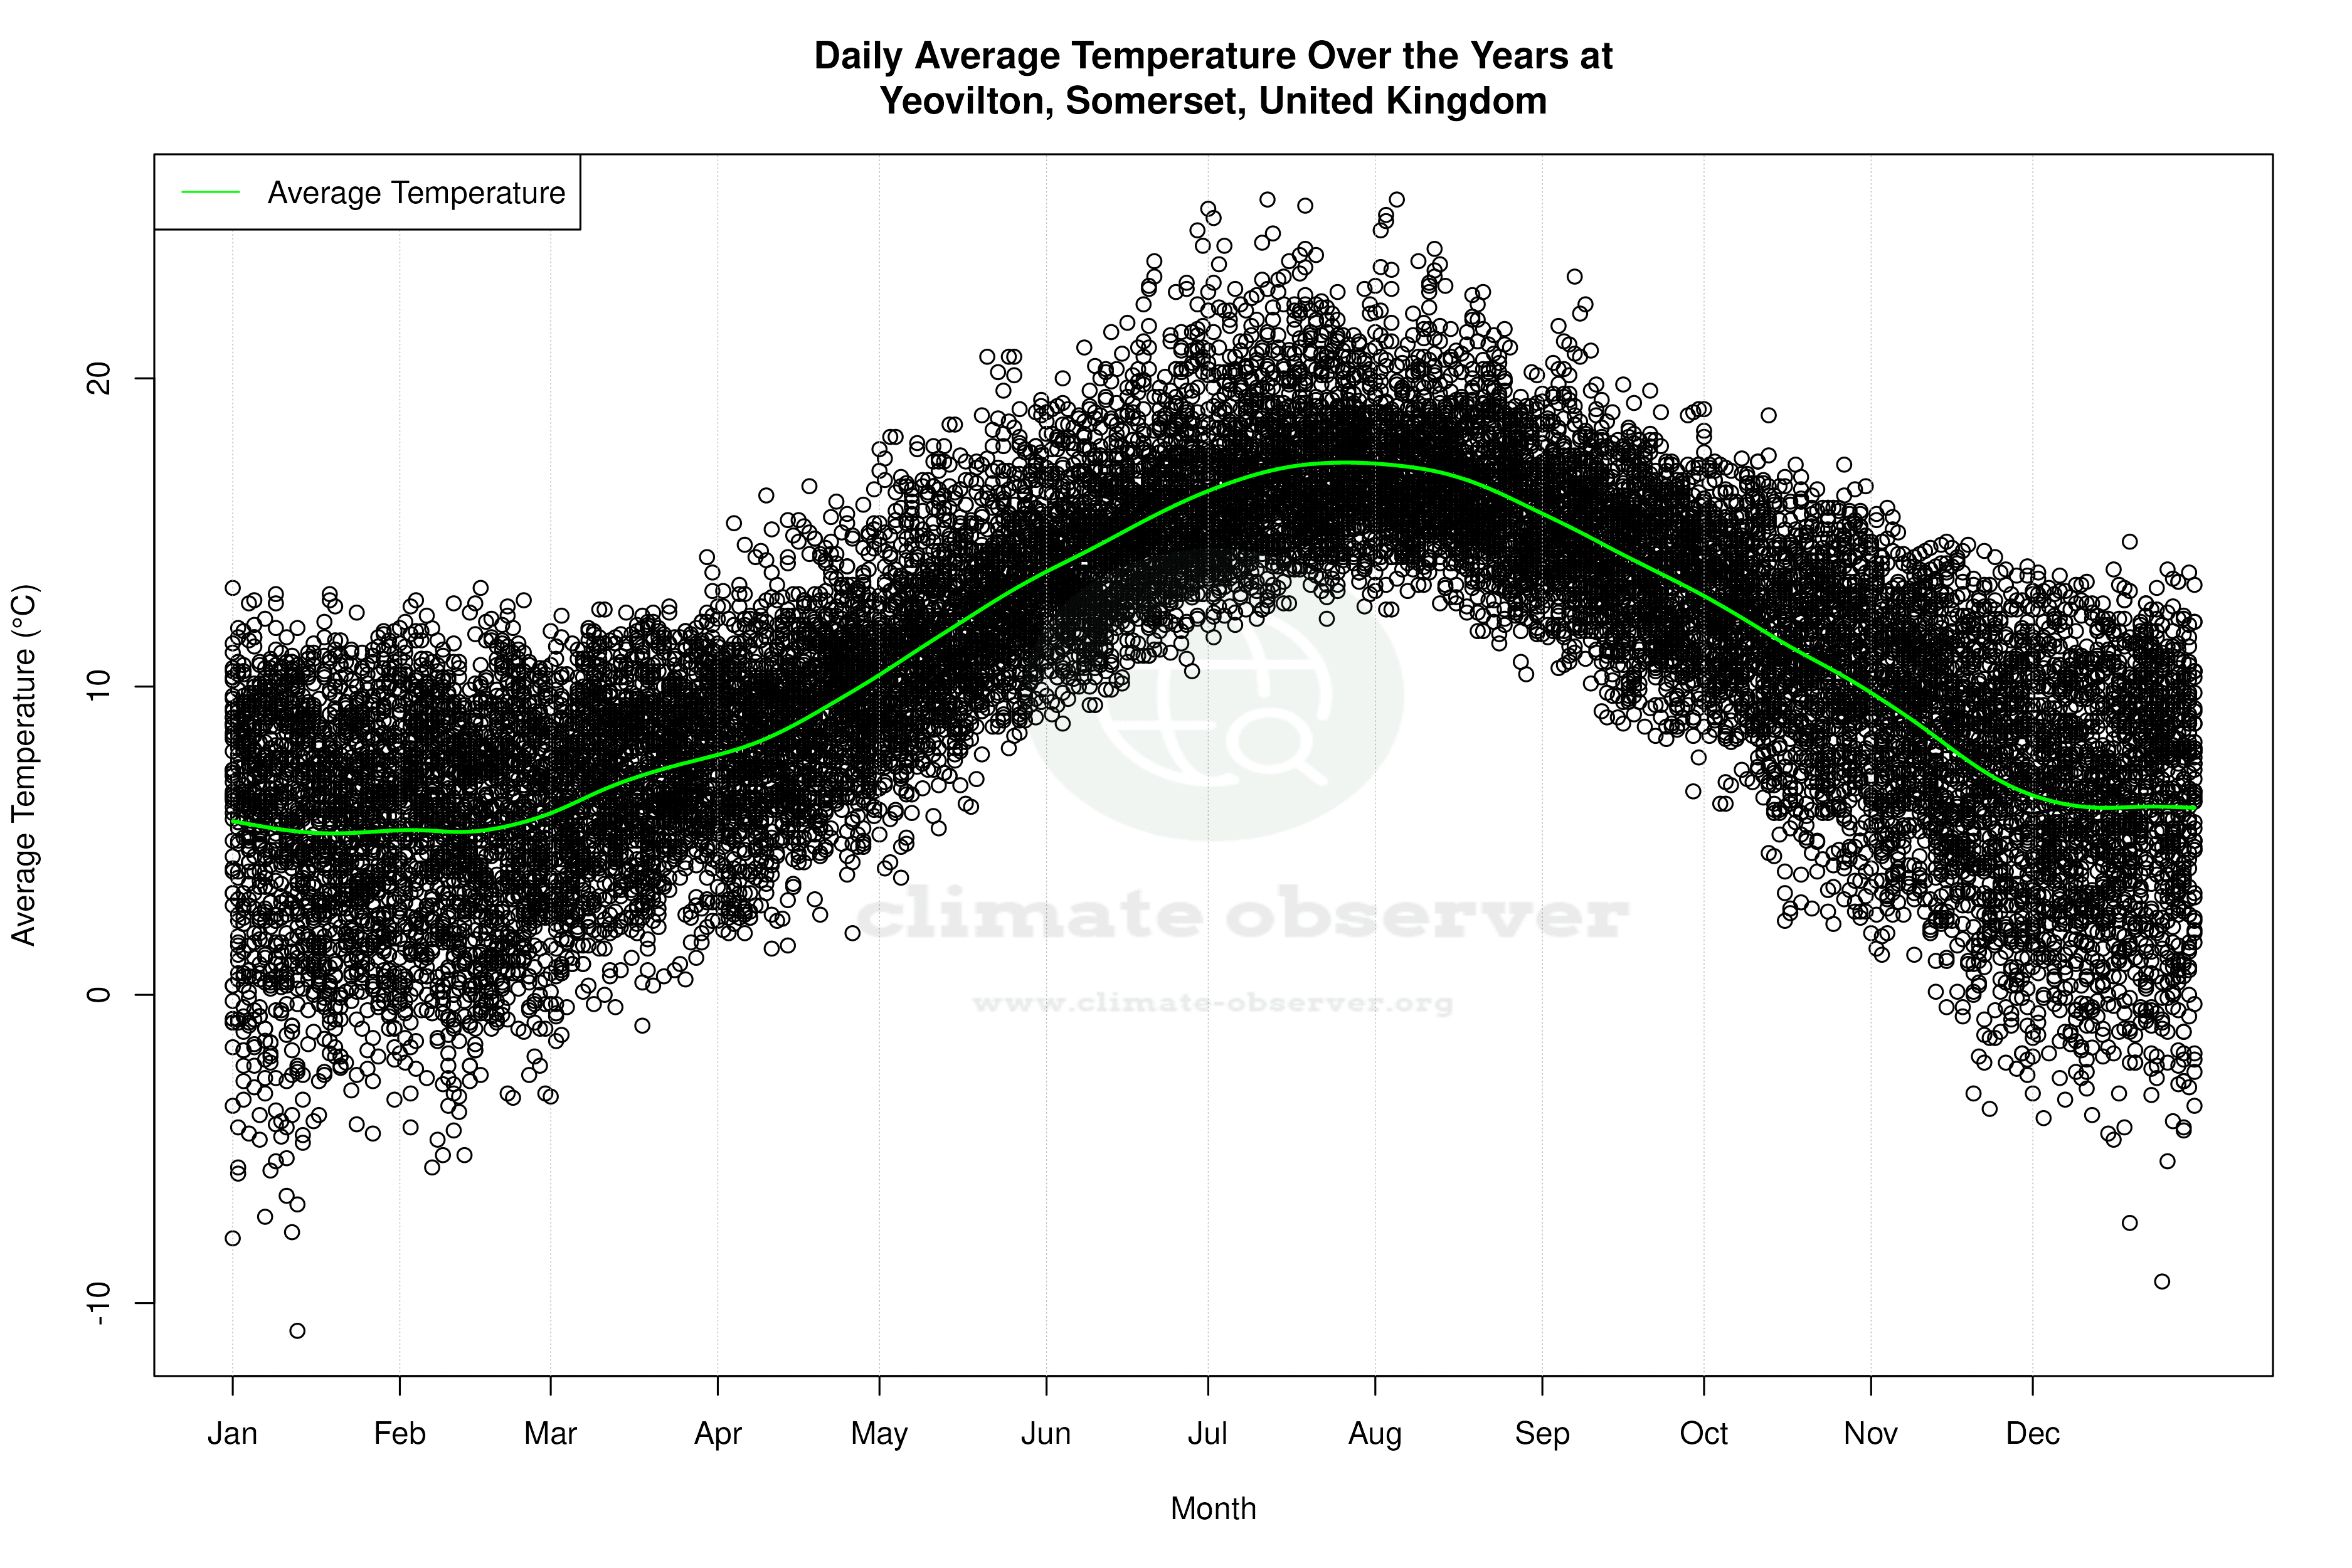

Average Max Temperature Throughout Year | 1 of 5
