Climate for Station: Durham, County Durham, United Kingdom
Loading live weather...
Climate Analysis & Overview
The climate profile for Durham reveals a warming trend with a marginally more even distribution of precipitation. Recent temperature increases are more pronounced over the past decade compared to all-time records, suggesting an acceleration in warming that aligns with broader regional climate goals to mitigate such changes.
Temperatures on the Rise
Durham, located in the North East of England, experiences a temperate maritime climate, classified under the Köppen system as Cfb. This classification indicates mild temperatures and moderate rainfall, influenced by its proximity to the North Sea. Over the past decade, Durham has seen a significant increase in temperatures, with highs rising by 0.95°C (1.71°F) and lows by 0.85°C (1.53°F). These figures highlight a more pronounced warming trend compared to the all-time increases of 0.10°C (0.18°F) for highs and 0.12°C (0.22°F) for lows. This suggests that recent years have experienced an accelerated warming, a concern that aligns with the UK's regional climate goals to reduce greenhouse gas emissions and curb temperature rise.
Precipitation Patterns: A Subtle Shift
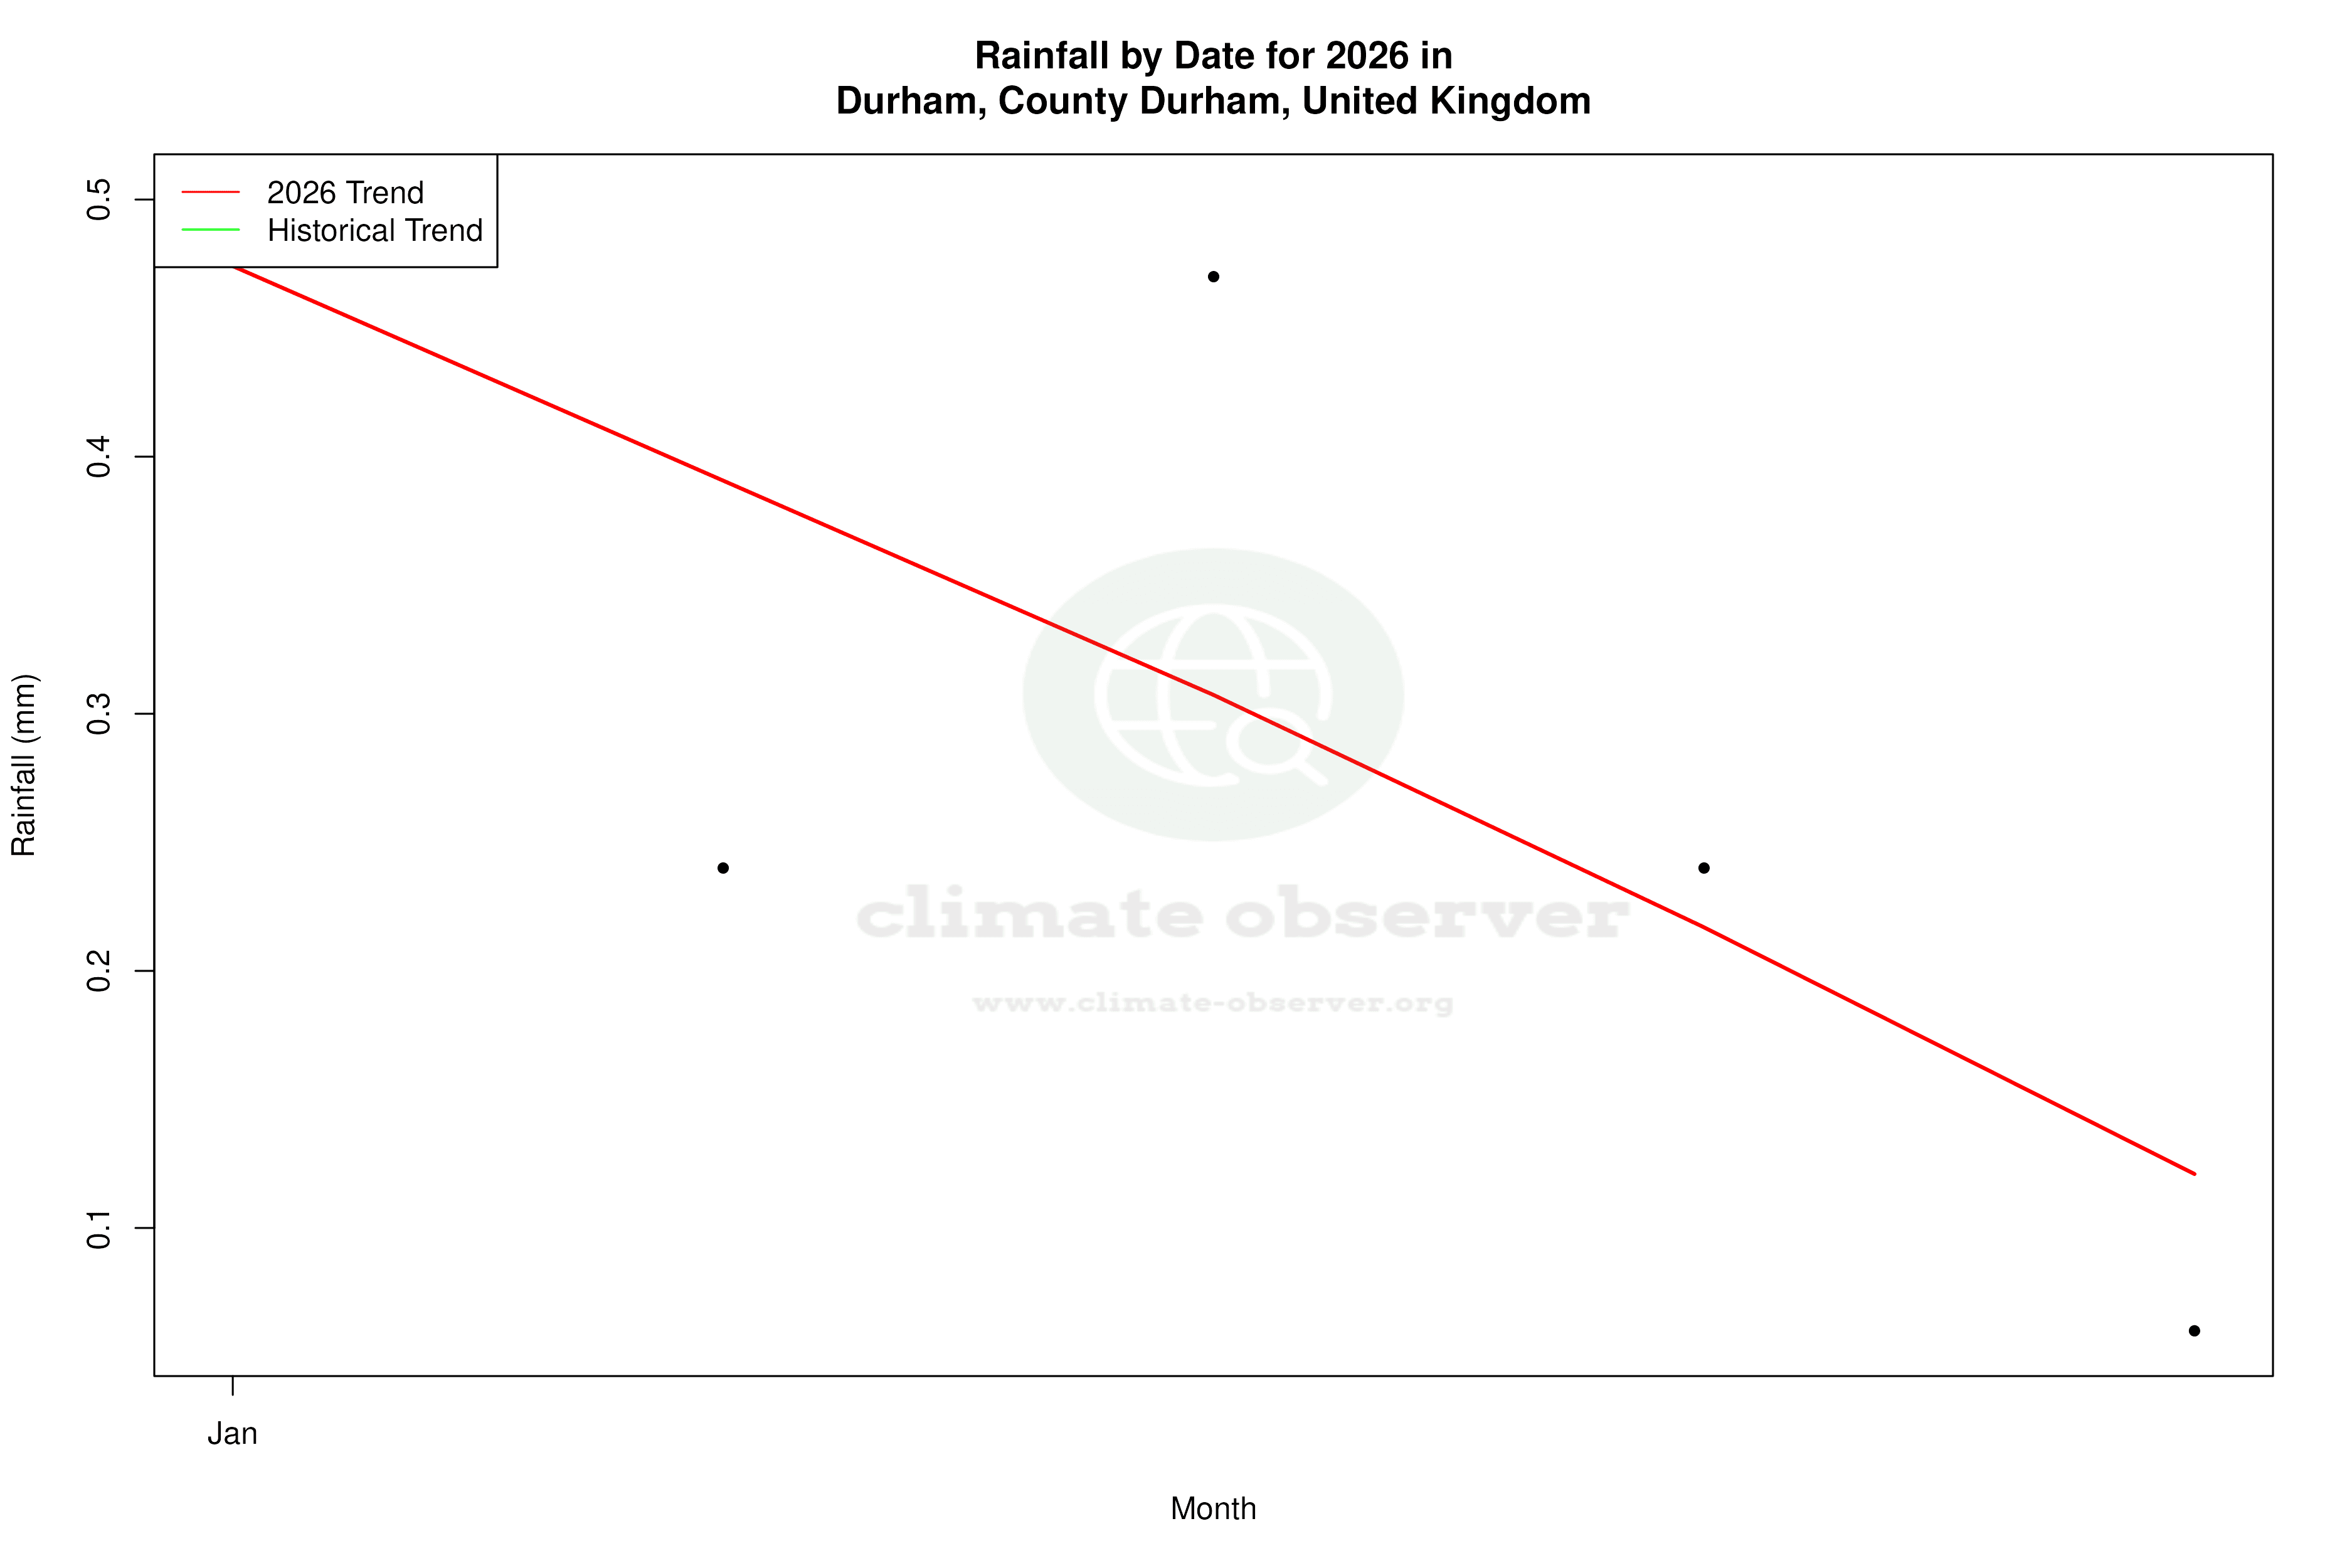
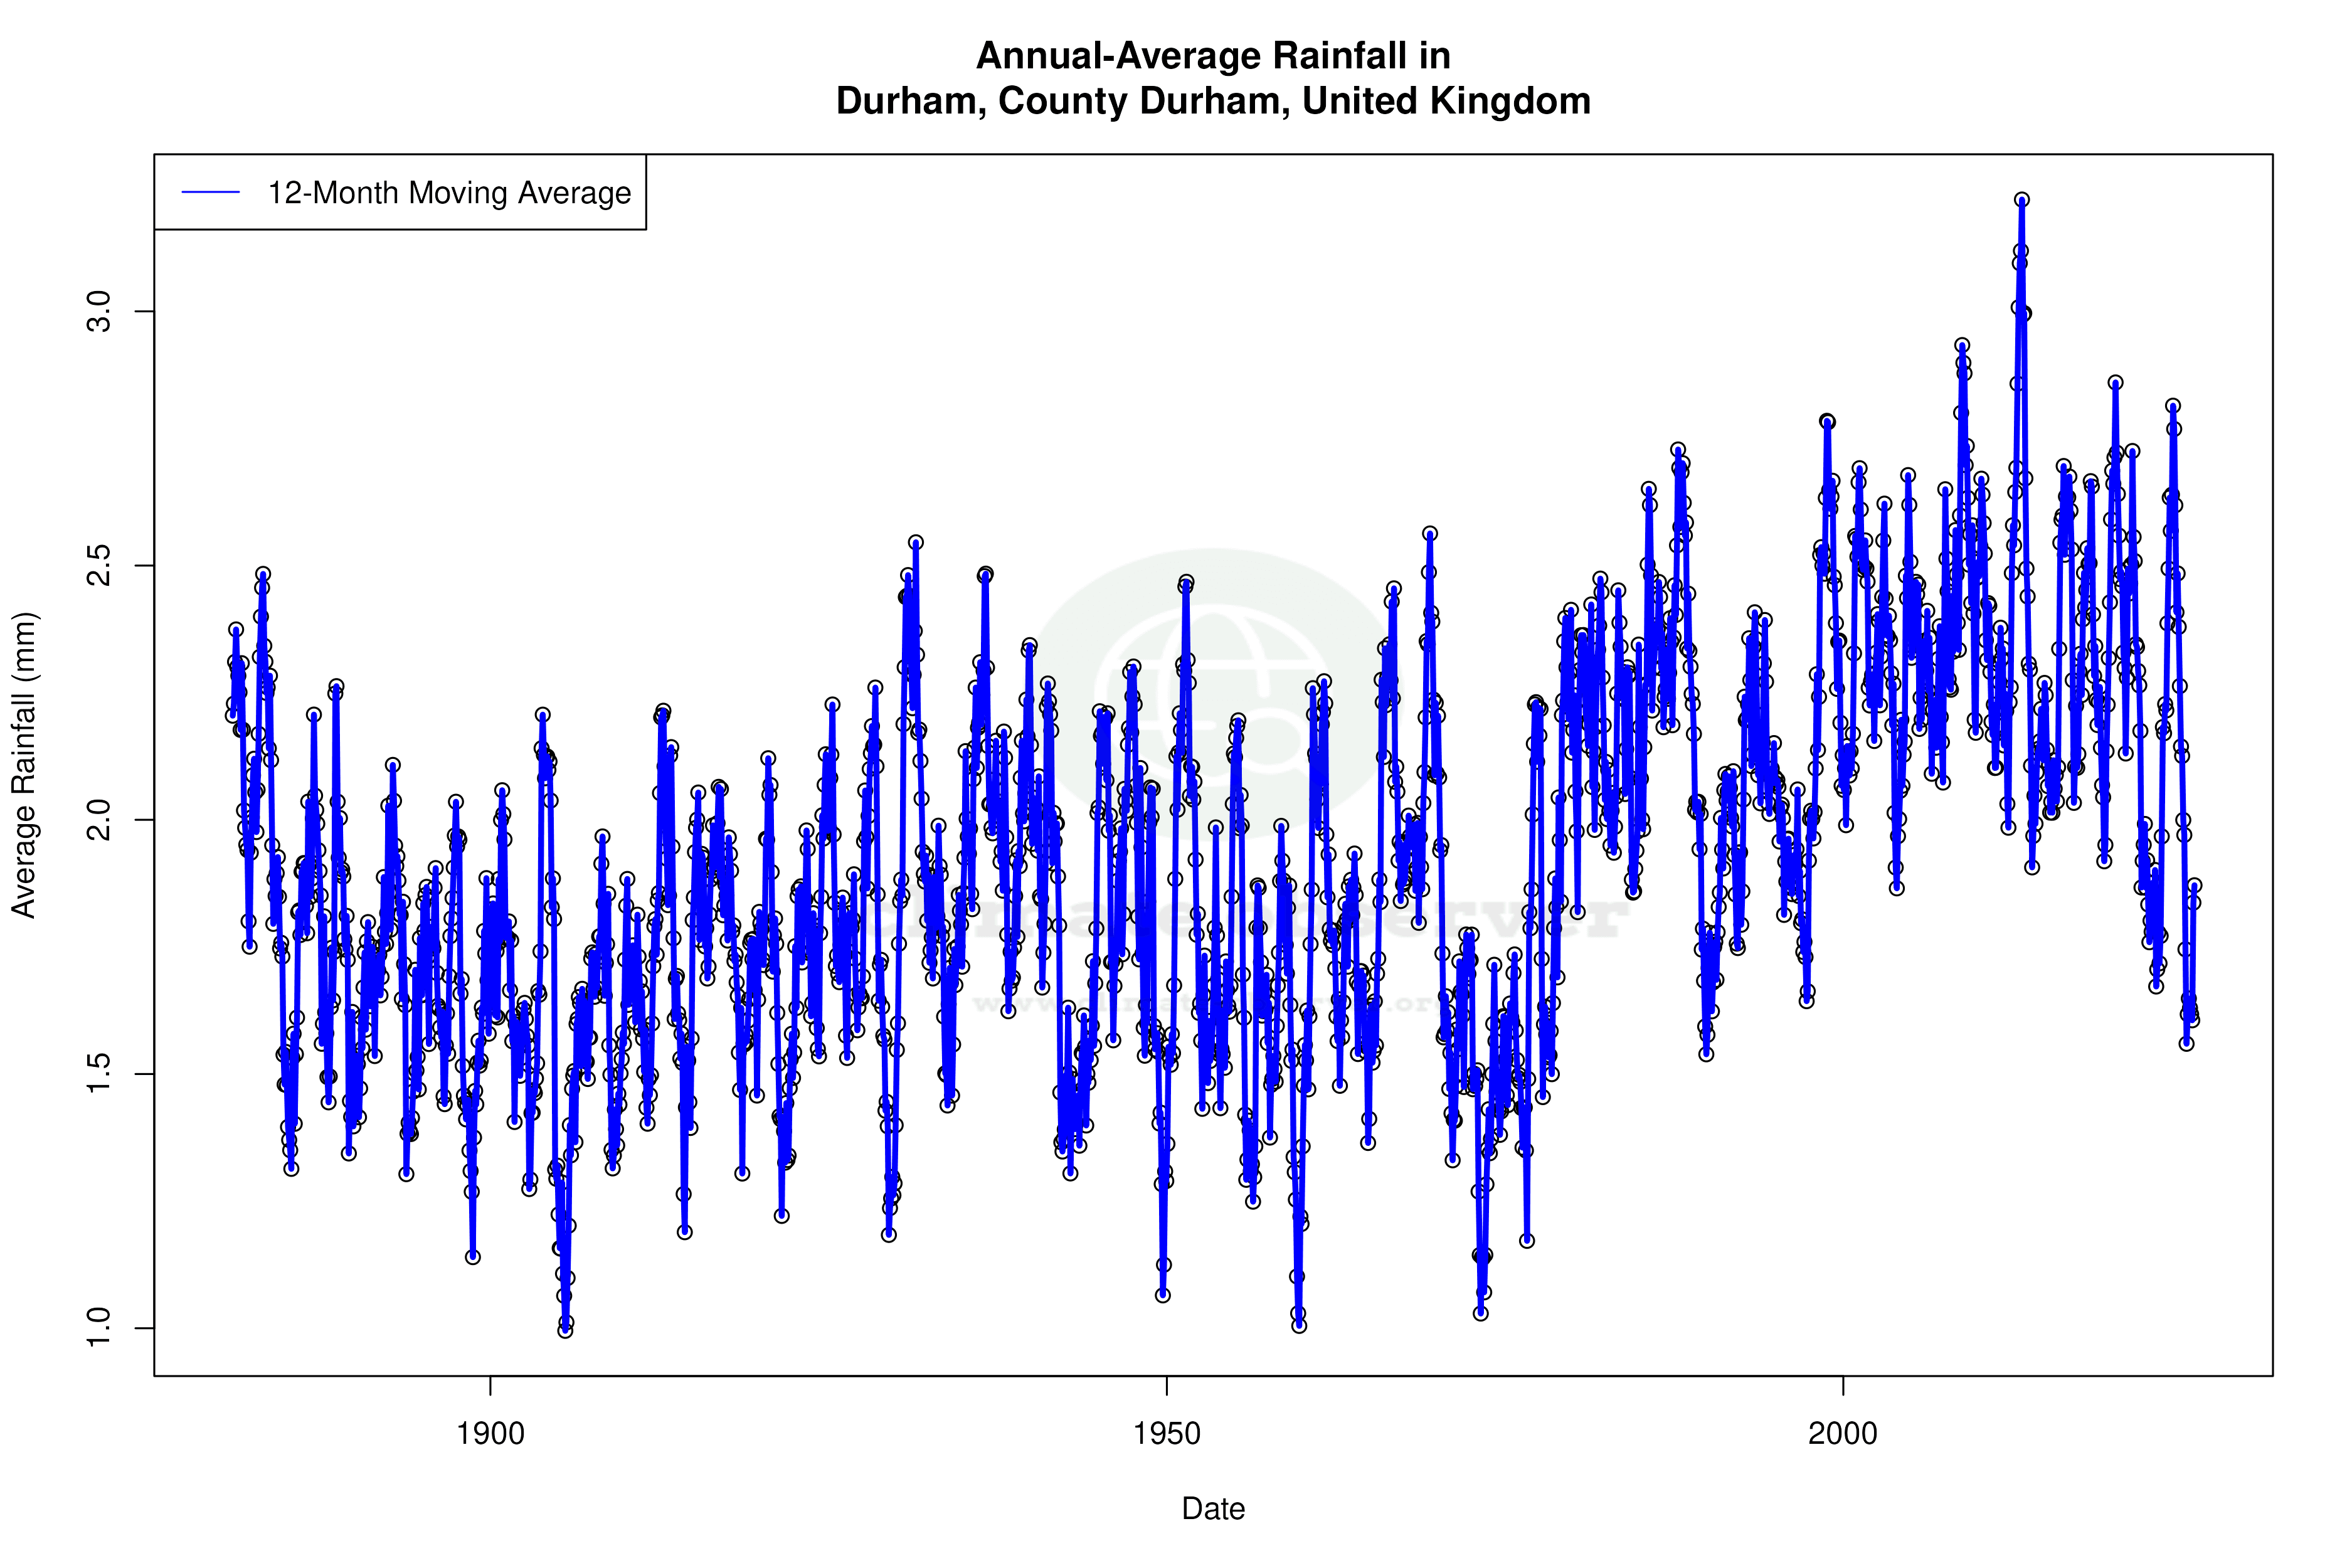
The Precipitation Concentration Index (PCI) for Durham has shown a slight decrease from a baseline of 10.70 to a current value of 10.10. The PCI measures how precipitation is distributed over time; a lower value indicates a more even distribution of rainfall events. This marginal change suggests that Durham is experiencing a slightly more consistent rainfall pattern, which could be beneficial for agriculture and water management in the region. However, this shift is subtle and does not indicate a drastic change in precipitation patterns.
Record Extremes: A Tale of Two Temperatures
Durham's temperature records underscore the variability inherent in its climate. The highest recorded temperature is 32.9°C (91.2°F), while the lowest is -15.4°C (4.3°F). These extremes reflect the potential for both heatwaves and severe cold spells, characteristic of the region's temperate climate. The presence of such extremes highlights the importance of adaptive measures to manage both heat and cold-related impacts on infrastructure and public health.
Geographical Influence: The Maritime Effect
Durham's climate is heavily influenced by its geographical position. The North Sea moderates temperatures, preventing extreme cold in winter and excessive heat in summer. This maritime influence contributes to the region's relatively stable climate, though it does not shield it entirely from the broader impacts of climate change. The observed warming trend, particularly over the last decade, suggests that even maritime climates are not immune to the effects of global warming.
Aligning with Regional Climate Goals
The UK's commitment to reducing carbon emissions and enhancing climate resilience is crucial in the context of Durham's warming trend. The observed temperature increases, particularly over the past decade, underscore the urgency of these goals. As the region continues to adapt to changing climatic conditions, understanding local trends such as those seen in Durham will be vital in shaping effective climate policies and strategies.
Station Statistics
10-Year Trend
High: +1.21 °C/decade
Low: +1.27 °C/decade
Rain: -0.57 mm/decade
25-Year Trend
High: +0.48 °C/decade
Low: +0.31 °C/decade
Rain: -0.08 mm/decade
50-Year Trend
High: +0.37 °C/decade
Low: +0.33 °C/decade
Rain: +0.07 mm/decade
All-Time Trend
High: +0.11 °C/decade
Low: +0.13 °C/decade
Rain: +0.05 mm/decade
Percentage Above-Average Days
Last 12 Months: 60.8%
This Year: 35.9%
Precipitation Concentration Index (PCI) ℹ️
Last 12 Months: 10.6
Historical Average: 11.0
Percentile Rank of Last 12 Months ℹ️
High: 97th percentile
Low: 98th percentile
Rain: 49th percentile
Change in Variance ℹ️
High: -7.5%
Low: +1.7%
Intraday: -3.5%
Data Coverage
82.6%
First Year of Data
1898
Station Location
Historical Weather Records
| Max High | Avg High | Min High | Max Avg | Avg Avg | Min Avg | Max Low | Avg Low | Min Low | Max Precipitation | Avg Precipitation | Max Snow | Avg Snow | |
|---|---|---|---|---|---|---|---|---|---|---|---|---|---|
| Record | 32.9 °C | — | -5.8 °C | 24.1 °C | — | -5.8 °C | 18.9 °C | — | -16.5 °C | 87.8 mm | — | — | — |
| January | 16.9 °C | 6.0 °C | -5.8 °C | 11.1 °C | 3.2 °C | -5.8 °C | 11.1 °C | 0.4 °C | -16.5 °C | 32.8 mm | 1.8 mm | — | — |
| February | 17.4 °C | 6.7 °C | -4.1 °C | 12.3 °C | 3.4 °C | -3.8 °C | 10.7 °C | 0.5 °C | -15.4 °C | 50.0 mm | 1.6 mm | — | — |
| March | 21.8 °C | 8.9 °C | -1.7 °C | 12.3 °C | 4.9 °C | -3.6 °C | 11.1 °C | 1.5 °C | -12.2 °C | 50.6 mm | 1.6 mm | — | — |
| April | 25.6 °C | 11.5 °C | 0.6 °C | 15.9 °C | 6.7 °C | 0.7 °C | 12.7 °C | 3.0 °C | -11.1 °C | 41.6 mm | 1.5 mm | — | — |
| May | 27.8 °C | 14.7 °C | 3.9 °C | 18.2 °C | 9.9 °C | 2.6 °C | 14.1 °C | 5.6 °C | -5.1 °C | 70.2 mm | 1.7 mm | — | — |
| June | 31.0 °C | 17.9 °C | 7.2 °C | 22.1 °C | 12.8 °C | 6.3 °C | 17.8 °C | 8.5 °C | -1.1 °C | 48.0 mm | 1.8 mm | — | — |
| July | 32.9 °C | 19.7 °C | 10.0 °C | 24.1 °C | 14.8 °C | 8.6 °C | 18.9 °C | 10.6 °C | 1.1 °C | 61.4 mm | 2.2 mm | — | — |
| August | 32.5 °C | 19.2 °C | 9.4 °C | 21.7 °C | 14.5 °C | 9.2 °C | 17.9 °C | 10.4 °C | 1.5 °C | 50.3 mm | 2.3 mm | — | — |
| September | 29.3 °C | 16.7 °C | 7.7 °C | 20.2 °C | 12.3 °C | 6.0 °C | 17.2 °C | 8.5 °C | -1.7 °C | 87.8 mm | 1.9 mm | — | — |
| October | 24.9 °C | 12.8 °C | 1.3 °C | 17.4 °C | 9.3 °C | 1.1 °C | 15.9 °C | 5.8 °C | -5.6 °C | 63.7 mm | 2.3 mm | — | — |
| November | 18.9 °C | 8.8 °C | -1.1 °C | 15.0 °C | 6.0 °C | -1.6 °C | 13.9 °C | 2.9 °C | -12.0 °C | 72.8 mm | 2.2 mm | — | — |
| December | 15.9 °C | 6.6 °C | -4.9 °C | 12.6 °C | 3.9 °C | -5.6 °C | 11.7 °C | 1.1 °C | -12.5 °C | 34.3 mm | 2.0 mm | — | — |
Data Visualisations
Remove WatermarksCurrent Year Climate Trends vs Historical


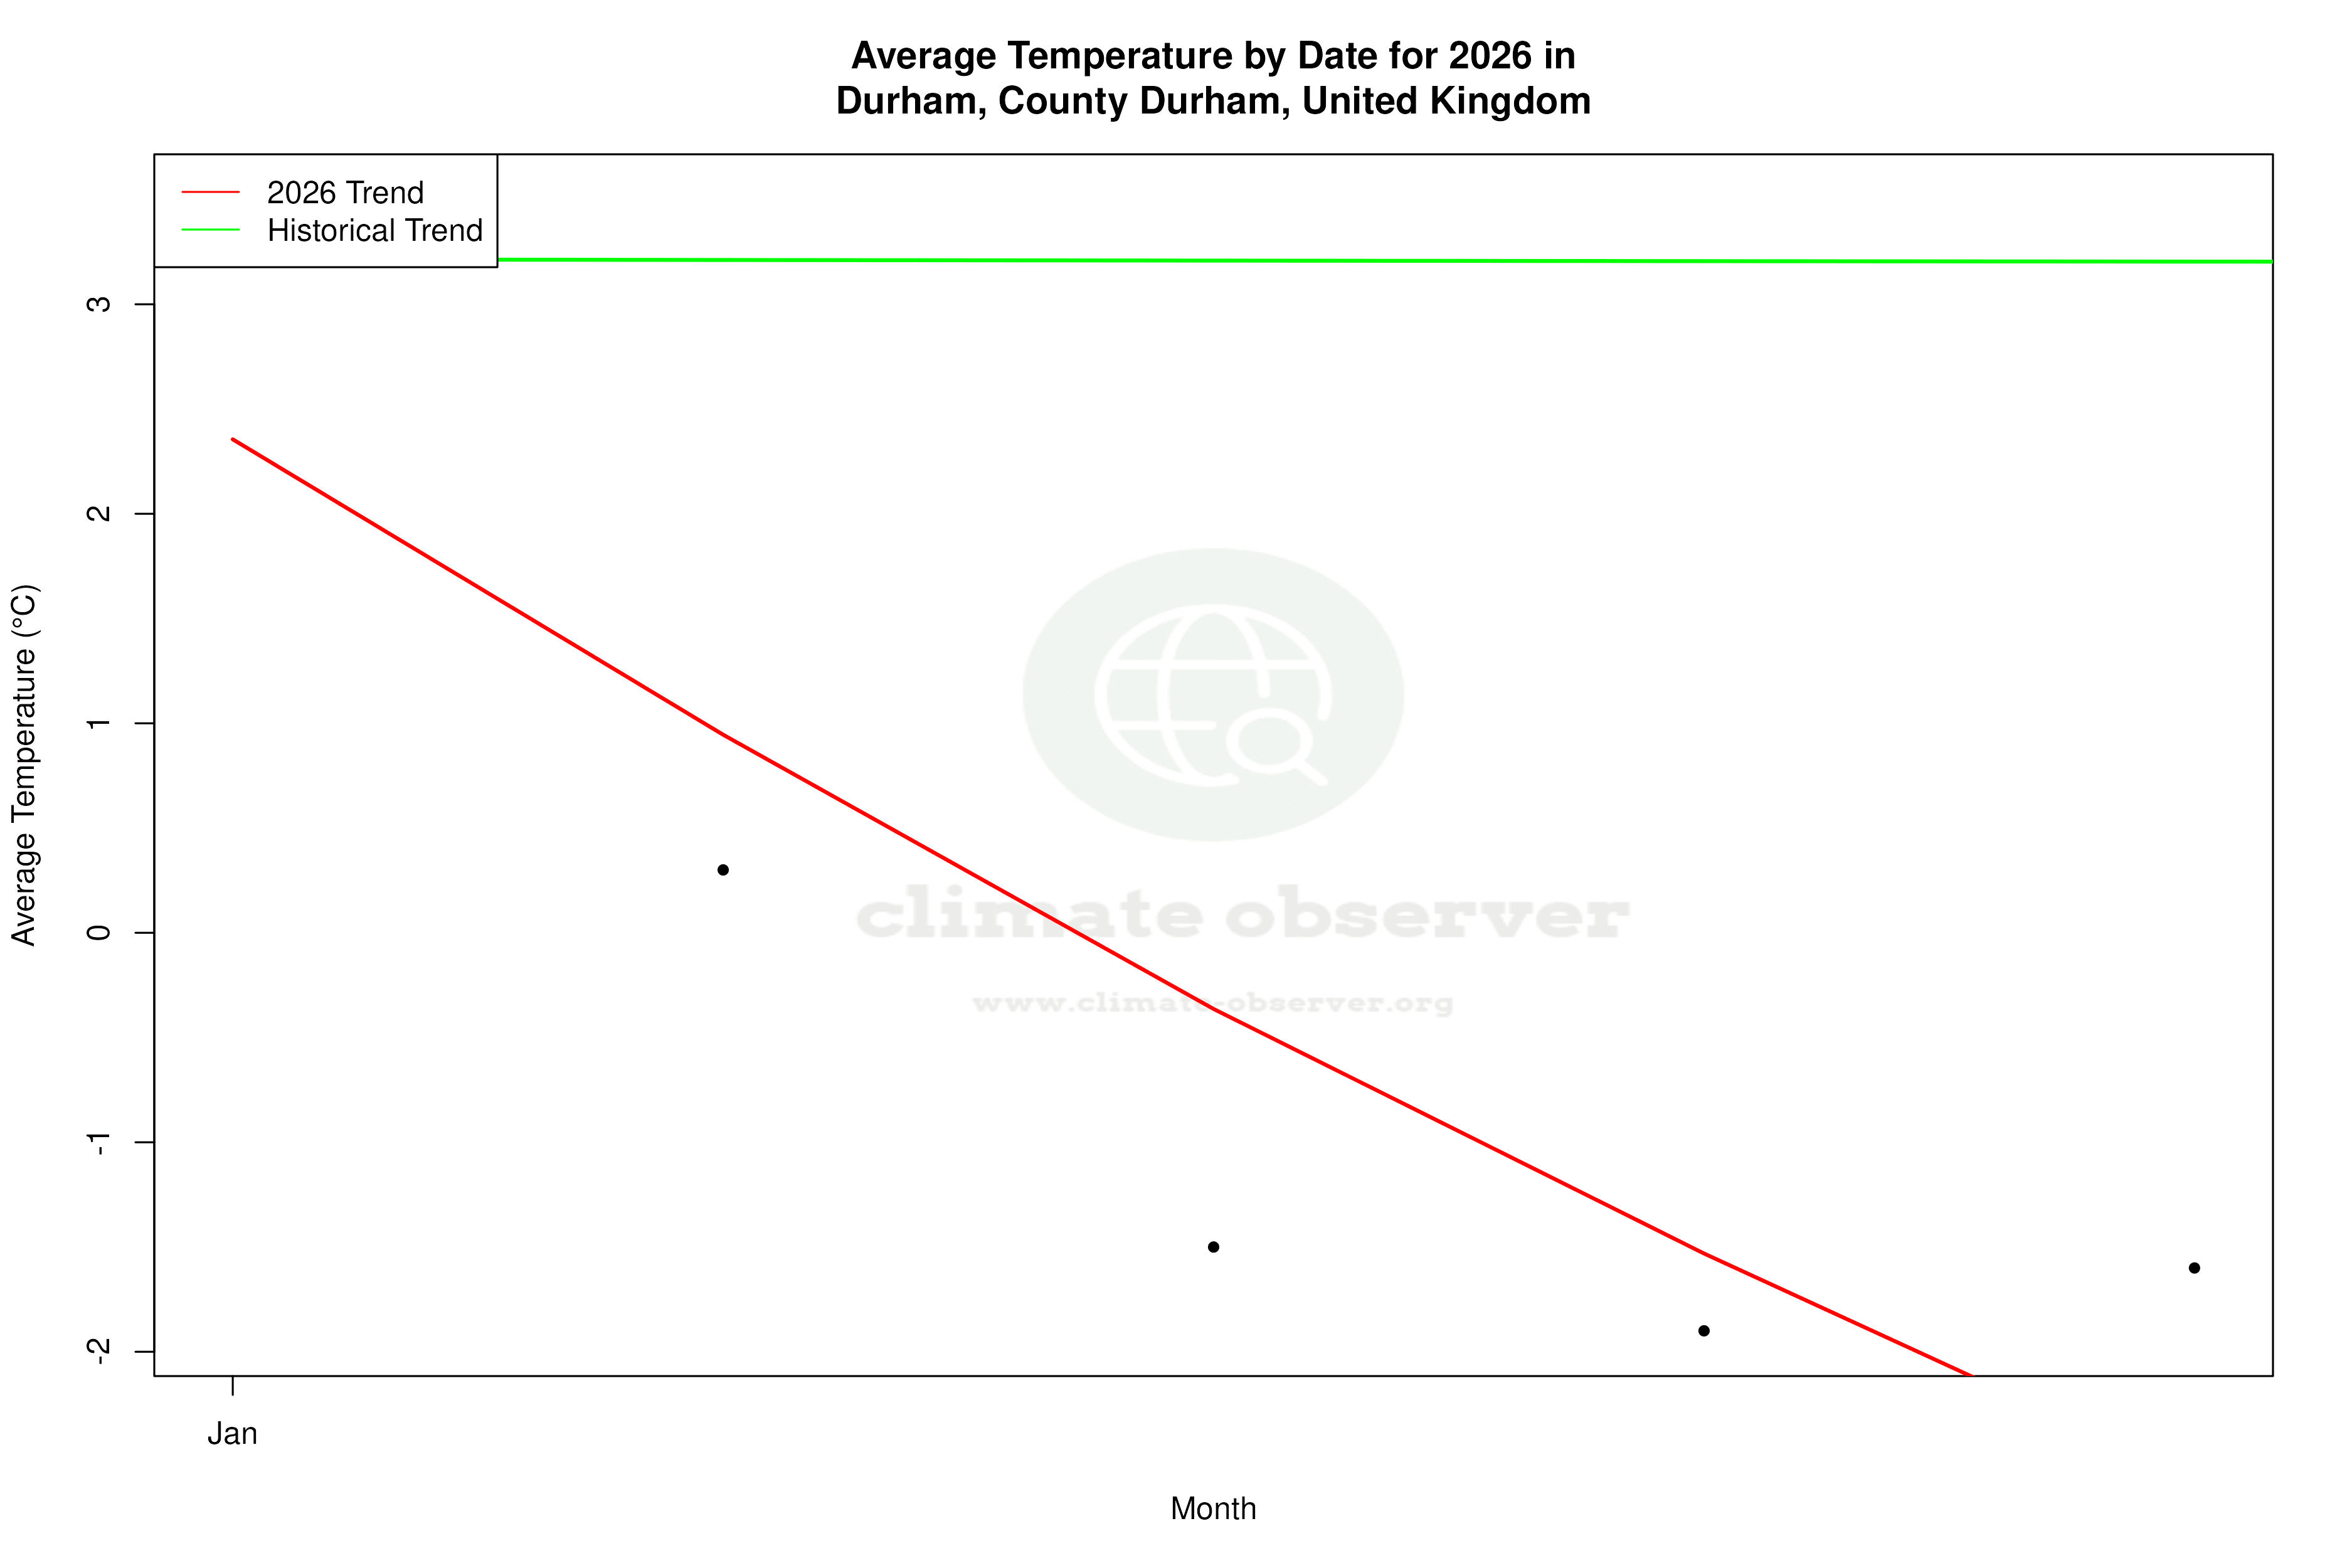

Max Temperature this Year | 1 of 6
Climate 12-Month Moving Averages
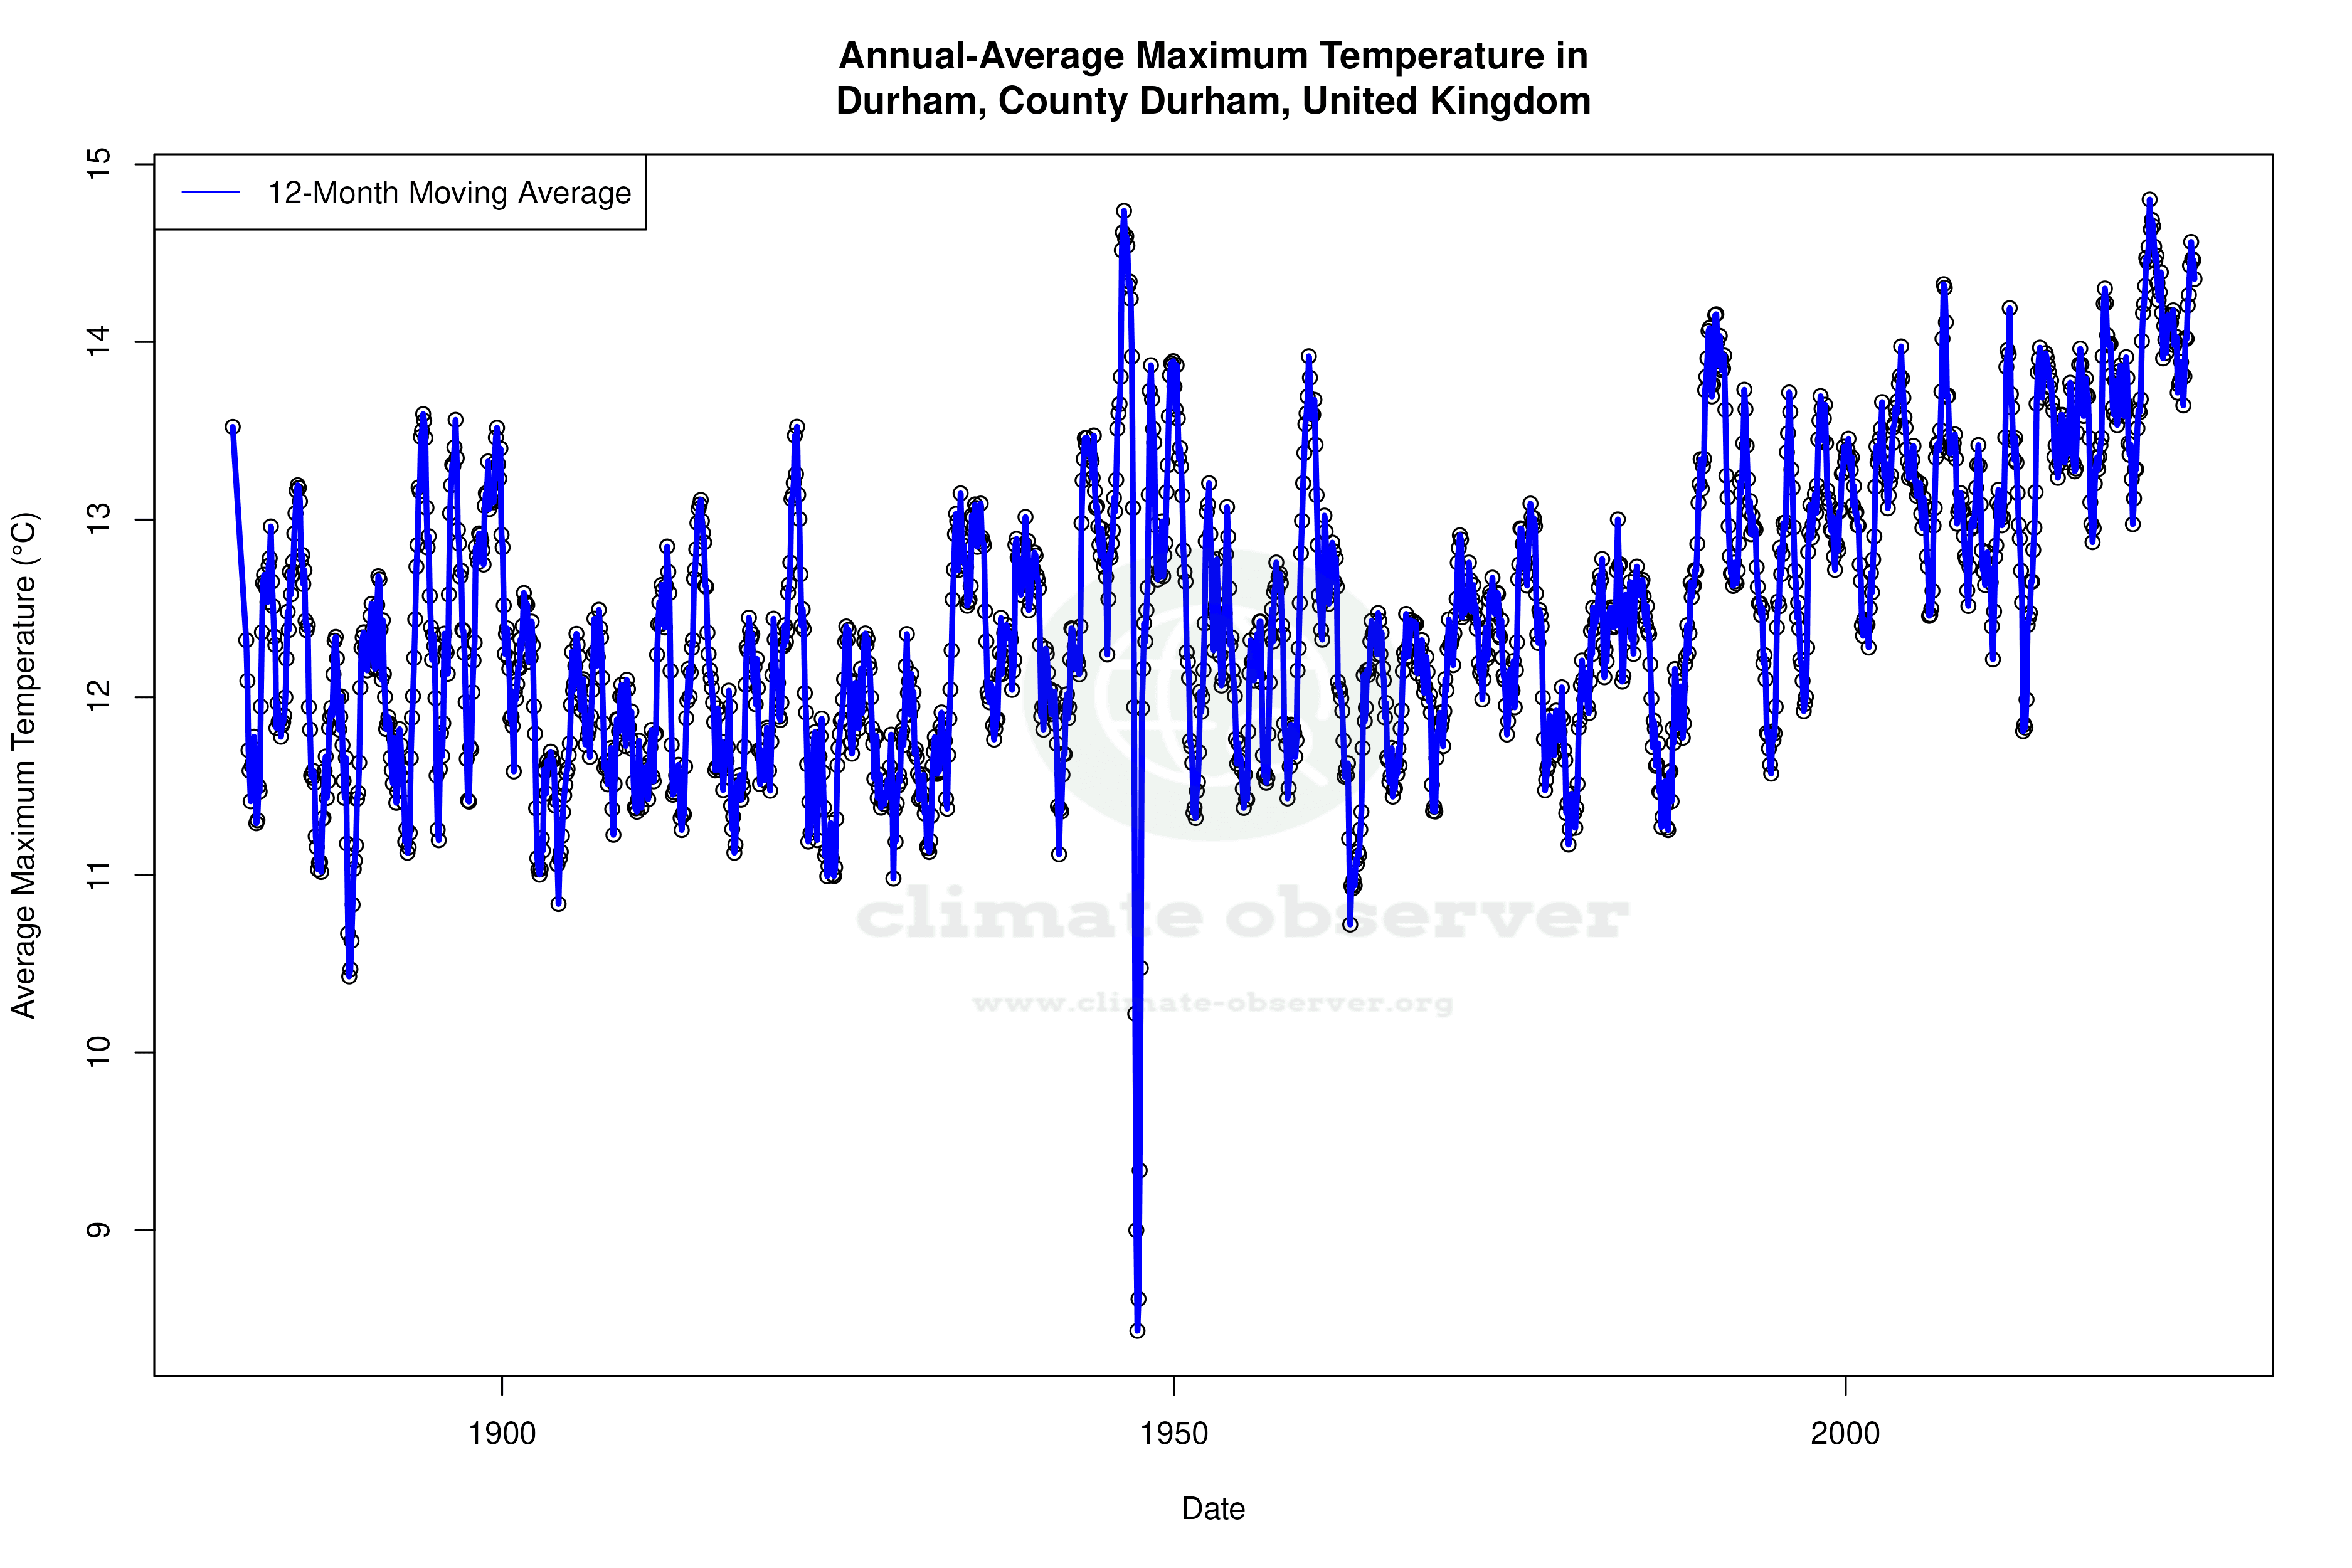
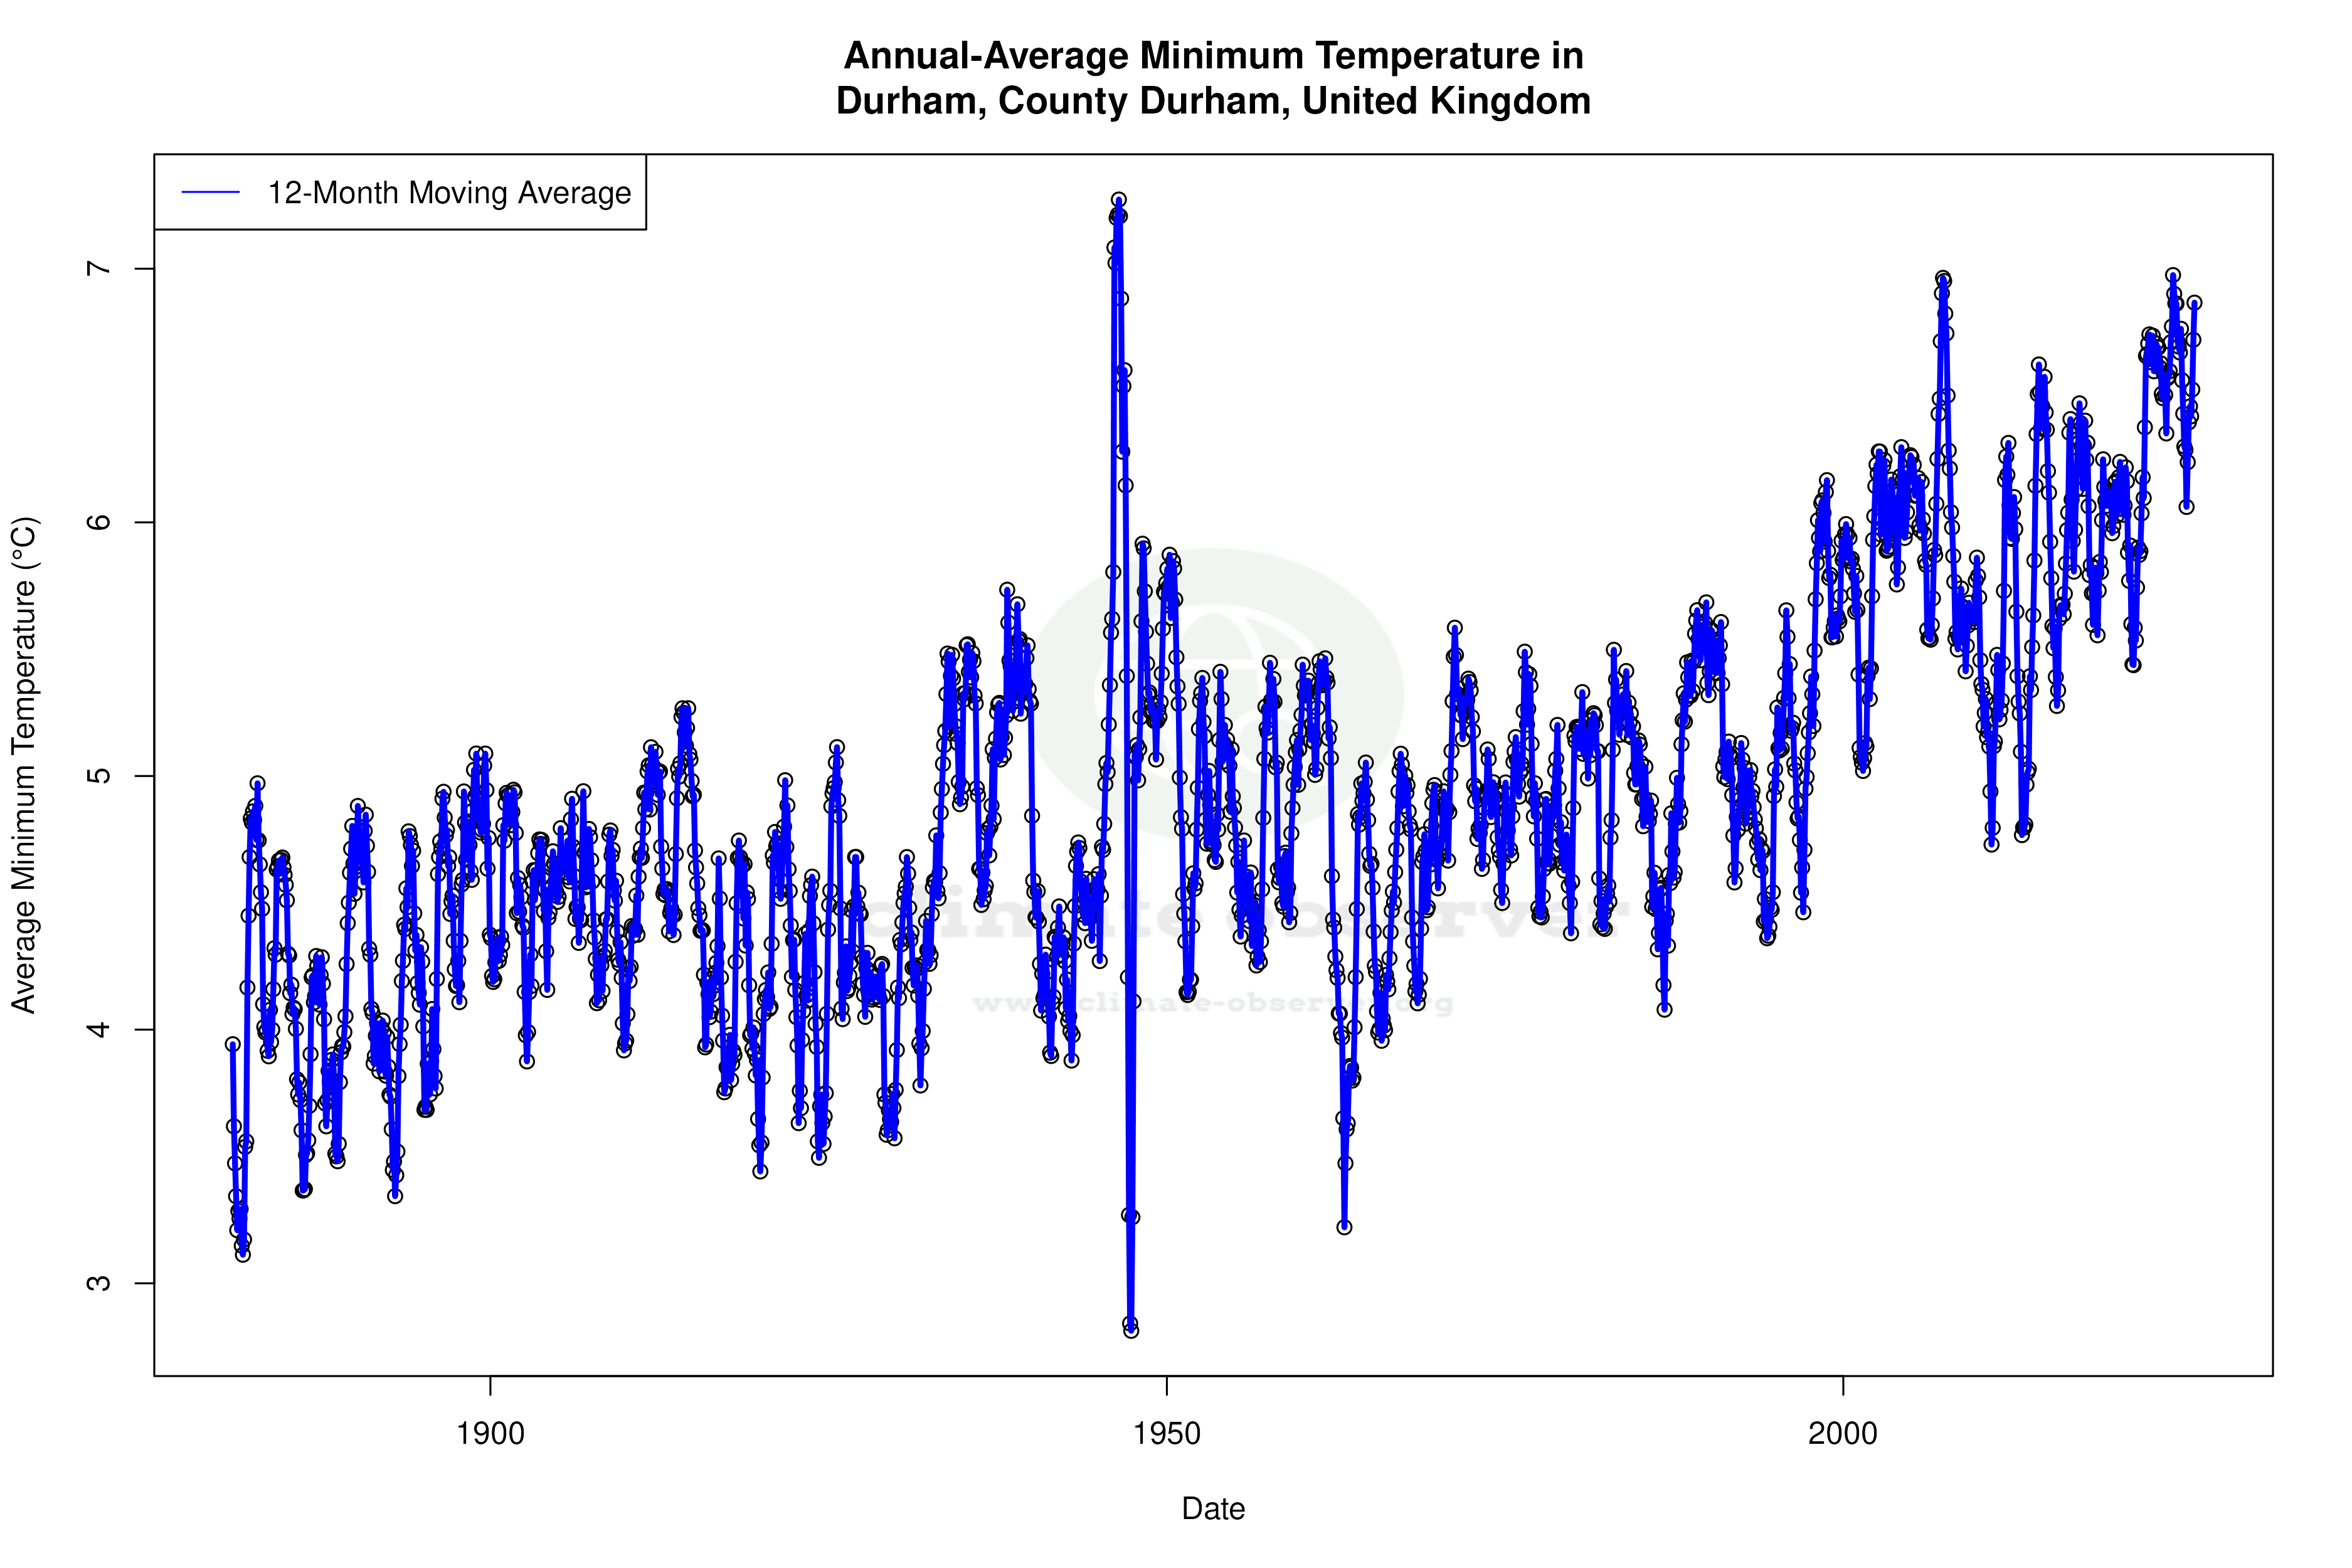


Max Temperature 12-Month MA | 1 of 6
Daily Data Points and Averages Throughout the Year
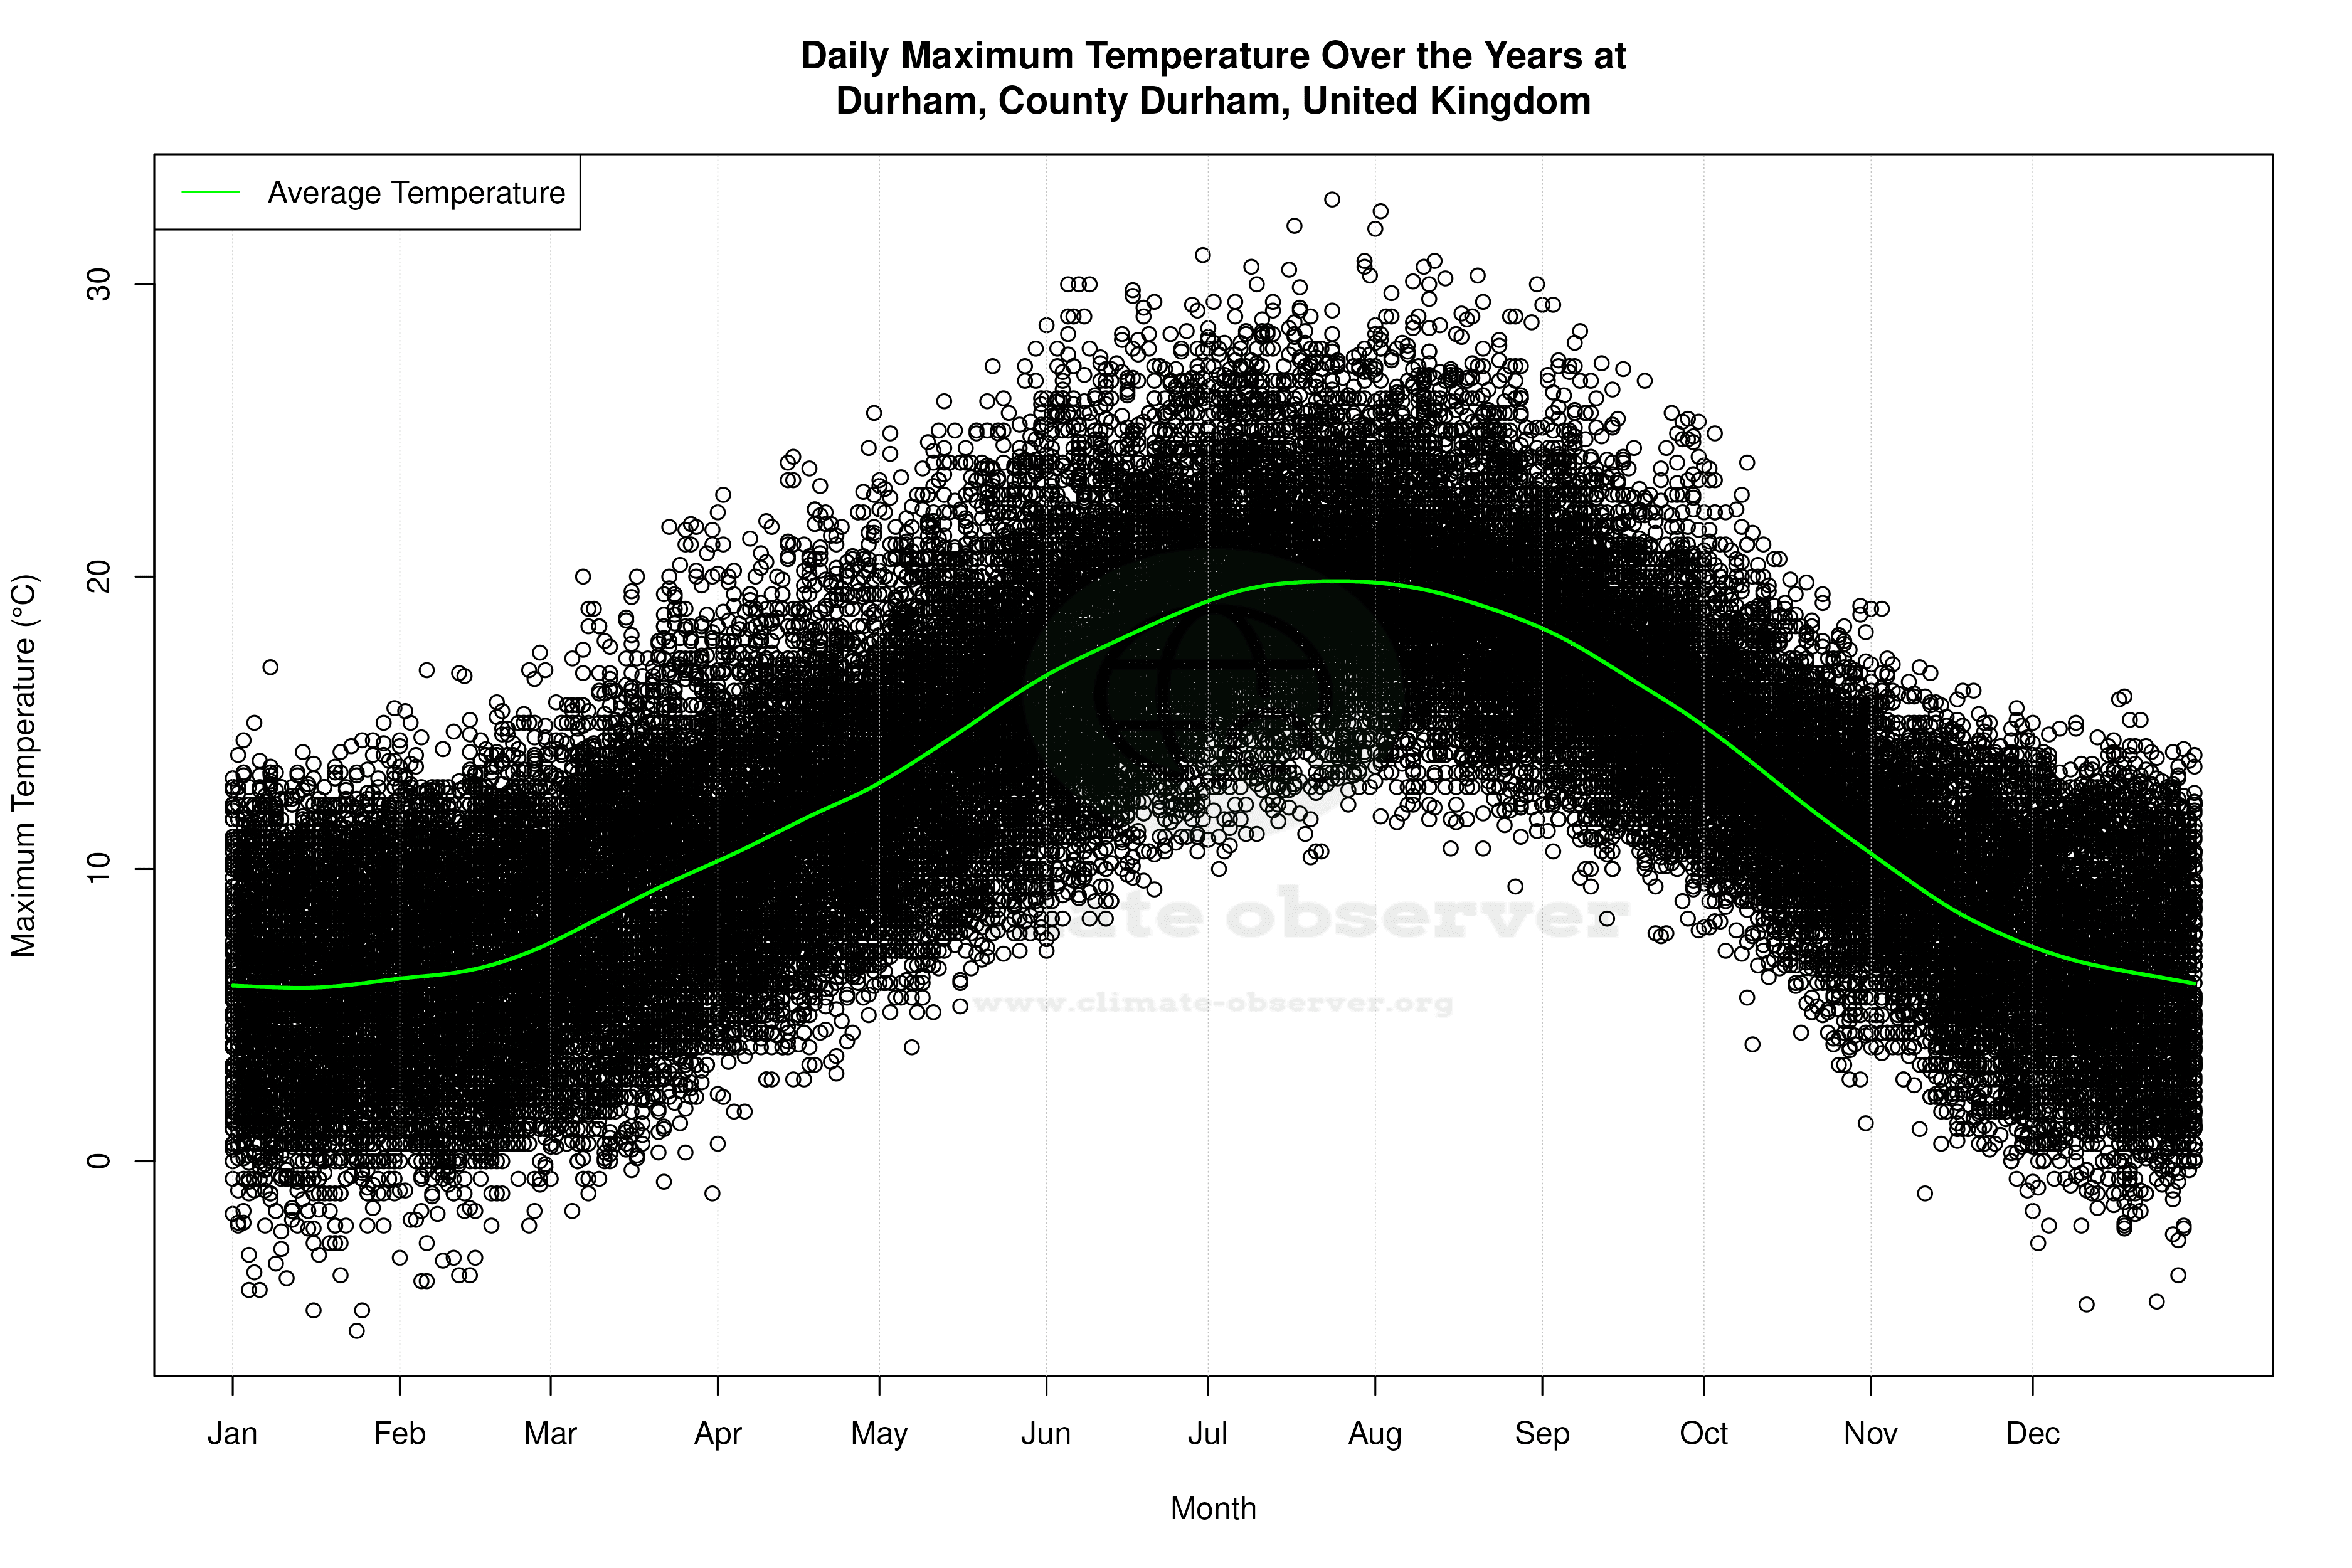
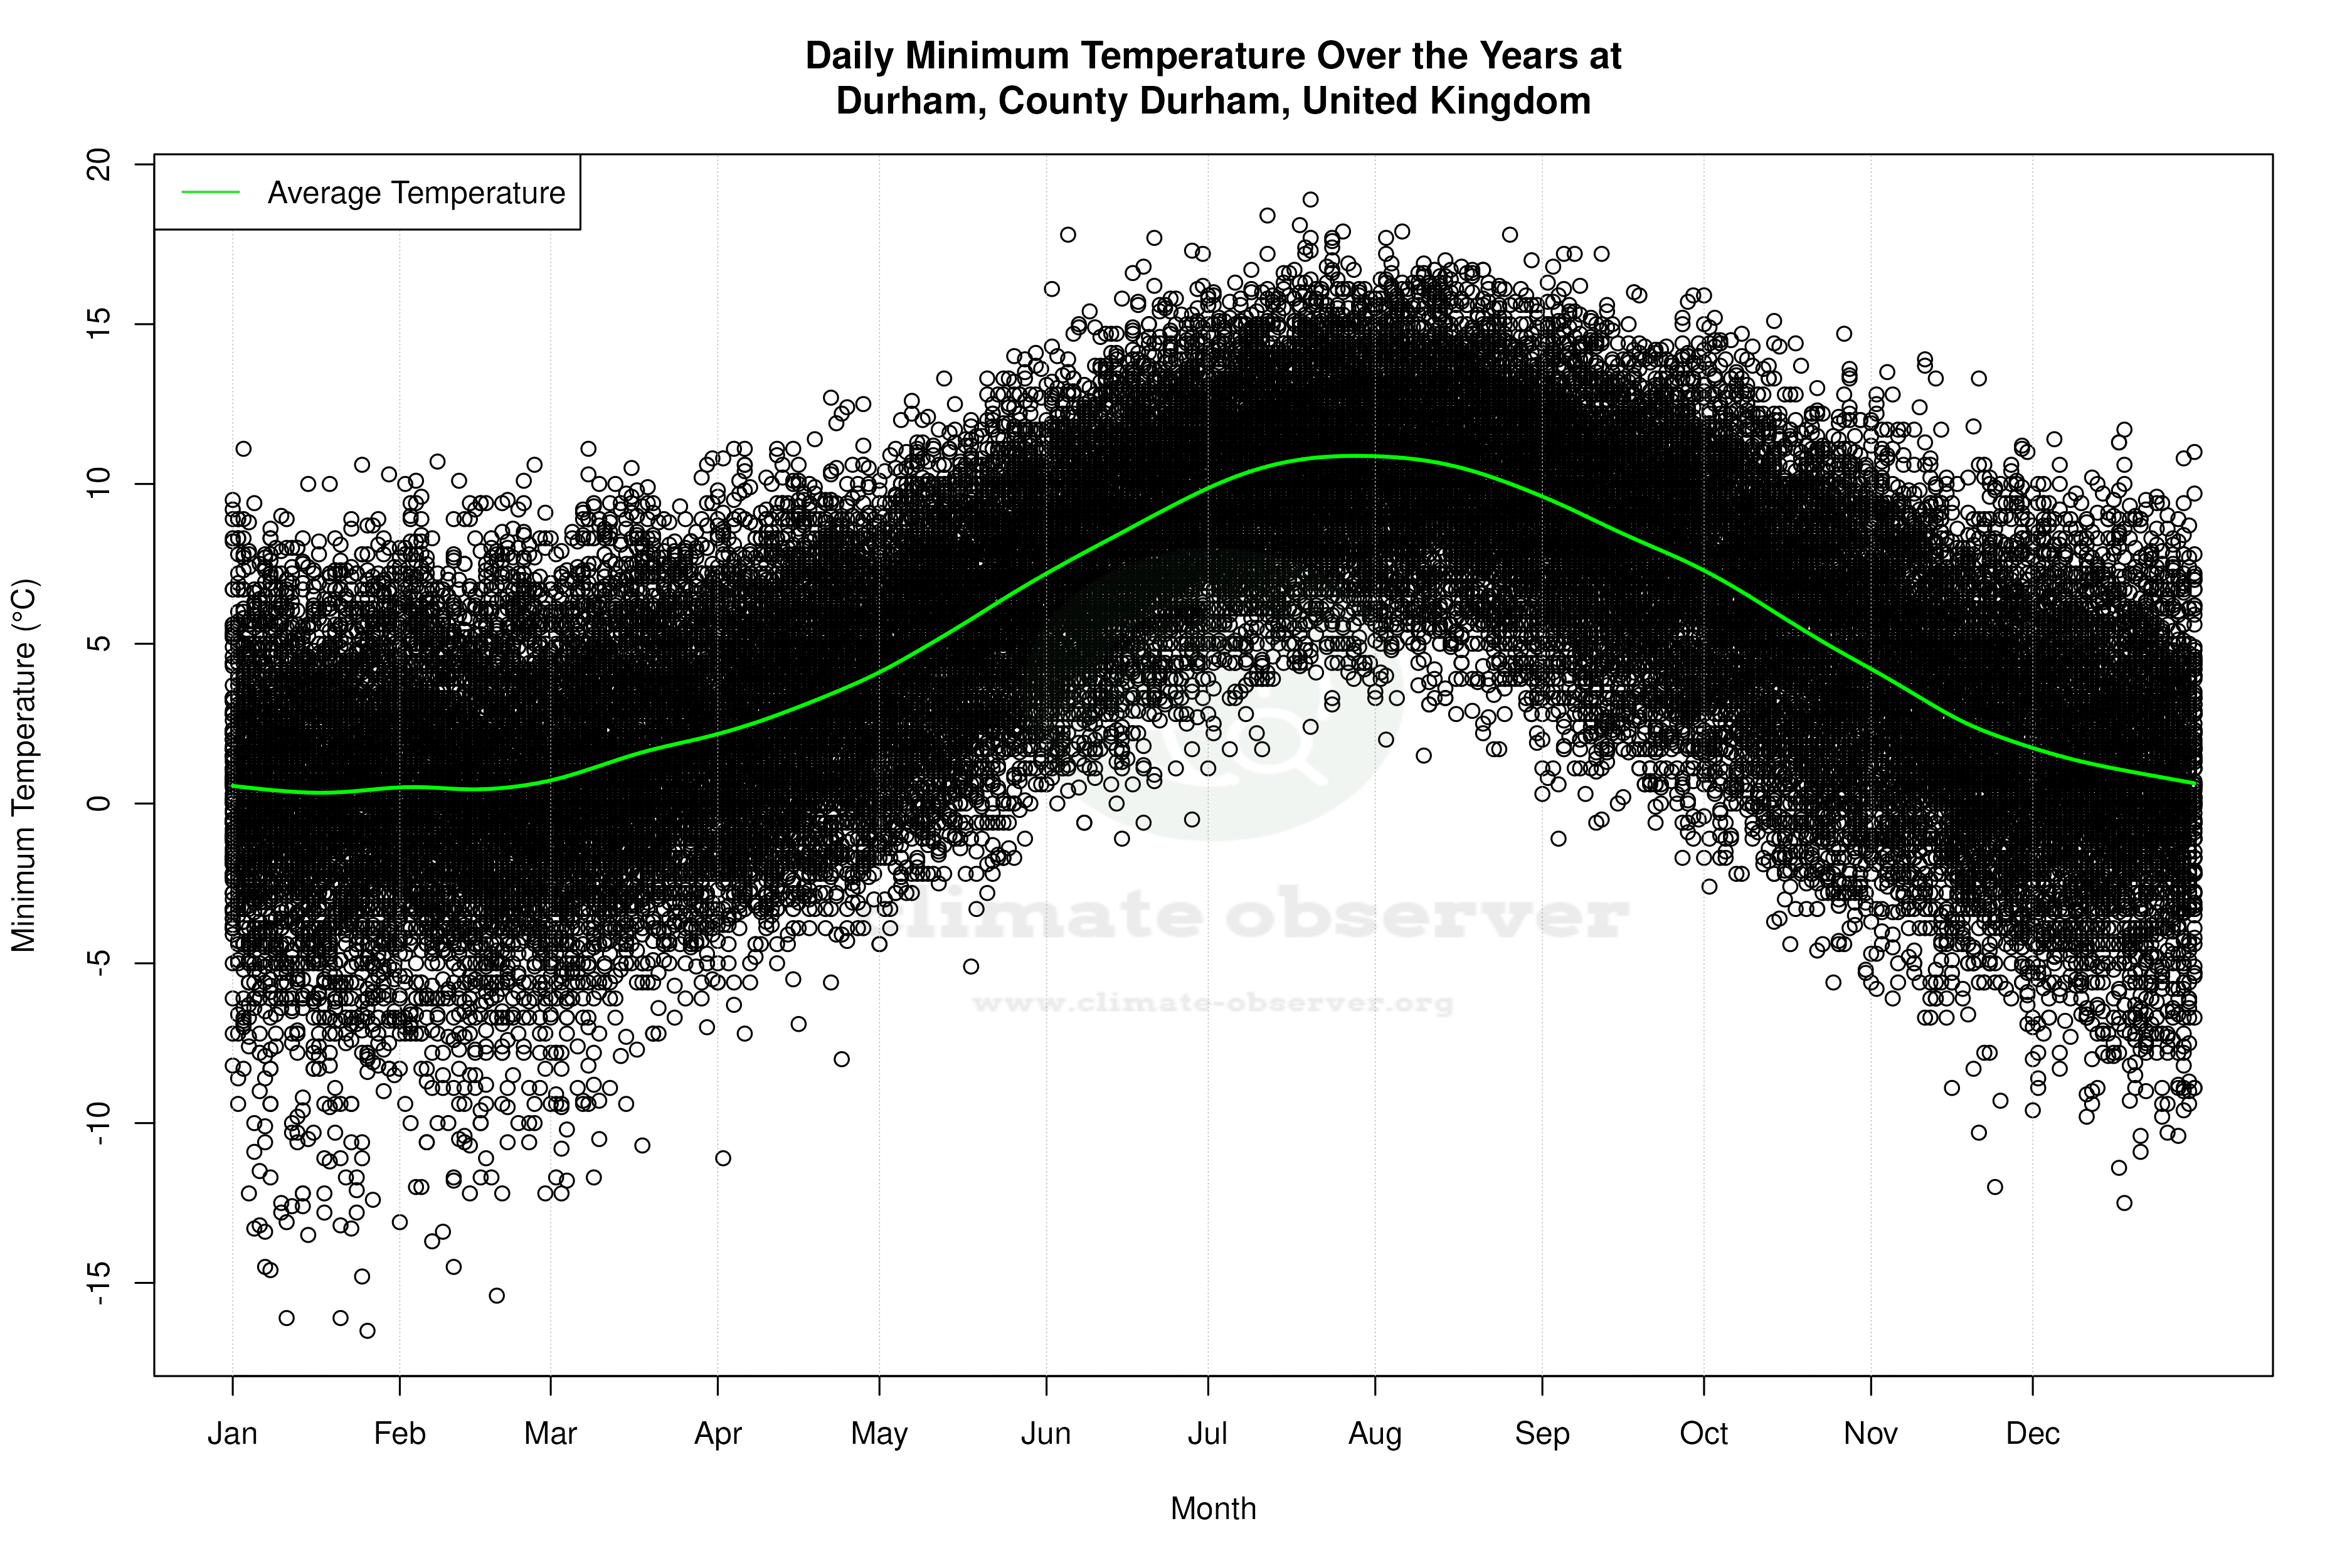

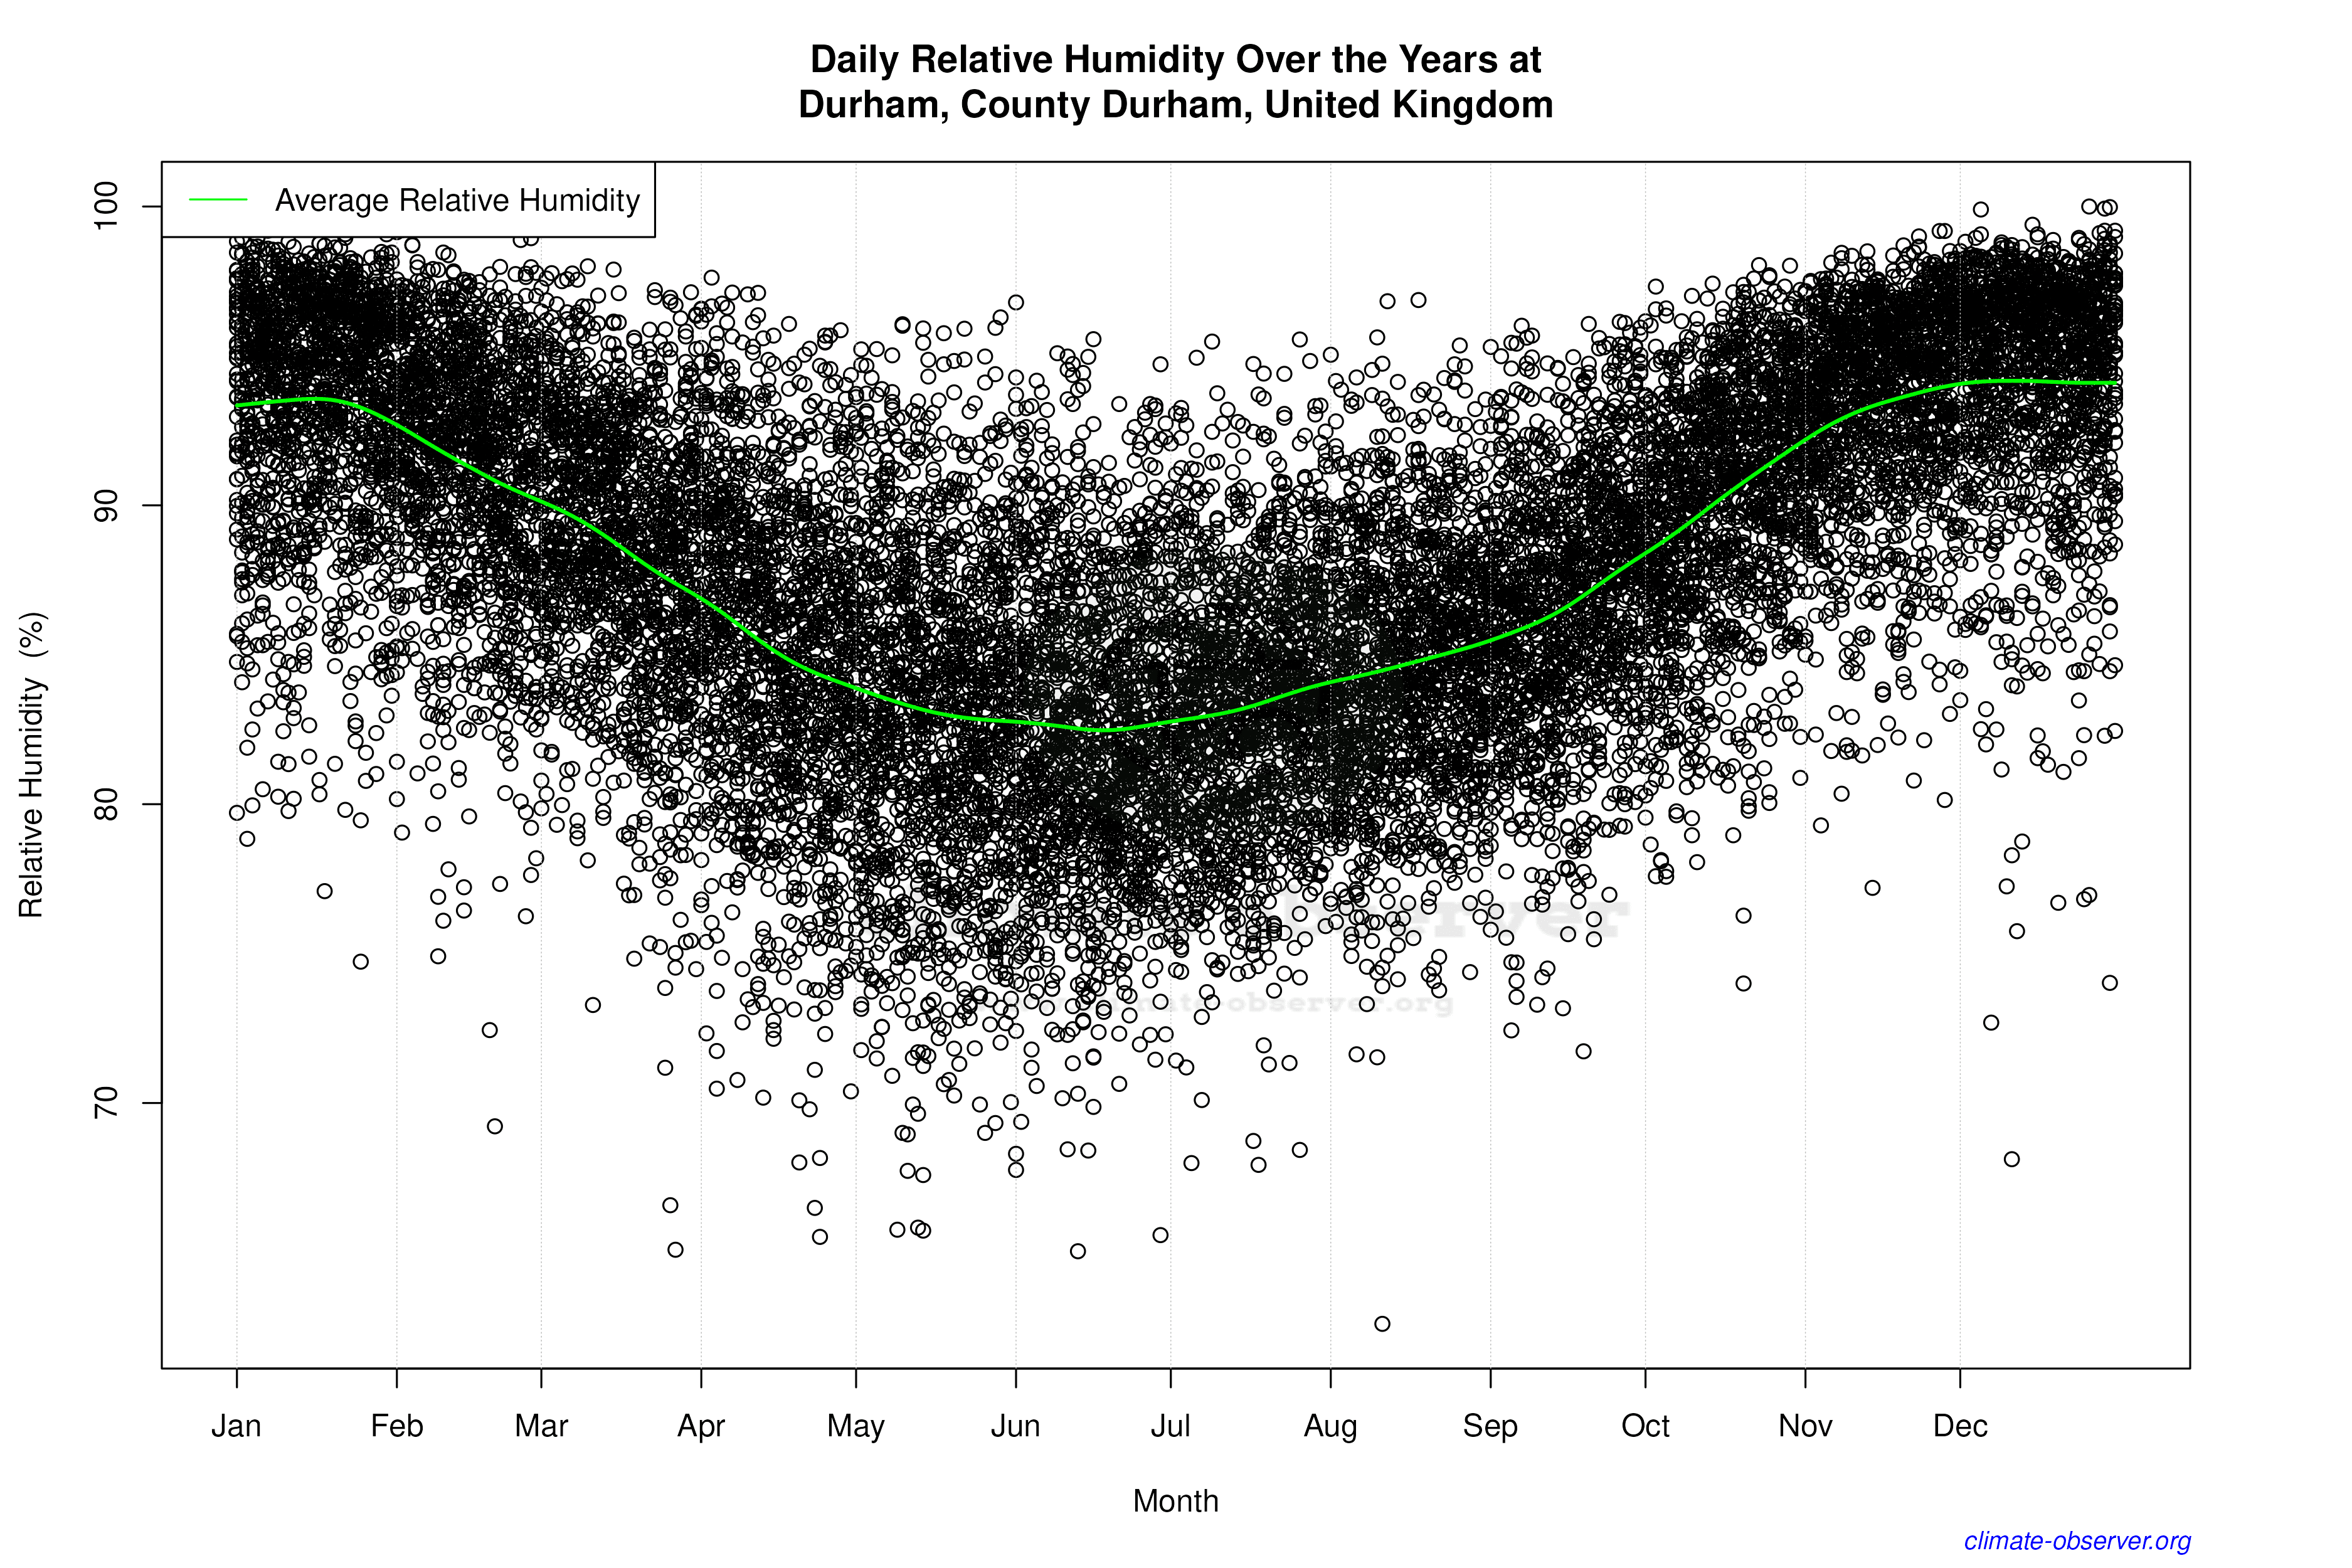

Average Max Temperature Throughout Year | 1 of 5
