Climate for Station: Shepetivka, Khmelnytskyi, Ukraine
Loading live weather...
Climate Analysis & Overview
Shepetivka's climate profile reveals a nuanced thermal landscape with a 0.31°C (0.56°F) rise in all-time high temperatures, juxtaposed against a recent 0.04°C (0.07°F) cooling trend over the past decade. Meanwhile, low temperatures have shown a consistent warming, with a notable 0.61°C (1.10°F) increase in the last ten years. The Precipitation Concentration Index has seen a slight increase, suggesting more concentrated rainfall events.
Continental Climate Dynamics
Shepetivka, situated in Ukraine's Khmelnytskyi Oblast, experiences a humid continental climate, characterised by cold winters and warm summers. The town's geographic location, away from moderating bodies of water, contributes to its pronounced seasonal temperature variations. The all-time trends indicate a 0.31°C (0.56°F) warming in high temperatures, suggesting a gradual increase in summer heat. In contrast, the past decade has seen a 0.04°C (0.07°F) cooling in highs, indicating a recent deviation from the long-term trend. This could be attributed to regional weather patterns or global climate variability.
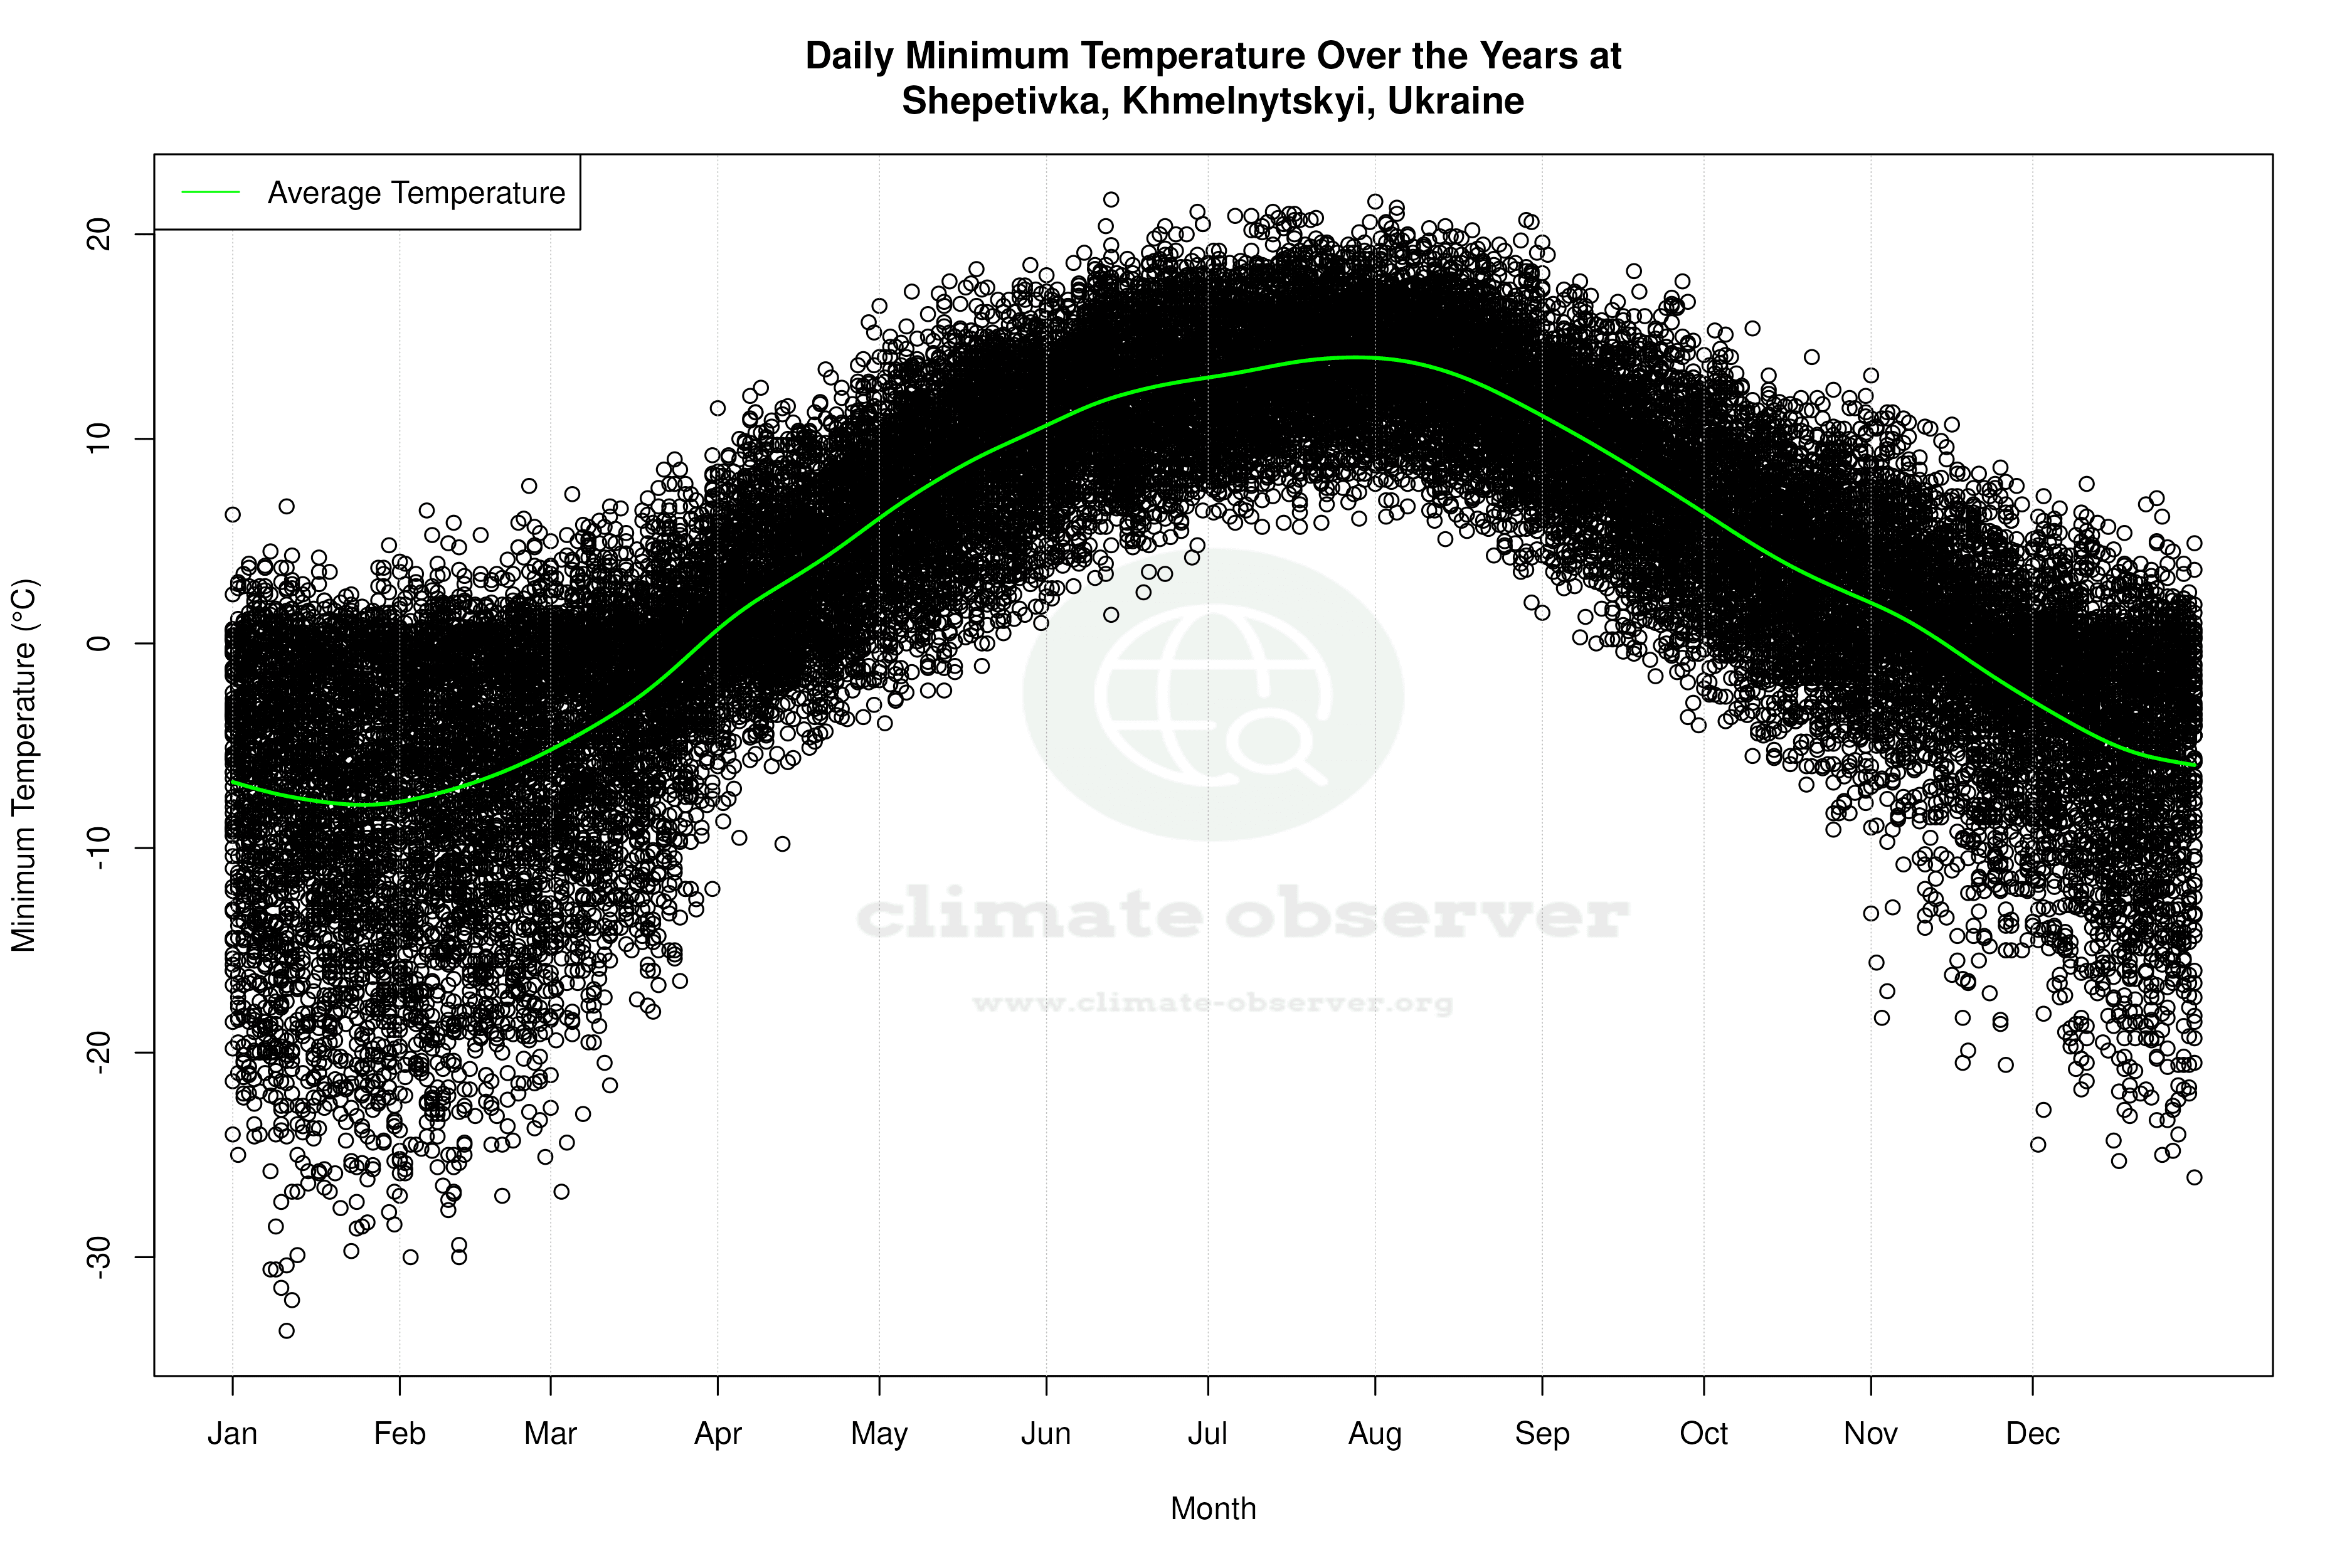
Winter Warmth and Summer Cool
The most significant change in Shepetivka's climate is the warming of low temperatures, with a 0.61°C (1.10°F) increase over the past decade. This warming trend is consistent with global patterns of milder winters, potentially reducing the frequency of extreme cold events. The all-time low temperature trend also shows a 0.24°C (0.43°F) rise, reinforcing this shift towards warmer winters. These changes could impact local ecosystems and agriculture, which rely on predictable seasonal cycles.
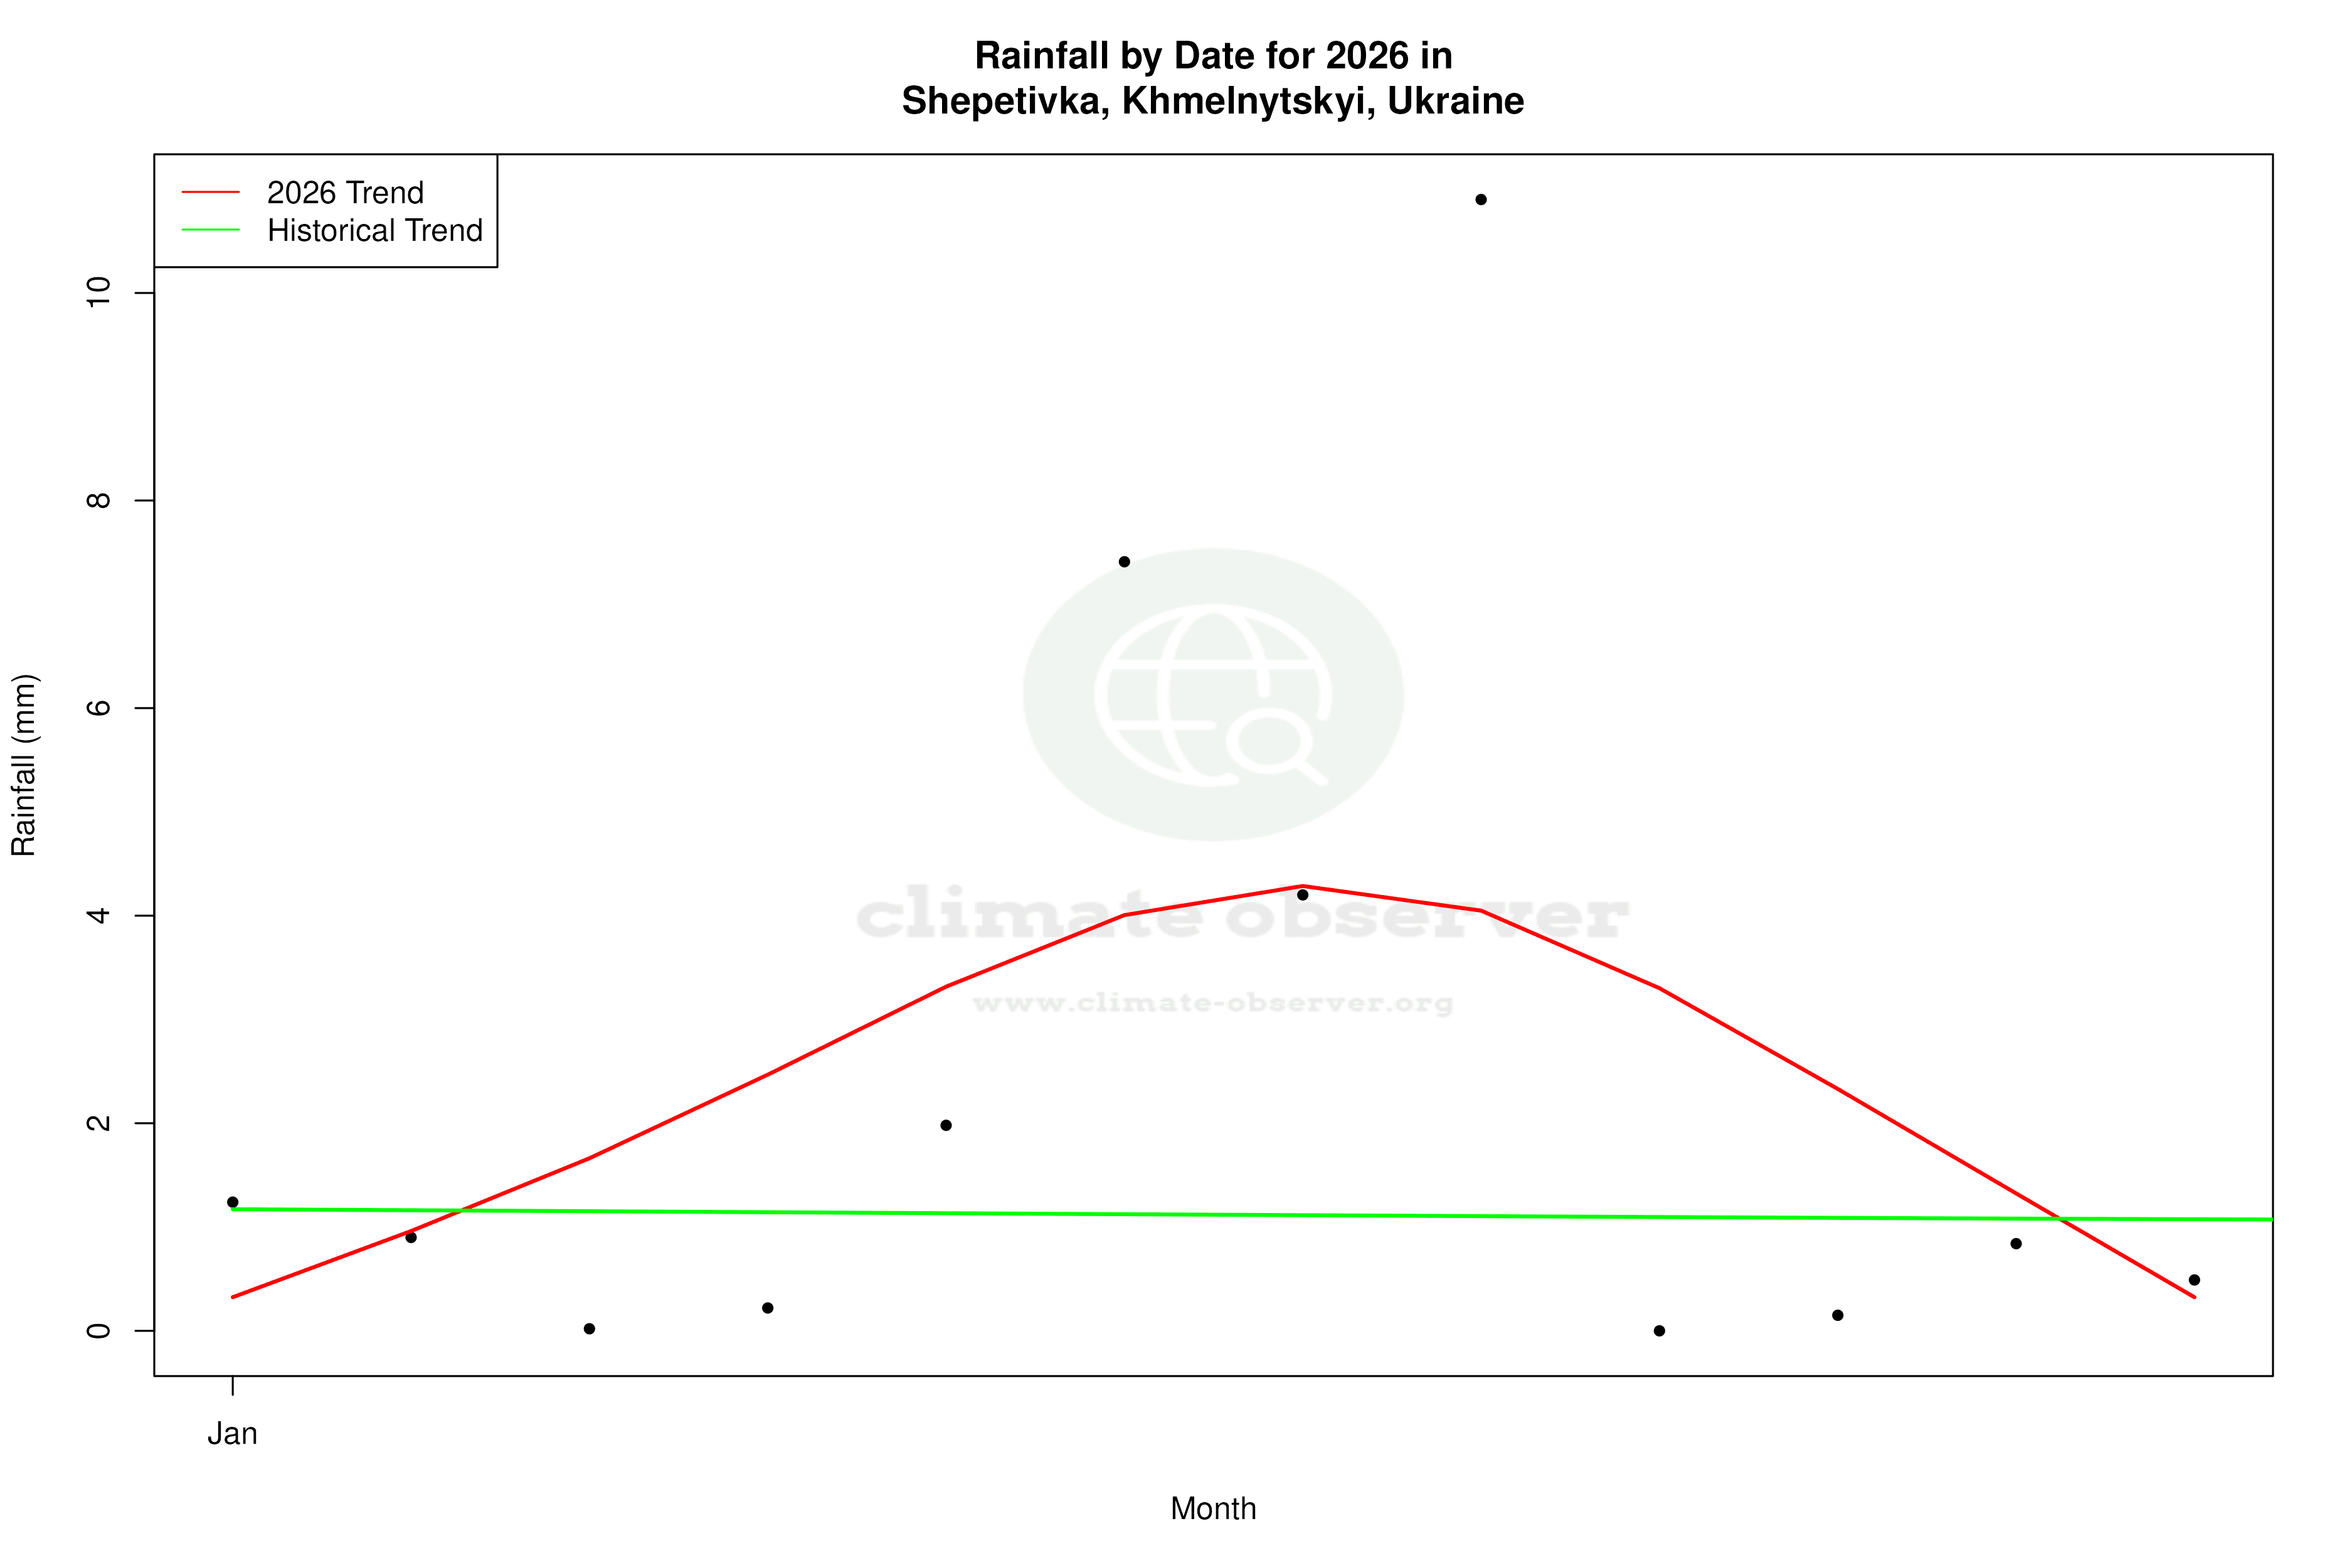
Precipitation Patterns and Concentration
The Precipitation Concentration Index (PCI) has increased slightly from 12.10 to 12.26, indicating a marginal rise in precipitation concentration. This suggests that rainfall is becoming more concentrated in fewer, heavier events, rather than being evenly distributed throughout the year. While the change is not large, it could influence water management strategies and agricultural planning in the region, as concentrated rainfall can lead to increased runoff and potential flooding.
Record Extremes and Regional Implications
Shepetivka's record high temperature stands at 36.6°C (97.9°F), while the record low is -33.6°C (-28.5°F). These extremes highlight the area's susceptibility to significant temperature fluctuations, a hallmark of continental climates. As Ukraine works towards its regional climate goals, understanding these localised trends is crucial for developing adaptive strategies to mitigate the impacts of climate change on agriculture and infrastructure. The observed warming of low temperatures aligns with national efforts to address the challenges posed by changing winter conditions.
Station Statistics
10-Year Trend
High: +1.16 °C/decade
Low: +1.03 °C/decade
Rain: +0.38 mm/decade
25-Year Trend
High: +0.92 °C/decade
Low: +0.53 °C/decade
Rain: +0.08 mm/decade
50-Year Trend
High: +0.72 °C/decade
Low: +0.42 °C/decade
Rain: +0.25 mm/decade
All-Time Trend
High: +0.28 °C/decade
Low: +0.22 °C/decade
Rain: +0.04 mm/decade
Percentage Above-Average Days
Last 12 Months: 54.0%
This Year: 68.4%
Precipitation Concentration Index (PCI) ℹ️
Last 12 Months: 14.3
Historical Average: 13.1
Percentile Rank of Last 12 Months ℹ️
High: 91st percentile
Low: 85th percentile
Rain: 75th percentile
Change in Variance ℹ️
High: -6.7%
Low: -16.5%
Intraday: +21.0%
Data Coverage
80.5%
First Year of Data
1926
Station Location
Historical Weather Records
| Max High | Avg High | Min High | Max Avg | Avg Avg | Min Avg | Max Low | Avg Low | Min Low | Max Precipitation | Avg Precipitation | Max Snow | Avg Snow | |
|---|---|---|---|---|---|---|---|---|---|---|---|---|---|
| Record | 36.6 °C | — | -27.1 °C | 30.8 °C | — | -27.4 °C | 21.7 °C | — | -33.6 °C | 111.5 mm | — | — | — |
| January | 14.3 °C | -2.1 °C | -27.1 °C | 8.8 °C | -4.1 °C | -27.4 °C | 6.7 °C | -7.6 °C | -33.6 °C | 22.3 mm | 1.1 mm | — | — |
| February | 16.4 °C | -0.6 °C | -18.6 °C | 8.9 °C | -3.1 °C | -22.9 °C | 7.7 °C | -6.7 °C | -30.0 °C | 23.3 mm | 1.1 mm | — | — |
| March | 23.5 °C | 4.6 °C | -15.0 °C | 16.3 °C | 1.3 °C | -19.5 °C | 9.2 °C | -2.7 °C | -26.8 °C | 27.9 mm | 1.0 mm | — | — |
| April | 30.6 °C | 13.2 °C | -2.6 °C | 22.5 °C | 8.1 °C | -4.0 °C | 15.7 °C | 3.3 °C | -9.8 °C | 33.7 mm | 1.3 mm | — | — |
| May | 31.5 °C | 19.6 °C | 4.5 °C | 29.8 °C | 13.9 °C | 1.4 °C | 18.5 °C | 8.5 °C | -3.9 °C | 61.6 mm | 1.8 mm | — | — |
| June | 33.8 °C | 22.8 °C | 7.4 °C | 27.2 °C | 17.2 °C | 7.5 °C | 21.7 °C | 12.1 °C | 1.4 °C | 60.1 mm | 2.6 mm | — | — |
| July | 35.1 °C | 24.3 °C | 12.4 °C | 30.8 °C | 18.8 °C | 9.1 °C | 21.1 °C | 13.6 °C | 5.7 °C | 111.5 mm | 2.8 mm | — | — |
| August | 36.6 °C | 23.9 °C | 7.9 °C | 28.1 °C | 18.2 °C | 8.2 °C | 21.6 °C | 13.0 °C | 2.0 °C | 60.2 mm | 2.2 mm | — | — |
| September | 36.6 °C | 19.0 °C | 4.0 °C | 27.4 °C | 13.5 °C | 0.1 °C | 19.6 °C | 8.9 °C | -4.0 °C | 63.0 mm | 1.7 mm | — | — |
| October | 27.3 °C | 12.2 °C | -2.1 °C | 18.9 °C | 7.7 °C | -6.0 °C | 15.4 °C | 4.0 °C | -9.1 °C | 51.3 mm | 1.3 mm | — | — |
| November | 22.8 °C | 5.0 °C | -9.1 °C | 14.6 °C | 2.1 °C | -14.5 °C | 13.1 °C | -0.2 °C | -20.6 °C | 39.2 mm | 1.3 mm | — | — |
| December | 13.8 °C | 0.0 °C | -18.1 °C | 9.5 °C | -1.8 °C | -22.6 °C | 7.8 °C | -4.7 °C | -26.1 °C | 23.9 mm | 1.3 mm | — | — |
Data Visualisations
Remove WatermarksCurrent Year Climate Trends vs Historical


Max Temperature this Year | 1 of 6
Climate 12-Month Moving Averages


Max Temperature 12-Month MA | 1 of 6
Daily Data Points and Averages Throughout the Year


Average Max Temperature Throughout Year | 1 of 5
