Climate for Station: Kiev, Kyiv City, Ukraine
Loading live weather...
Climate Analysis & Overview
Kiev's climate is experiencing a nuanced warming trend, with more pronounced increases in low temperatures than highs over the past decade. Precipitation has become more evenly distributed, indicating a shift towards a more balanced hydrological pattern. These changes align with Ukraine's broader climate adaptation strategies.
Kiev's Warming Patterns
Kiev, classified under the Dfb category of the Köppen climate classification, experiences a humid continental climate with cold winters and warm summers. The city's geographical position, nestled along the Dnieper River, influences its climate dynamics. Over the past decade, Kiev has seen a notable warming trend in both high and low temperatures. Specifically, the 10-year trend shows an increase of 0.93°C (1.67°F) in high temperatures and a more substantial rise of 2.45°C (4.41°F) in low temperatures. These shifts suggest a trend towards milder winters, which could have significant ecological and socio-economic implications for the region.
Long-term Climate Evolution
When examining the all-time climate trends, Kiev exhibits a more modest warming pattern. High temperatures have risen by 0.17°C (0.31°F), while low temperatures have increased by 0.19°C (0.34°F). This long-term data indicates a gradual warming, consistent with global climate trends. The difference in magnitude between the 10-year and all-time trends highlights the importance of recent climate variability, which may be influenced by factors such as urbanisation and regional climate policies.
Precipitation Dynamics
The Precipitation Concentration Index (PCI) is a measure of how precipitation is distributed throughout the year. A decrease in PCI from a baseline of 11.77 to a current value of 9.73 suggests that precipitation events in Kiev have become more evenly distributed over time. This shift towards a more balanced precipitation pattern could mitigate the risks of both drought and flooding, aligning with Ukraine's climate resilience goals. The current PCI value, being below 10, indicates a very even distribution, which is beneficial for agriculture and water management.
Temperature Extremes and Records
Kiev has recorded an absolute maximum temperature of 39.9°C (103.8°F) and a minimum of -32.2°C (-26.0°F). These extremes highlight the city's capacity for significant temperature variability, a characteristic of its continental climate. Understanding these records is crucial for infrastructure planning and emergency preparedness, especially in the context of increasing temperature variability.
Regional Climate Implications
The observed climatic changes in Kiev are reflective of broader regional patterns in Eastern Europe. The warming trends, particularly in low temperatures, suggest potential shifts in agricultural zones and biodiversity. As Ukraine continues to develop its climate adaptation strategies, these insights into Kiev's evolving climate will be critical for informed policy-making and sustainable urban development.
Station Statistics
10-Year Trend
High: +0.70 °C/decade
Low: +2.26 °C/decade
Rain: -0.28 mm/decade
25-Year Trend
High: +0.81 °C/decade
Low: +0.50 °C/decade
Rain: +0.02 mm/decade
50-Year Trend
High: +0.69 °C/decade
Low: +0.38 °C/decade
Rain: +0.01 mm/decade
All-Time Trend
High: +0.17 °C/decade
Low: +0.19 °C/decade
Rain: +0.01 mm/decade
Percentage Above-Average Days
Last 12 Months: 51.2%
This Year: 63.1%
Precipitation Concentration Index (PCI) ℹ️
Last 12 Months: 11.0
Historical Average: 11.5
Percentile Rank of Last 12 Months ℹ️
High: 92nd percentile
Low: 96th percentile
Rain: 24th percentile
Change in Variance ℹ️
High: -6.8%
Low: -17.0%
Intraday: +35.2%
Data Coverage
99.2%
First Year of Data
1881
Station Location
Historical Weather Records
| Max High | Avg High | Min High | Max Avg | Avg Avg | Min Avg | Max Low | Avg Low | Min Low | Max Precipitation | Avg Precipitation | Max Snow | Avg Snow | |
|---|---|---|---|---|---|---|---|---|---|---|---|---|---|
| Record | 39.9 °C | — | -25.6 °C | 30.8 °C | — | -28.6 °C | 24.8 °C | — | -32.2 °C | 103.4 mm | — | — | — |
| January | 13.2 °C | -2.4 °C | -25.6 °C | 10.9 °C | -5.1 °C | -28.6 °C | 6.2 °C | -7.8 °C | -31.1 °C | 31.8 mm | 1.3 mm | — | — |
| February | 17.3 °C | -1.1 °C | -23.7 °C | 11.6 °C | -4.2 °C | -27.4 °C | 7.2 °C | -7.2 °C | -32.2 °C | 41.5 mm | 1.4 mm | — | — |
| March | 25.0 °C | 4.4 °C | -14.6 °C | 17.3 °C | 0.5 °C | -20.2 °C | 11.6 °C | -2.6 °C | -24.9 °C | 43.2 mm | 1.3 mm | — | — |
| April | 30.2 °C | 13.1 °C | -2.8 °C | 23.2 °C | 8.3 °C | -6.4 °C | 16.3 °C | 4.2 °C | -10.4 °C | 43.5 mm | 1.5 mm | — | — |
| May | 33.1 °C | 20.5 °C | 4.2 °C | 29.2 °C | 15.1 °C | 1.5 °C | 20.7 °C | 10.2 °C | -2.4 °C | 79.4 mm | 1.8 mm | — | — |
| June | 35.5 °C | 23.8 °C | 6.8 °C | 28.6 °C | 18.5 °C | 4.8 °C | 22.7 °C | 13.5 °C | 2.4 °C | 83.2 mm | 2.4 mm | — | — |
| July | 39.4 °C | 25.6 °C | 12.8 °C | 30.4 °C | 20.2 °C | 10.5 °C | 24.8 °C | 15.3 °C | 5.8 °C | 103.4 mm | 2.5 mm | — | — |
| August | 39.9 °C | 24.8 °C | 10.2 °C | 30.8 °C | 19.2 °C | 8.0 °C | 24.5 °C | 14.3 °C | 3.3 °C | 73.4 mm | 2.0 mm | — | — |
| September | 35.7 °C | 19.5 °C | 0.8 °C | 27.6 °C | 14.1 °C | 0.0 °C | 21.6 °C | 9.8 °C | -2.9 °C | 99.9 mm | 1.6 mm | — | — |
| October | 29.5 °C | 12.2 °C | -10.2 °C | 23.1 °C | 7.9 °C | -13.8 °C | 16.5 °C | 4.4 °C | -17.8 °C | 49.5 mm | 1.4 mm | — | — |
| November | 23.2 °C | 4.4 °C | -18.4 °C | 16.3 °C | 1.8 °C | -20.9 °C | 14.0 °C | -0.6 °C | -21.9 °C | 48.6 mm | 1.6 mm | — | — |
| December | 15.2 °C | -0.4 °C | -22.4 °C | 10.5 °C | -2.7 °C | -26.1 °C | 8.9 °C | -5.0 °C | -30.0 °C | 40.8 mm | 1.5 mm | — | — |
Data Visualisations
Remove WatermarksCurrent Year Climate Trends vs Historical


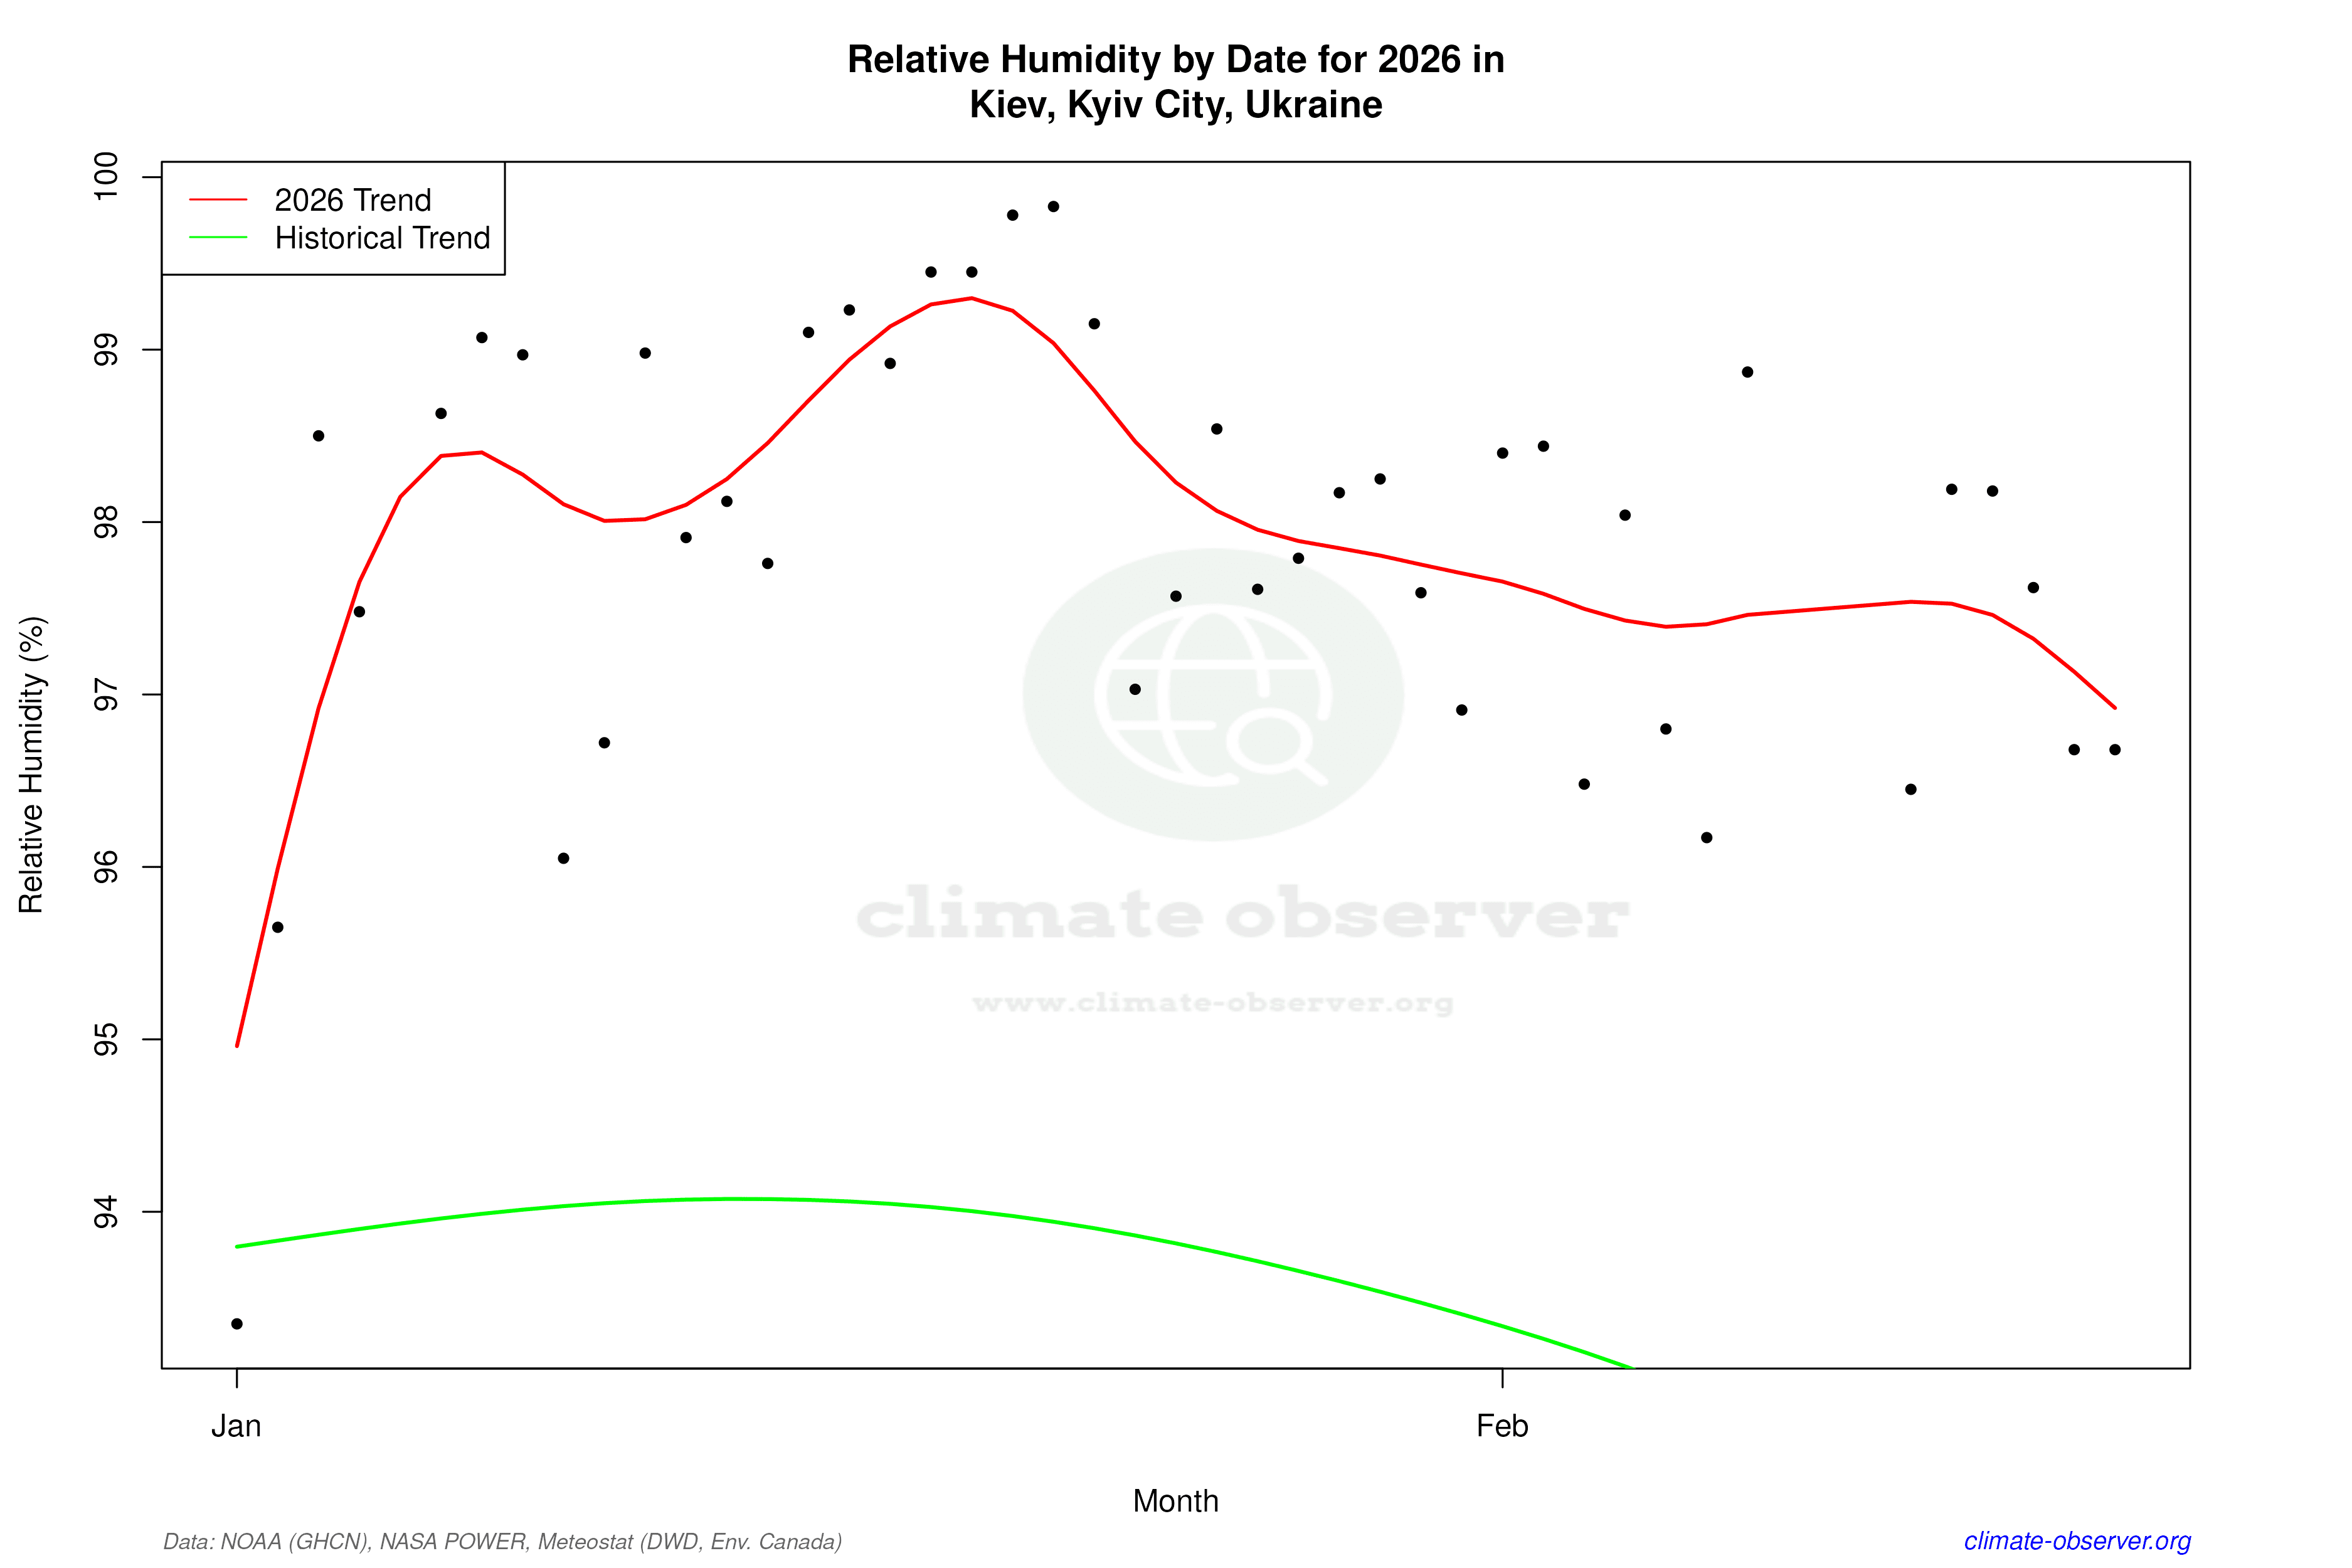

Max Temperature this Year | 1 of 6
Climate 12-Month Moving Averages


Max Temperature 12-Month MA | 1 of 6
Daily Data Points and Averages Throughout the Year


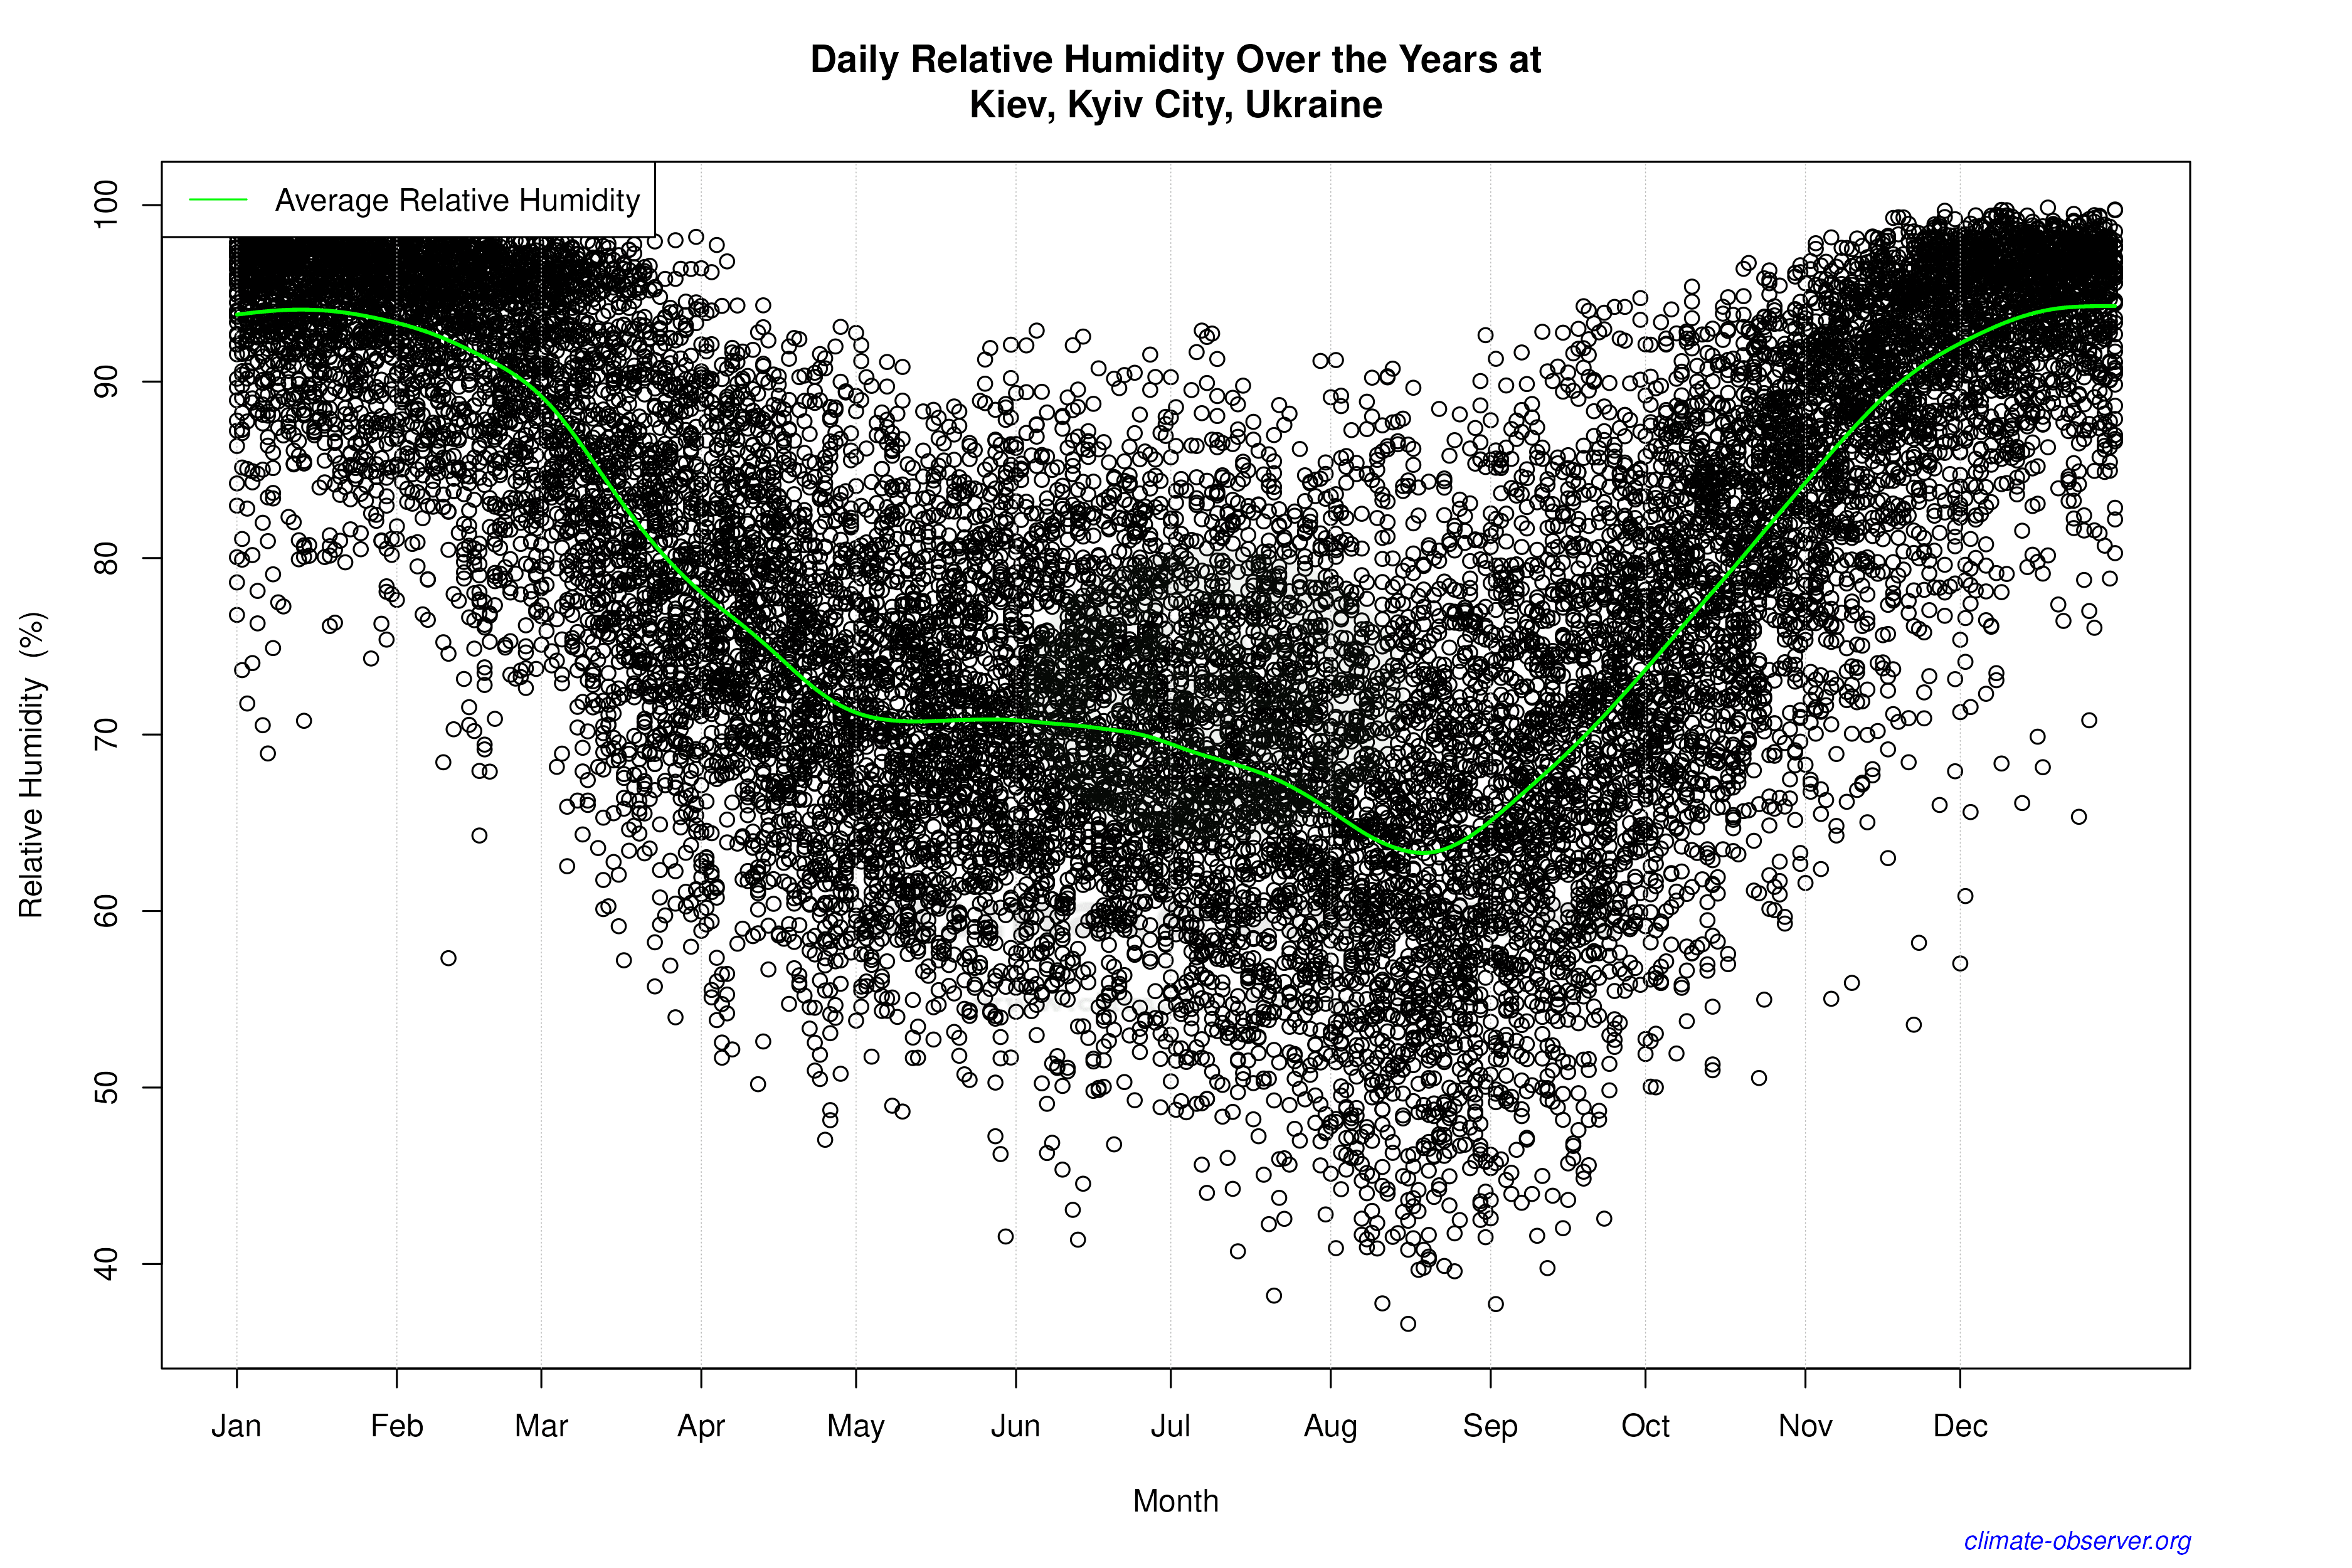

Average Max Temperature Throughout Year | 1 of 5
