Climate for Station: Lubny, Poltava, Ukraine
Loading live weather...
Climate Analysis & Overview
Lubny, nestled in the heart of Ukraine, is experiencing a warming trend in both highs and lows over the past decade, with a notable increase in temperature extremes. The region's precipitation patterns have become more evenly distributed, reflecting a shift in local climate dynamics. This aligns with Ukraine's broader climate goals of adapting to changing weather patterns.
Climatic Context of Lubny
Lubny, located at 50.02°N, 33.0°E, falls within the humid continental climate zone according to the Köppen classification. This region typically experiences cold winters and warm summers. The local geography, characterised by its proximity to the Sula River and expansive plains, influences the area's weather patterns by moderating temperature extremes and affecting precipitation distribution.
Temperature Trends: A Warming Narrative
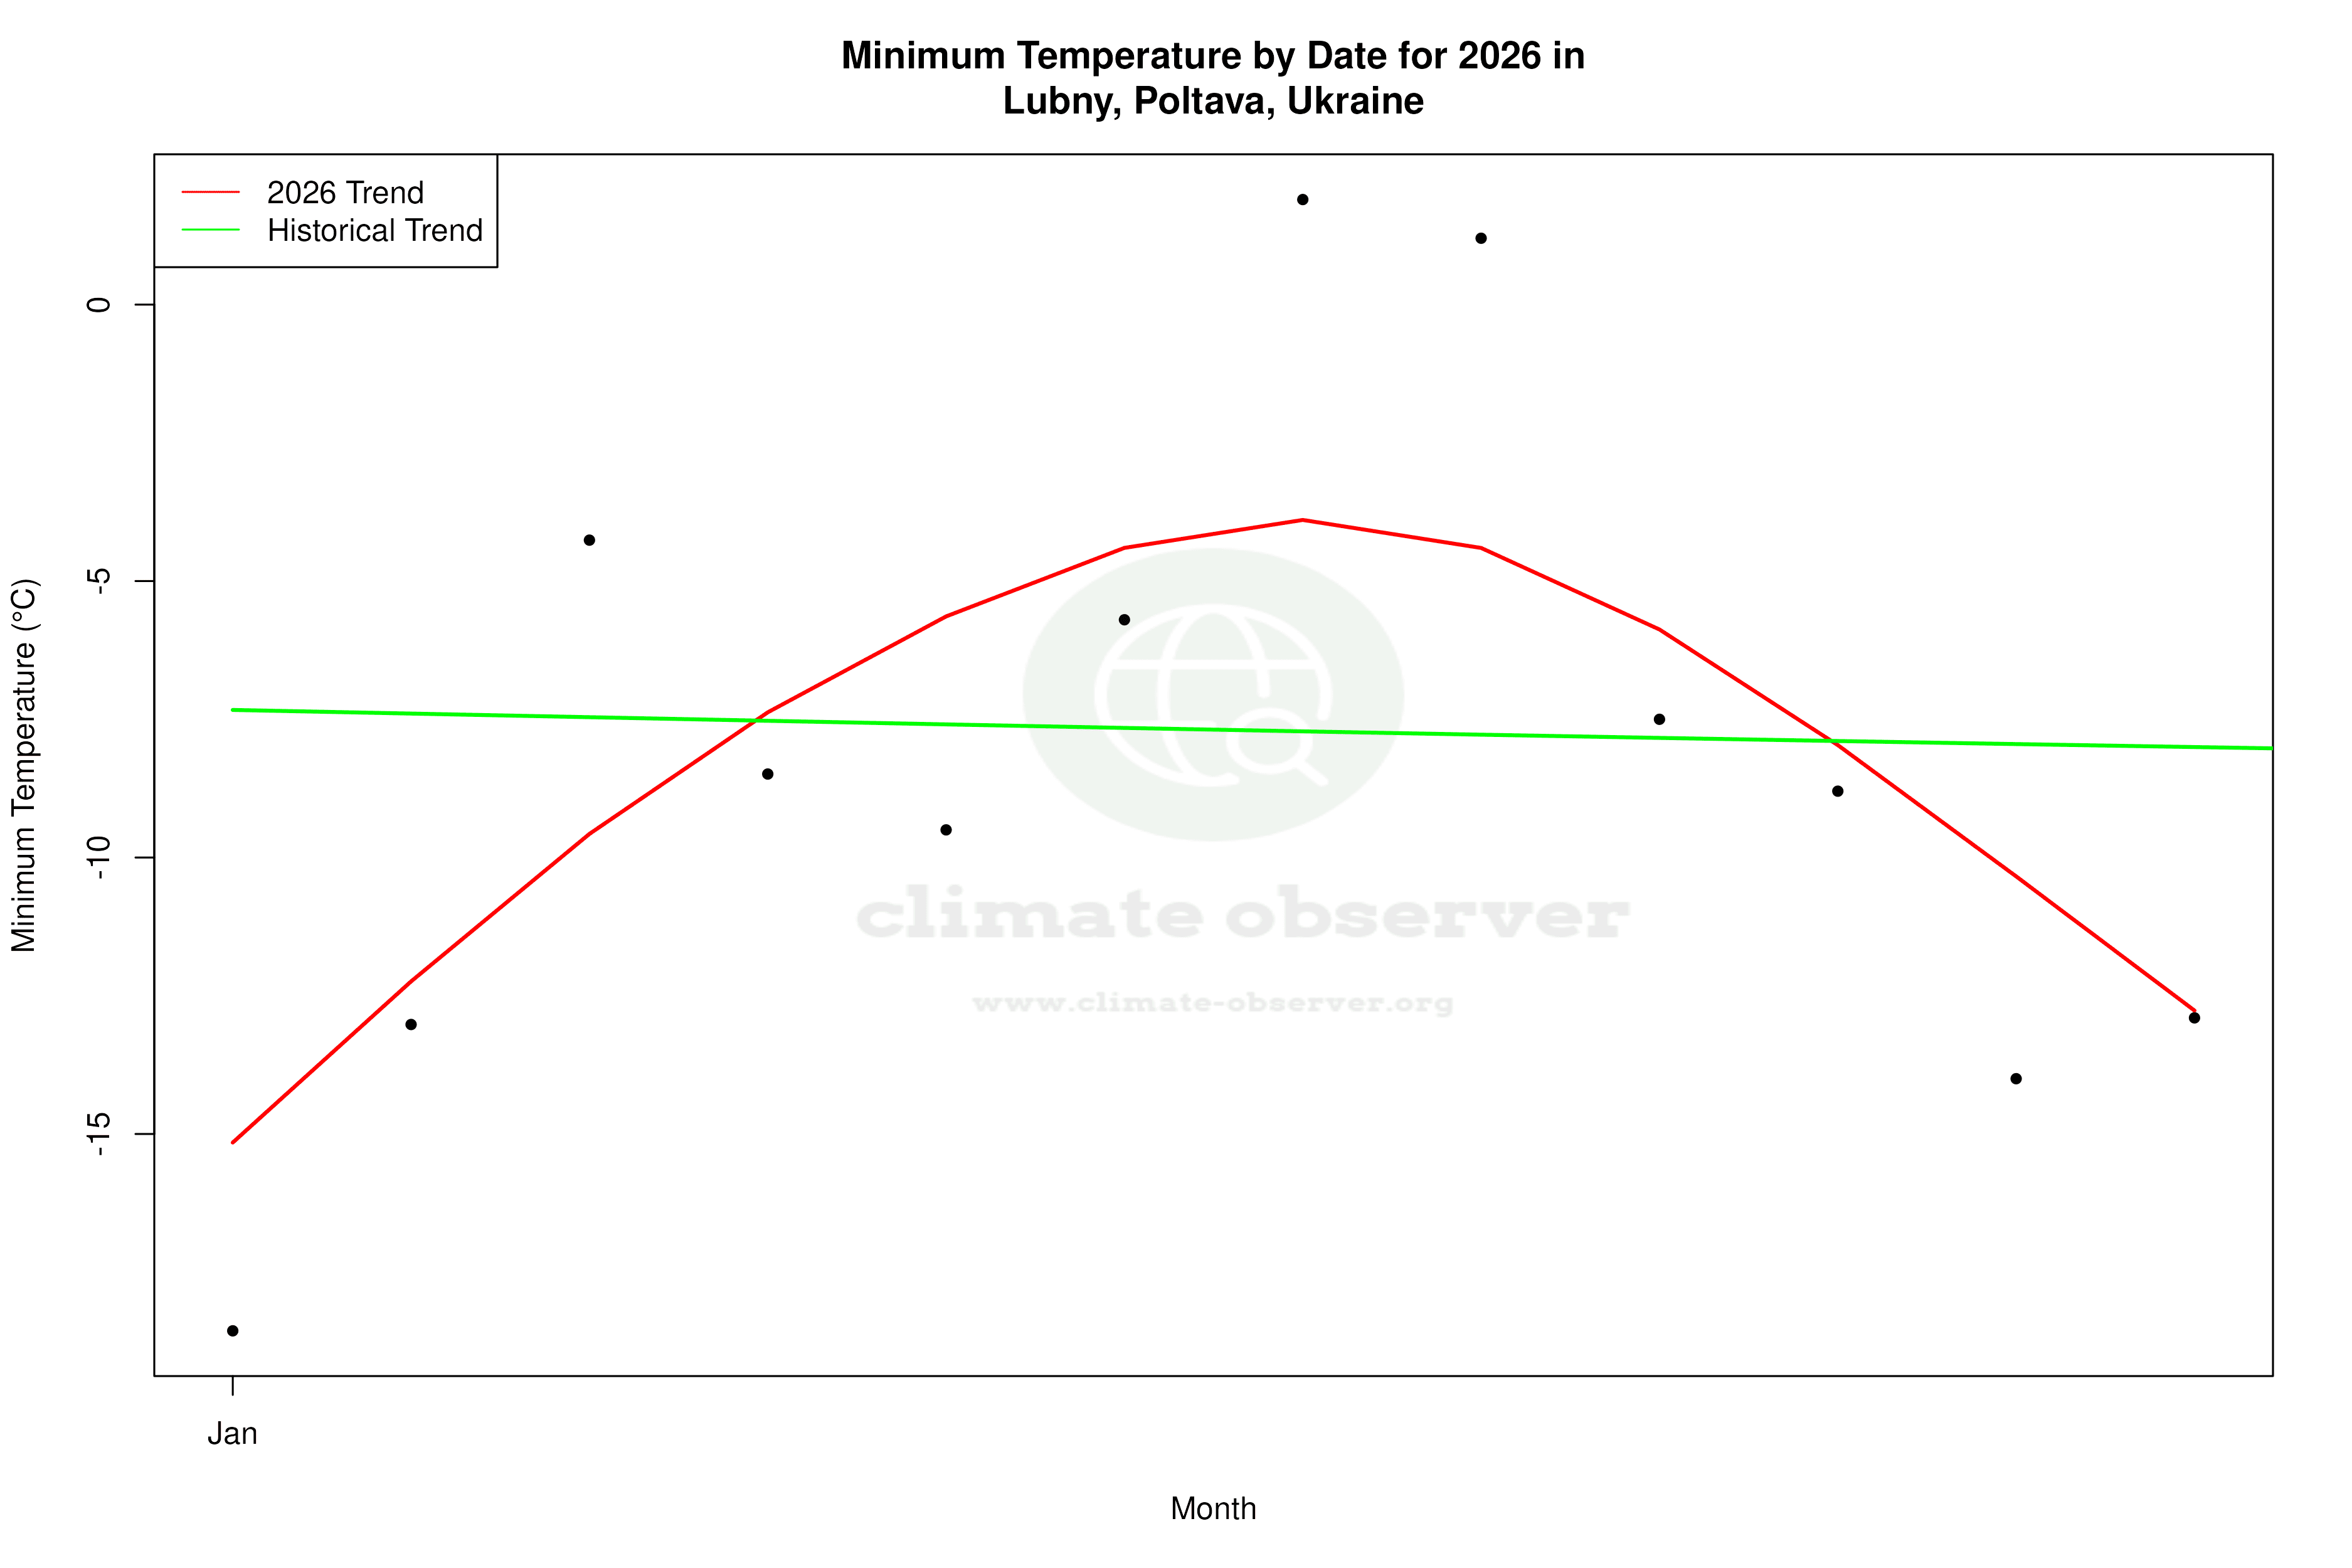
Over the last decade, Lubny has seen a significant warming trend. High temperatures have increased by 0.69°C (1.24°F), while low temperatures have seen an even more pronounced rise of 1.17°C (2.10°F). These figures suggest a notable shift towards warmer conditions, which is more pronounced than the all-time trends. Historically, the all-time high temperatures have increased by 0.29°C (0.52°F), and lows by 0.31°C (0.56°F), indicating a long-term warming trend. This warming aligns with Ukraine's climate adaptation strategies, which aim to mitigate the impacts of rising temperatures.
Precipitation Patterns: A Shift Towards Even Distribution
The Precipitation Concentration Index (PCI) for Lubny has decreased from a baseline of 11.65 to a current value of 9.76. This change indicates a more even distribution of rainfall throughout the year, reducing the concentration of precipitation in fewer, more intense events. Such a shift can lead to more stable agricultural conditions, essential for a region that relies heavily on farming.
Temperature Extremes: Record Highs and Lows
Lubny's climate history is marked by significant temperature extremes, with a record high of 39.5°C (103.1°F) and a record low of -32.1°C (-25.8°F). These extremes highlight the variability inherent in the region's climate, which can pose challenges for both agriculture and infrastructure. The increasing frequency of such extremes necessitates adaptive measures to protect local communities and economies.
Regional Climate Implications
The observed climatic changes in Lubny are indicative of broader regional trends in Ukraine, where efforts are underway to address the impacts of climate change. The country's climate goals include enhancing resilience to temperature extremes and ensuring sustainable water management in the face of shifting precipitation patterns. As Lubny continues to warm, these goals become increasingly relevant, demanding strategic planning and implementation at both local and national levels.
Station Statistics
10-Year Trend
High: +0.64 °C/decade
Low: +0.81 °C/decade
Rain: +0.04 mm/decade
25-Year Trend
High: +0.89 °C/decade
Low: +0.69 °C/decade
Rain: +0.03 mm/decade
50-Year Trend
High: +0.64 °C/decade
Low: +0.56 °C/decade
Rain: -0.03 mm/decade
All-Time Trend
High: +0.30 °C/decade
Low: +0.31 °C/decade
Rain: +0.03 mm/decade
Percentage Above-Average Days
Last 12 Months: 57.0%
This Year: 73.7%
Precipitation Concentration Index (PCI) ℹ️
Last 12 Months: 10.3
Historical Average: 12.8
Percentile Rank of Last 12 Months ℹ️
High: 95th percentile
Low: 96th percentile
Rain: 26th percentile
Change in Variance ℹ️
High: -9.6%
Low: -16.9%
Intraday: +8.1%
Data Coverage
99.1%
First Year of Data
1951
Station Location
Historical Weather Records
| Max High | Avg High | Min High | Max Avg | Avg Avg | Min Avg | Max Low | Avg Low | Min Low | Max Precipitation | Avg Precipitation | Max Snow | Avg Snow | |
|---|---|---|---|---|---|---|---|---|---|---|---|---|---|
| Record | 39.5 °C | — | -27.0 °C | 31.4 °C | — | -29.7 °C | 24.9 °C | — | -32.1 °C | 83.2 mm | — | — | — |
| January | 11.2 °C | -2.7 °C | -27.0 °C | 7.5 °C | -5.4 °C | -29.7 °C | 6.1 °C | -8.2 °C | -32.1 °C | 32.3 mm | 1.4 mm | — | — |
| February | 15.5 °C | -1.5 °C | -24.3 °C | 9.3 °C | -4.6 °C | -26.8 °C | 5.9 °C | -7.4 °C | -29.3 °C | 29.7 mm | 1.4 mm | — | — |
| March | 22.4 °C | 4.1 °C | -15.8 °C | 15.0 °C | 0.3 °C | -22.4 °C | 10.5 °C | -2.8 °C | -27.0 °C | 31.3 mm | 1.3 mm | — | — |
| April | 30.0 °C | 13.7 °C | -3.2 °C | 22.3 °C | 8.7 °C | -4.7 °C | 16.5 °C | 4.4 °C | -9.5 °C | 43.8 mm | 1.3 mm | — | — |
| May | 34.4 °C | 20.9 °C | 5.2 °C | 31.0 °C | 15.3 °C | 2.4 °C | 21.5 °C | 9.9 °C | -2.4 °C | 43.4 mm | 1.6 mm | — | — |
| June | 35.1 °C | 24.4 °C | 10.8 °C | 28.4 °C | 19.0 °C | 8.2 °C | 23.8 °C | 13.7 °C | 2.8 °C | 57.8 mm | 2.3 mm | — | — |
| July | 36.2 °C | 26.2 °C | 14.2 °C | 30.4 °C | 20.7 °C | 10.6 °C | 23.6 °C | 15.5 °C | 4.6 °C | 55.9 mm | 2.2 mm | — | — |
| August | 39.5 °C | 25.6 °C | 10.2 °C | 31.4 °C | 19.7 °C | 8.6 °C | 24.9 °C | 14.4 °C | 2.7 °C | 83.2 mm | 1.7 mm | — | — |
| September | 35.0 °C | 20.0 °C | 3.6 °C | 27.8 °C | 14.2 °C | 1.6 °C | 21.8 °C | 9.5 °C | -4.0 °C | 56.4 mm | 1.5 mm | — | — |
| October | 29.1 °C | 12.2 °C | -2.4 °C | 21.8 °C | 7.6 °C | -6.5 °C | 16.5 °C | 3.9 °C | -8.5 °C | 46.0 mm | 1.5 mm | — | — |
| November | 19.2 °C | 4.4 °C | -11.6 °C | 15.7 °C | 1.7 °C | -15.4 °C | 14.3 °C | -0.8 °C | -20.5 °C | 32.5 mm | 1.6 mm | — | — |
| December | 13.8 °C | -0.5 °C | -21.4 °C | 9.7 °C | -2.9 °C | -24.2 °C | 8.6 °C | -5.2 °C | -27.0 °C | 34.8 mm | 1.6 mm | — | — |
Data Visualisations
Remove WatermarksCurrent Year Climate Trends vs Historical


Max Temperature this Year | 1 of 6
Climate 12-Month Moving Averages


Max Temperature 12-Month MA | 1 of 6
Daily Data Points and Averages Throughout the Year


Average Max Temperature Throughout Year | 1 of 5
