Climate for Station: Greensboro, Alabama, United States
Loading live weather...
Climate Analysis & Overview
Greensboro, located in Hale County, Alabama, exhibits a complex climate profile characterised by a warming trend in high temperatures and a cooling trend in lows over the past decade. Precipitation is becoming more concentrated, suggesting a shift towards fewer, more intense rainfall events. These changes are set against the backdrop of the United States's regional climate goals, which aim to mitigate such extremes.
Subtropical Climate Dynamics
Greensboro falls under the humid subtropical climate classification, typified by hot, humid summers and mild winters. The region's geography, nestled away from significant bodies of water and shielded by nearby forests, influences its weather patterns. The all-time temperature trends reveal a slight warming in high temperatures, with an increase of 0.09°C (0.16°F), while low temperatures have marginally cooled by 0.04°C (0.07°F). This dichotomy suggests a narrowing of the diurnal temperature range over the long term.
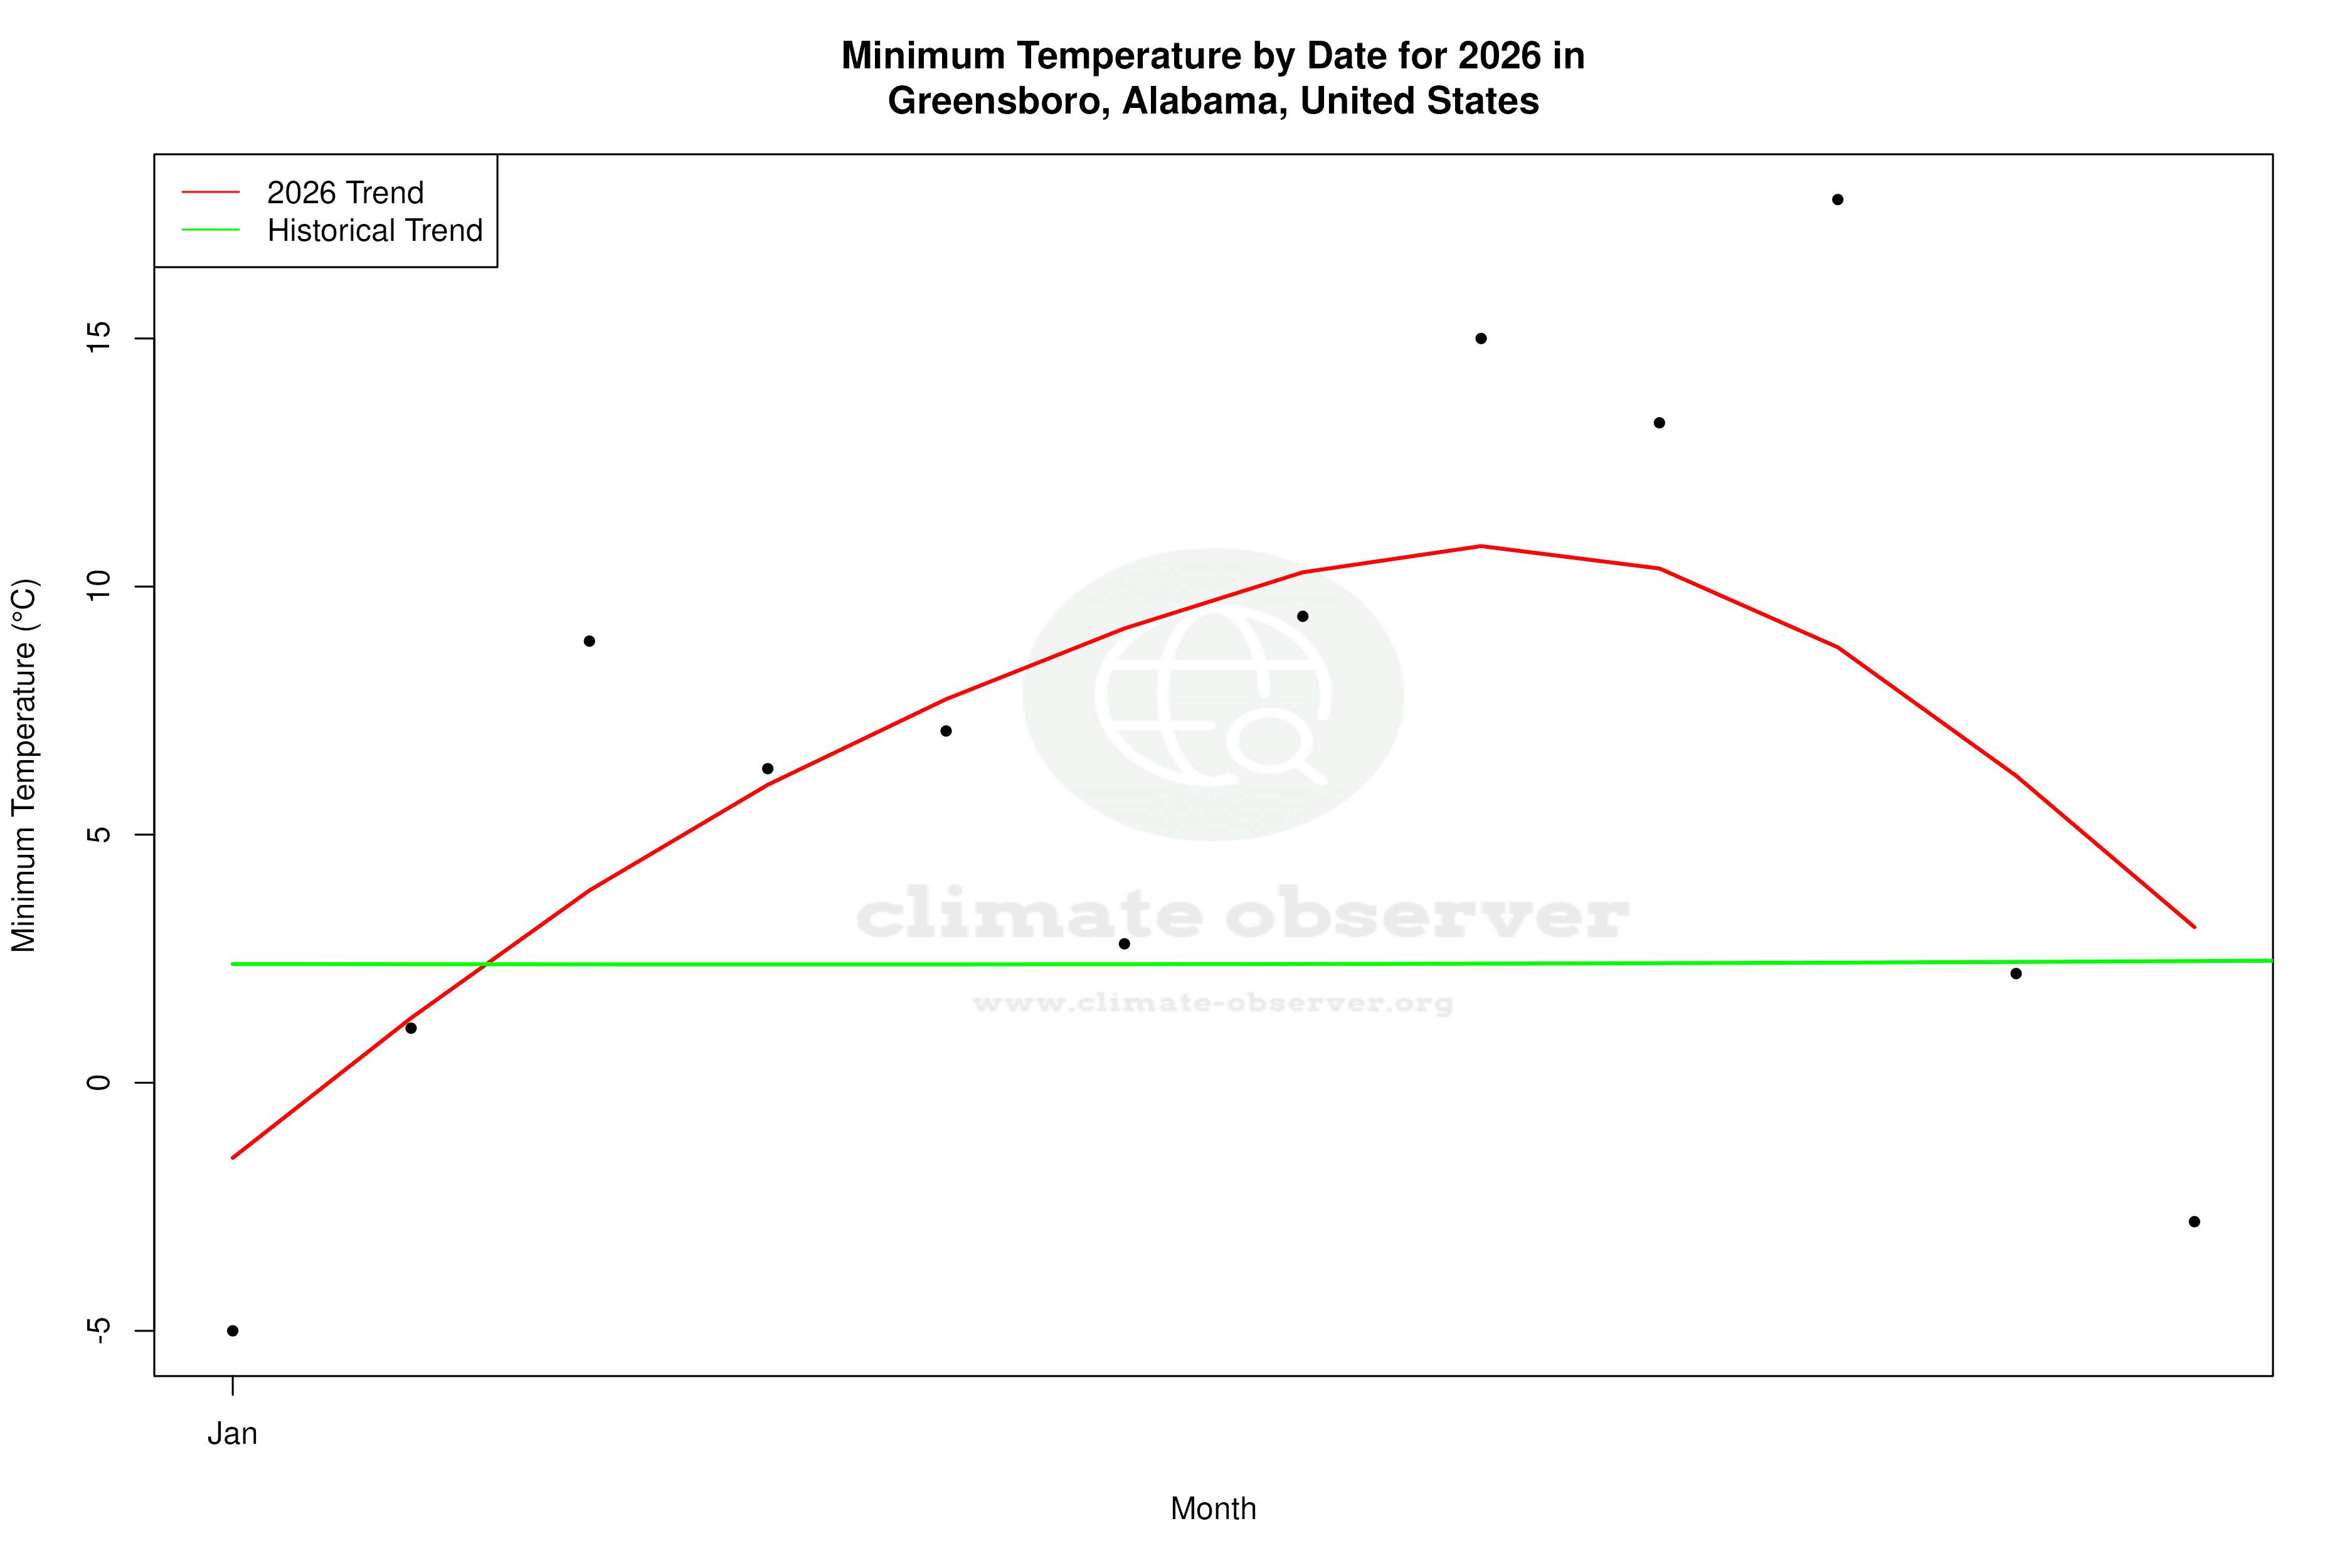
Decadal Thermal Shifts
Over the past decade, Greensboro has experienced more pronounced thermal shifts. High temperatures have risen by 1.05°C (1.89°F), indicating a significant warming trend. Conversely, low temperatures have decreased by 0.49°C (0.88°F), suggesting cooler nights. These trends may be indicative of regional climatic variability or changes in land use patterns, which can alter local microclimates.
Precipitation Patterns and PCI Insights
The Precipitation Concentration Index (PCI) provides insight into rainfall distribution. A PCI increase from a baseline of 11.3 to a current value of 13.5 indicates a shift towards more concentrated precipitation events. This suggests that Greensboro is experiencing fewer, but more intense, rainfall occurrences, potentially exacerbating flood risks and impacting agricultural practices.
Temperature Extremes and Records
Greensboro's historical temperature records highlight the potential for extreme weather events. The highest recorded temperature stands at 41.7°C (107.1°F), while the lowest plummeted to -20.6°C (-5.1°F). These extremes underscore the variability within the region's climate, which can pose challenges to infrastructure and health.
Regional Climate Context
The climate profile of Greensboro aligns with broader regional trends in the southeastern United States, where warming temperatures and altered precipitation patterns are prevalent. These shifts are significant in the context of national climate goals, which focus on reducing greenhouse gas emissions and enhancing resilience to climate impacts. As such, Greensboro's climate data not only reflects local changes but also contributes to the larger narrative of climate adaptation and mitigation efforts.
Station Statistics
10-Year Trend
High: +1.02 °C/decade
Low: -0.47 °C/decade
Rain: -0.78 mm/decade
25-Year Trend
High: +0.02 °C/decade
Low: -0.03 °C/decade
Rain: -0.04 mm/decade
50-Year Trend
High: -0.01 °C/decade
Low: +0.36 °C/decade
Rain: -0.03 mm/decade
All-Time Trend
High: +0.09 °C/decade
Low: -0.04 °C/decade
Rain: +0.02 mm/decade
Percentage Above-Average Days
Last 12 Months: 64.7%
This Year: 48.7%
Precipitation Concentration Index (PCI) ℹ️
Last 12 Months: 12.3
Historical Average: 11.6
Percentile Rank of Last 12 Months ℹ️
High: 91st percentile
Low: 63rd percentile
Rain: 24th percentile
Change in Variance ℹ️
High: -9.6%
Low: +4.1%
Intraday: -12.8%
Data Coverage
82.5%
First Year of Data
1890
Station Location
Historical Weather Records
| Max High | Avg High | Min High | Max Avg | Avg Avg | Min Avg | Max Low | Avg Low | Min Low | Max Precipitation | Avg Precipitation | Max Snow | Avg Snow | |
|---|---|---|---|---|---|---|---|---|---|---|---|---|---|
| Record | 41.7 °C | — | -10.6 °C | 33.0 °C | — | -11.1 °C | 31.1 °C | — | -20.6 °C | 241.3 mm | — | 343.0 mm | — |
| January | 28.3 °C | 13.8 °C | -10.6 °C | 23.0 °C | 6.9 °C | -10.2 °C | 21.1 °C | 2.6 °C | -18.9 °C | 114.3 mm | 4.3 mm | 254.0 mm | 0.5 mm |
| February | 30.6 °C | 15.8 °C | -10.6 °C | 22.5 °C | 9.6 °C | -10.7 °C | 20.6 °C | 3.9 °C | -20.6 °C | 131.6 mm | 4.9 mm | 152.0 mm | 0.2 mm |
| March | 32.8 °C | 20.3 °C | -0.6 °C | 24.3 °C | 13.5 °C | -3.5 °C | 21.7 °C | 7.5 °C | -12.2 °C | 185.4 mm | 5.1 mm | 254.0 mm | 0.1 mm |
| April | 36.1 °C | 24.6 °C | 7.2 °C | 25.2 °C | 17.5 °C | 3.9 °C | 23.3 °C | 11.5 °C | -2.2 °C | 209.6 mm | 4.1 mm | 76.0 mm | 0.0 mm |
| May | 36.7 °C | 28.5 °C | 13.3 °C | 28.4 °C | 22.1 °C | 10.5 °C | 26.1 °C | 16.1 °C | 2.8 °C | 241.3 mm | 3.7 mm | 0.0 mm | 0.0 mm |
| June | 40.6 °C | 32.1 °C | 18.3 °C | 32.0 °C | 26.0 °C | 18.4 °C | 27.2 °C | 20.3 °C | 7.8 °C | 139.7 mm | 3.4 mm | 20.0 mm | 0.0 mm |
| July | 41.7 °C | 33.0 °C | 21.7 °C | 33.0 °C | 27.5 °C | 21.1 °C | 27.8 °C | 21.8 °C | 13.3 °C | 157.7 mm | 4.3 mm | 0.0 mm | 0.0 mm |
| August | 41.7 °C | 32.9 °C | 20.6 °C | 33.0 °C | 27.2 °C | 19.1 °C | 27.2 °C | 21.5 °C | 12.8 °C | 114.3 mm | 3.5 mm | 0.0 mm | 0.0 mm |
| September | 41.1 °C | 30.7 °C | 15.6 °C | 29.9 °C | 24.1 °C | 13.0 °C | 31.1 °C | 18.7 °C | 3.9 °C | 127.0 mm | 2.9 mm | 0.0 mm | 0.0 mm |
| October | 37.8 °C | 25.5 °C | 7.2 °C | 30.0 °C | 18.2 °C | 2.8 °C | 26.1 °C | 12.3 °C | -2.8 °C | 131.6 mm | 2.2 mm | 343.0 mm | 0.4 mm |
| November | 36.7 °C | 19.4 °C | -2.8 °C | 24.1 °C | 12.4 °C | -0.9 °C | 22.8 °C | 6.7 °C | -11.1 °C | 115.6 mm | 3.2 mm | 5.0 mm | 0.0 mm |
| December | 27.8 °C | 14.7 °C | -7.2 °C | 22.2 °C | 8.5 °C | -11.1 °C | 20.6 °C | 3.5 °C | -16.7 °C | 155.4 mm | 4.4 mm | 152.0 mm | 0.2 mm |
Data Visualisations
Remove WatermarksCurrent Year Climate Trends vs Historical


Max Temperature this Year | 1 of 6
Climate 12-Month Moving Averages


Max Temperature 12-Month MA | 1 of 6
Daily Data Points and Averages Throughout the Year


Average Max Temperature Throughout Year | 1 of 5
