Climate for Station: Pocahontas 1, Arkansas, United States
Loading live weather...
Climate Analysis & Overview
Pocahontas, Arkansas, exhibits a complex climate narrative with a cooling trend in high temperatures contrasting a warming trend in low temperatures over the past decade. Precipitation patterns have shifted toward more concentrated events, reflecting broader regional climate challenges.
Climate Classification and Geographic Influence
Pocahontas, located at 36.2642°N, 90.9683°W, falls under the Köppen climate classification of Cfa, indicating a humid subtropical climate. This classification is characterised by hot, humid summers and mild to cool winters. The proximity to the Mississippi River and the Ozark Mountains influences local weather patterns, often bringing moisture-laden air and contributing to the area's precipitation dynamics.
Temperature Trends: Cooling Highs and Warming Lows
Over the past decade, Pocahontas has experienced a cooling trend in high temperatures, with a decrease of 0.09°C (0.16°F). This contrasts with the all-time trend, which shows a slightly larger cooling of 0.11°C (0.20°F). Meanwhile, the low temperatures have shown a significant warming trend, increasing by 1.28°C (2.30°F) over the last ten years, compared to a marginal rise of 0.01°C (0.02°F) in the all-time data. This divergence suggests a shift in the diurnal temperature range, possibly affecting local ecosystems and agriculture.
Record Extremes: A Tale of Temperature Extremes
Pocahontas has recorded extreme temperatures, with a maximum of 44.4°C (111.9°F) and a minimum of -30.0°C (-22.0°F). These records highlight the potential for severe weather events, which are critical considerations for local infrastructure and emergency planning. The extreme variability is emblematic of the challenges faced by regions with a humid subtropical climate, where both heatwaves and cold snaps can occur.
Precipitation Patterns: Increasing Concentration
The Precipitation Concentration Index (PCI) for Pocahontas has increased from a baseline of 11.4 to 14.8, indicating a shift towards more concentrated precipitation events. This suggests that rainfall is occurring in fewer, more intense events rather than being evenly distributed throughout the year. Such changes can lead to increased risks of flooding and soil erosion, posing challenges for water management and agricultural practices.
Regional Climate Context and Considerations
The trends observed in Pocahontas are reflective of broader climatic shifts in the southeastern United States, where regional climate goals aim to mitigate the impacts of warming temperatures and changing precipitation patterns. Recent weather events, such as increased frequency of intense storms, underscore the importance of adaptive strategies to manage these evolving climate dynamics. As the area continues to navigate these changes, understanding the local climate profile becomes increasingly vital for informed decision-making.
Station Statistics
10-Year Trend
High: +0.20 °C/decade
Low: +1.52 °C/decade
Rain: -0.00 mm/decade
25-Year Trend
High: +0.45 °C/decade
Low: +0.46 °C/decade
Rain: +0.15 mm/decade
50-Year Trend
High: -0.04 °C/decade
Low: +0.07 °C/decade
Rain: +0.05 mm/decade
All-Time Trend
High: -0.11 °C/decade
Low: +0.01 °C/decade
Rain: -0.01 mm/decade
Percentage Above-Average Days
Last 12 Months: 60.8%
This Year: 48.4%
Precipitation Concentration Index (PCI) ℹ️
Last 12 Months: 11.4
Historical Average: 10.8
Percentile Rank of Last 12 Months ℹ️
High: 68th percentile
Low: 98th percentile
Rain: 52nd percentile
Change in Variance ℹ️
High: -2.3%
Low: -0.6%
Intraday: -14.3%
Data Coverage
82.9%
First Year of Data
1871
Station Location
Historical Weather Records
| Max High | Avg High | Min High | Max Avg | Avg Avg | Min Avg | Max Low | Avg Low | Min Low | Max Precipitation | Avg Precipitation | Max Snow | Avg Snow | |
|---|---|---|---|---|---|---|---|---|---|---|---|---|---|
| Record | 44.4 °C | — | -14.4 °C | 32.8 °C | — | -18.9 °C | 32.8 °C | — | -30.0 °C | 184.2 mm | — | 279.0 mm | — |
| January | 25.6 °C | 8.5 °C | -14.4 °C | 18.4 °C | 1.7 °C | -18.9 °C | 18.3 °C | -2.8 °C | -28.9 °C | 177.8 mm | 3.3 mm | 254.0 mm | 2.3 mm |
| February | 29.4 °C | 10.9 °C | -12.2 °C | 21.1 °C | 4.2 °C | -14.5 °C | 17.2 °C | -1.2 °C | -30.0 °C | 96.5 mm | 3.2 mm | 279.0 mm | 2.3 mm |
| March | 33.9 °C | 16.6 °C | -2.2 °C | 22.6 °C | 9.6 °C | -8.2 °C | 20.0 °C | 3.7 °C | -17.8 °C | 184.2 mm | 3.9 mm | 229.0 mm | 0.8 mm |
| April | 36.7 °C | 22.3 °C | 1.1 °C | 25.2 °C | 14.9 °C | 1.6 °C | 22.2 °C | 8.8 °C | -12.2 °C | 118.7 mm | 4.2 mm | 13.0 mm | 0.0 mm |
| May | 39.4 °C | 26.7 °C | 5.0 °C | 28.9 °C | 19.9 °C | 6.0 °C | 25.6 °C | 13.6 °C | -0.6 °C | 116.1 mm | 4.1 mm | 0.0 mm | 0.0 mm |
| June | 42.8 °C | 31.2 °C | 17.8 °C | 31.3 °C | 24.6 °C | 16.2 °C | 32.2 °C | 18.4 °C | 5.0 °C | 135.4 mm | 3.2 mm | 0.0 mm | 0.0 mm |
| July | 43.9 °C | 33.1 °C | 20.0 °C | 32.4 °C | 26.6 °C | 18.4 °C | 29.4 °C | 20.5 °C | 8.9 °C | 124.5 mm | 3.1 mm | 0.0 mm | 0.0 mm |
| August | 44.4 °C | 32.6 °C | 19.4 °C | 32.8 °C | 25.8 °C | 15.7 °C | 32.8 °C | 19.7 °C | 8.3 °C | 124.5 mm | 3.1 mm | 0.0 mm | 0.0 mm |
| September | 41.7 °C | 29.2 °C | 11.7 °C | 30.5 °C | 21.8 °C | 8.9 °C | 32.2 °C | 15.7 °C | 1.7 °C | 111.3 mm | 3.0 mm | 0.0 mm | 0.0 mm |
| October | 35.6 °C | 23.4 °C | 2.8 °C | 26.8 °C | 15.3 °C | -0.1 °C | 26.7 °C | 8.9 °C | -6.7 °C | 78.7 mm | 2.8 mm | 38.0 mm | 0.0 mm |
| November | 31.1 °C | 16.0 °C | -2.8 °C | 22.8 °C | 8.7 °C | -5.6 °C | 21.1 °C | 3.0 °C | -15.0 °C | 114.3 mm | 3.5 mm | 173.0 mm | 0.3 mm |
| December | 27.8 °C | 9.9 °C | -13.9 °C | 20.5 °C | 3.6 °C | -18.6 °C | 20.0 °C | -1.2 °C | -23.9 °C | 121.9 mm | 3.2 mm | 254.0 mm | 1.2 mm |
Data Visualisations
Remove WatermarksCurrent Year Climate Trends vs Historical


Max Temperature this Year | 1 of 6
Climate 12-Month Moving Averages


Max Temperature 12-Month MA | 1 of 6
Daily Data Points and Averages Throughout the Year


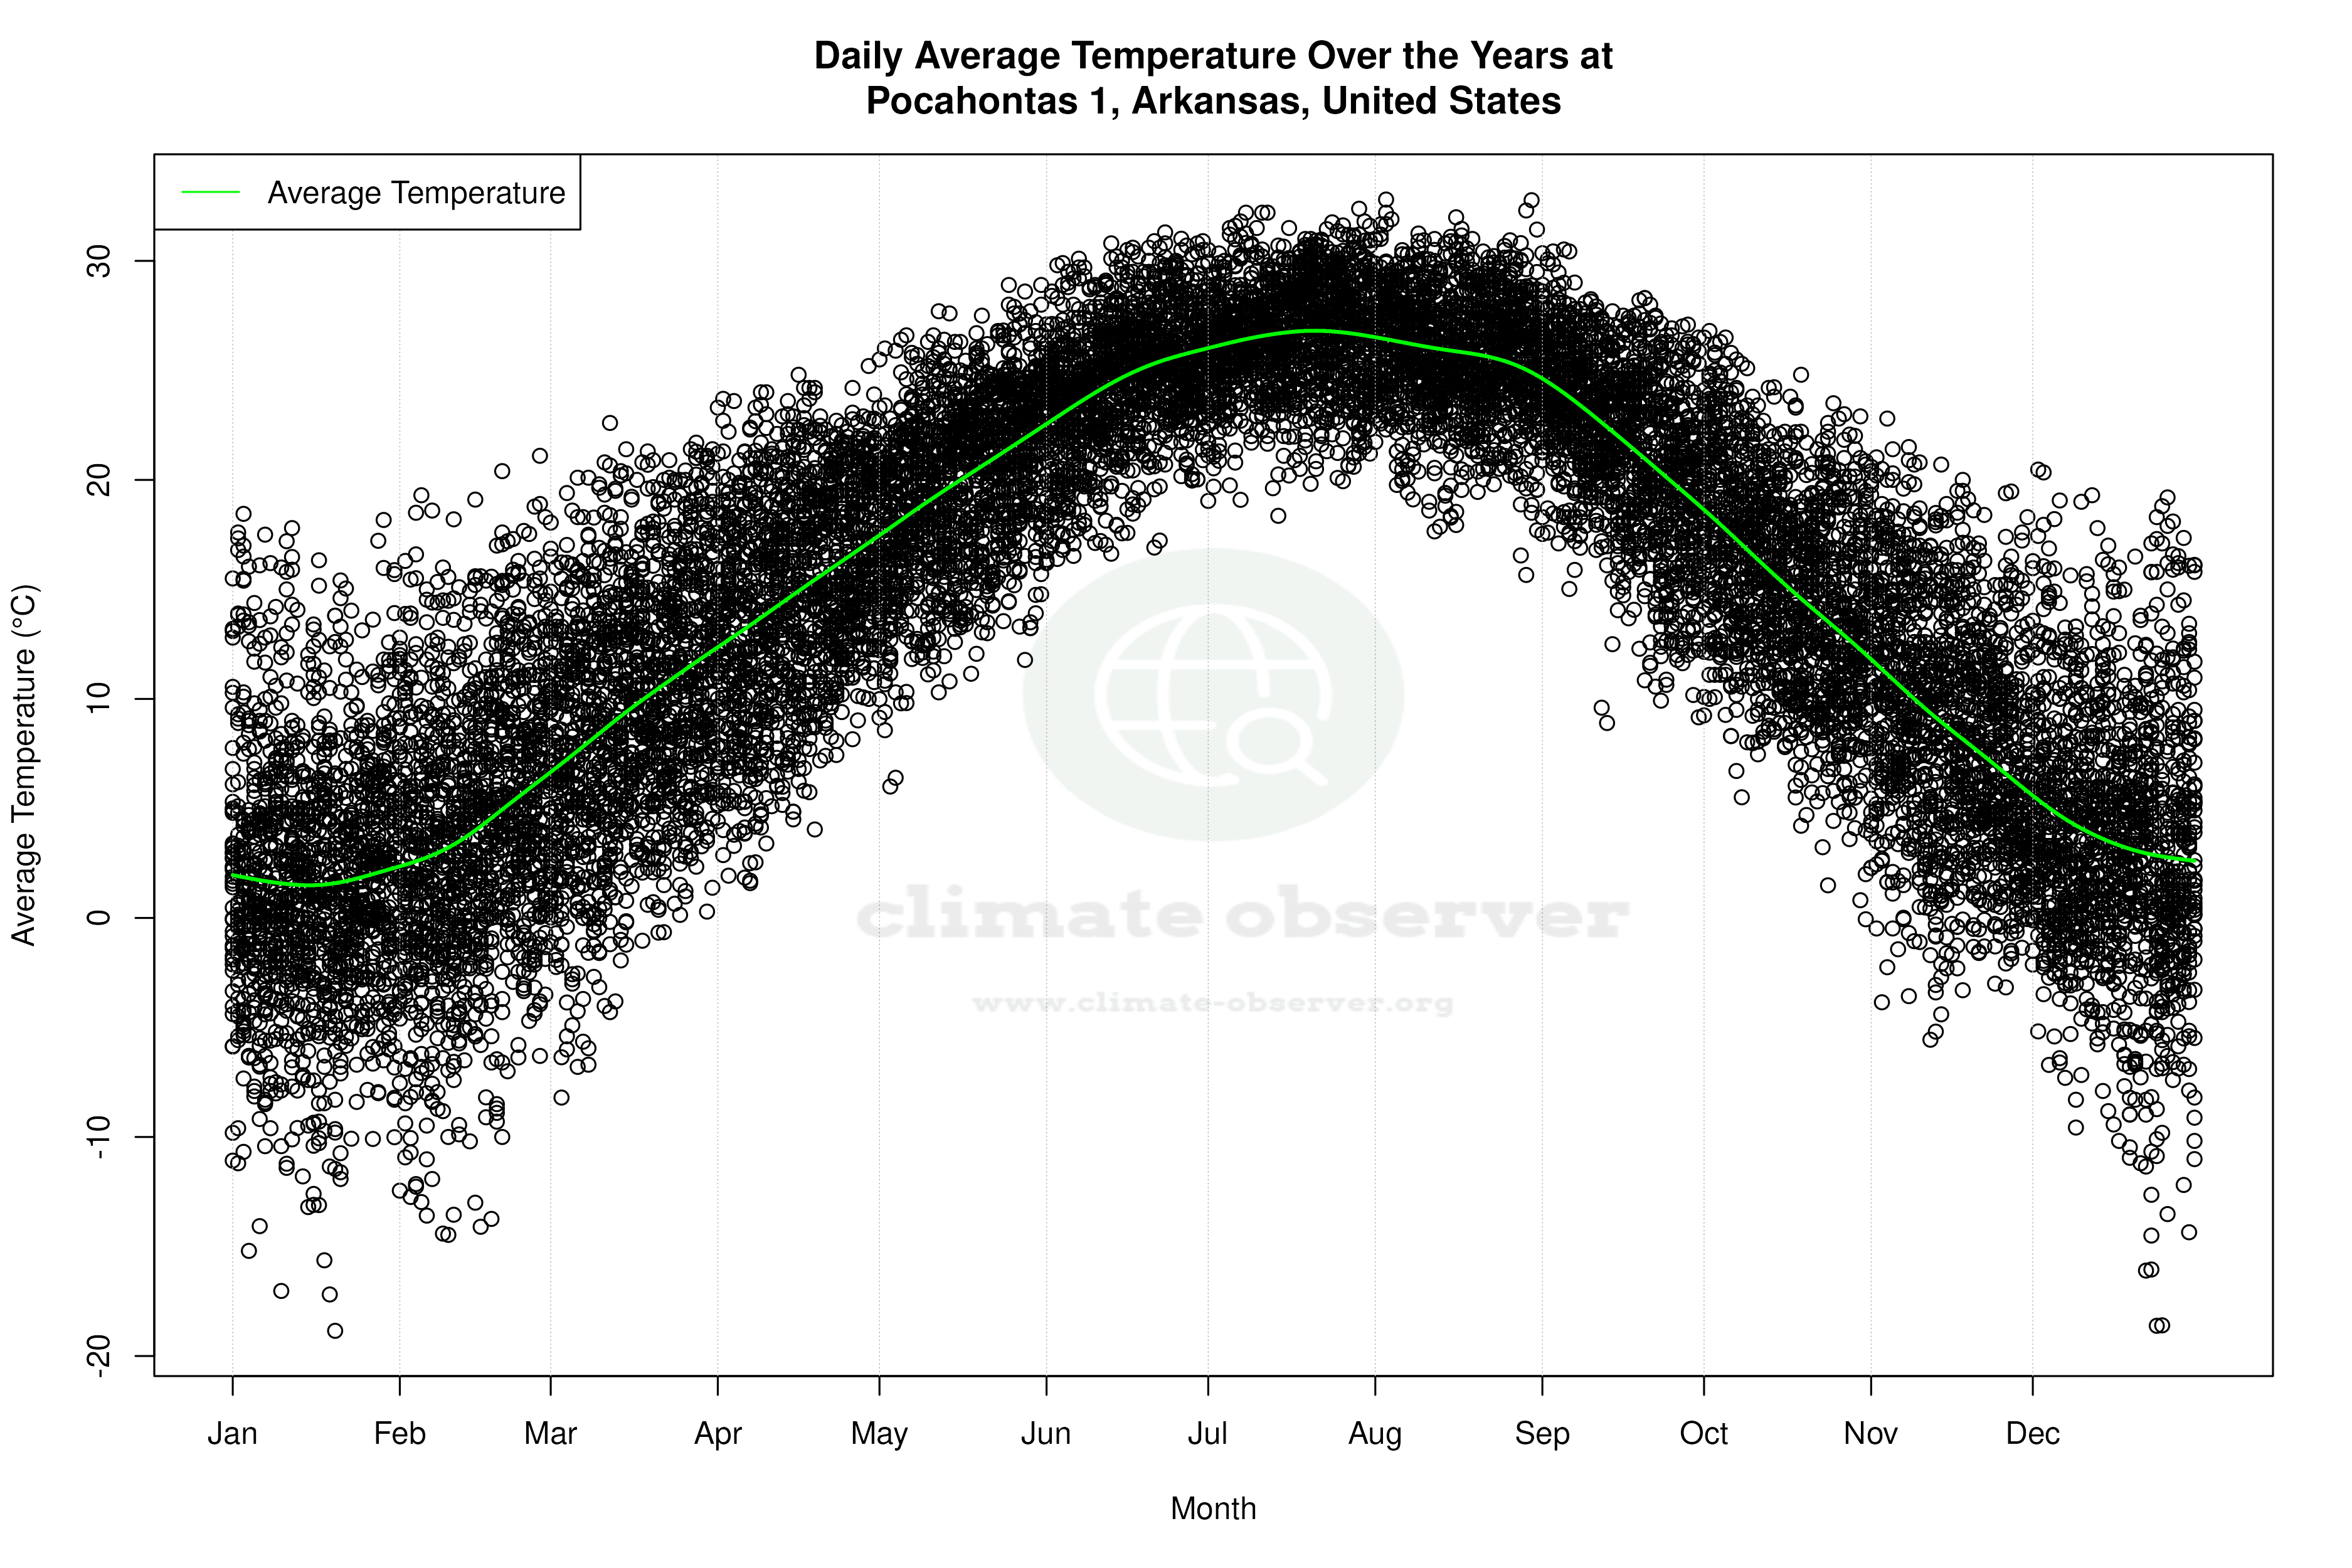


Average Max Temperature Throughout Year | 1 of 5
