Climate for Station: Searcy, Arkansas, United States
Loading live weather...
Climate Analysis & Overview
Searcy, Arkansas, is experiencing a nuanced climate evolution, with a slight cooling trend in all-time high temperatures and a warming in low temperatures. The precipitation pattern has become more concentrated, indicating fewer but more intense rainfall events. This profile highlights the delicate balance of climatic forces at play.
Climate Classification and Geographic Influence
Searcy, located in White County, Arkansas, falls under the humid subtropical climate classification (Cfa) according to the Köppen system. This classification is characterised by hot, humid summers and mild to cool winters. The region's climate is influenced by its position in the central United States, away from significant mountain ranges or coastlines, which allows for the unimpeded movement of air masses. This geographic setting contributes to the variability in temperature and precipitation patterns observed in the area.
Temperature Trends: A Complex Picture
Over the past decade, Searcy has experienced a mixed temperature trend. The 10-year trend for high temperatures shows a warming of 0.09°C (0.16°F), while low temperatures have cooled by 0.49°C (0.88°F). However, when considering the all-time data, there is a slight cooling in high temperatures with a fall of 0.06°C (0.11°F), and a warming trend in low temperatures with a rise of 0.08°C (0.14°F). These trends suggest a complex interplay of factors affecting the region's thermal dynamics, possibly influenced by broader climatic shifts across the United States.
Precipitation Patterns: Increasing Concentration
The Precipitation Concentration Index (PCI) for Searcy has increased from a baseline of 11.42 to a current value of 13.24. This indicates a shift towards more concentrated precipitation events, where rainfall is occurring in fewer but more intense episodes. Such changes can have significant implications for water management and agriculture in the region, necessitating adaptive strategies to cope with potential flooding or drought conditions.
Temperature Extremes: A Record of Extremes
Searcy's climate history is marked by significant temperature extremes. The record high temperature stands at 46.1°C (115.0°F), while the record low plummeted to -28.9°C (-20.0°F). These extremes highlight the potential for severe weather events, which are becoming increasingly relevant in the context of global climate change discussions. The variability in temperature extremes underscores the need for robust infrastructure and community preparedness to mitigate the impacts of such events.
Regional Climate Goals and Implications
In the context of the United States' regional climate goals, which aim to reduce carbon emissions and enhance resilience to climate impacts, Searcy's climate profile provides valuable insights. The observed trends in temperature and precipitation highlight areas where local adaptation efforts could align with broader national objectives. By understanding these patterns, policymakers and community leaders can better strategise to meet both local needs and contribute to national climate resilience goals.
Station Statistics
10-Year Trend
High: +0.32 °C/decade
Low: -0.28 °C/decade
Rain: +0.30 mm/decade
25-Year Trend
High: +0.20 °C/decade
Low: +0.95 °C/decade
Rain: +0.19 mm/decade
50-Year Trend
High: -0.12 °C/decade
Low: +0.28 °C/decade
Rain: +0.02 mm/decade
All-Time Trend
High: -0.06 °C/decade
Low: +0.08 °C/decade
Rain: -0.01 mm/decade
Percentage Above-Average Days
Last 12 Months: 58.9%
This Year: 44.1%
Precipitation Concentration Index (PCI) ℹ️
Last 12 Months: 10.2
Historical Average: 10.7
Percentile Rank of Last 12 Months ℹ️
High: 65th percentile
Low: 97th percentile
Rain: 53rd percentile
Change in Variance ℹ️
High: -0.4%
Low: +2.8%
Intraday: -25.7%
Data Coverage
84.7%
First Year of Data
1892
Station Location
Historical Weather Records
| Max High | Avg High | Min High | Max Avg | Avg Avg | Min Avg | Max Low | Avg Low | Min Low | Max Precipitation | Avg Precipitation | Max Snow | Avg Snow | |
|---|---|---|---|---|---|---|---|---|---|---|---|---|---|
| Record | 46.1 °C | — | -13.3 °C | 34.2 °C | — | -17.4 °C | 32.8 °C | — | -28.9 °C | 151.4 mm | — | 279.0 mm | — |
| January | 30.6 °C | 10.1 °C | -13.3 °C | 18.9 °C | 2.9 °C | -15.7 °C | 20.0 °C | -1.4 °C | -28.9 °C | 151.4 mm | 3.5 mm | 279.0 mm | 1.3 mm |
| February | 30.0 °C | 12.8 °C | -8.9 °C | 21.8 °C | 5.6 °C | -12.9 °C | 18.3 °C | 0.5 °C | -23.3 °C | 113.5 mm | 3.5 mm | 241.0 mm | 1.3 mm |
| March | 32.8 °C | 17.8 °C | -3.3 °C | 22.8 °C | 10.7 °C | -8.2 °C | 27.8 °C | 4.8 °C | -12.8 °C | 109.2 mm | 4.2 mm | 152.0 mm | 0.3 mm |
| April | 36.1 °C | 23.3 °C | 7.2 °C | 25.8 °C | 15.6 °C | 0.9 °C | 25.0 °C | 9.8 °C | -6.7 °C | 127.7 mm | 4.2 mm | 0.0 mm | 0.0 mm |
| May | 37.2 °C | 27.4 °C | 10.0 °C | 27.9 °C | 20.4 °C | 5.9 °C | 25.6 °C | 14.7 °C | 1.1 °C | 139.2 mm | 4.4 mm | 0.0 mm | 0.0 mm |
| June | 42.8 °C | 31.9 °C | 20.0 °C | 31.9 °C | 24.9 °C | 16.8 °C | 27.2 °C | 19.3 °C | 6.7 °C | 111.8 mm | 3.2 mm | 0.0 mm | 0.0 mm |
| July | 44.4 °C | 34.0 °C | 21.1 °C | 33.9 °C | 27.0 °C | 19.3 °C | 28.9 °C | 21.2 °C | 10.6 °C | 110.0 mm | 2.8 mm | 0.0 mm | 0.0 mm |
| August | 46.1 °C | 33.6 °C | 18.9 °C | 34.2 °C | 26.6 °C | 16.7 °C | 32.8 °C | 20.4 °C | 7.8 °C | 135.4 mm | 2.9 mm | 0.0 mm | 0.0 mm |
| September | 43.9 °C | 30.0 °C | 15.6 °C | 32.0 °C | 22.7 °C | 10.3 °C | 27.8 °C | 16.6 °C | -0.6 °C | 138.9 mm | 2.9 mm | 0.0 mm | 0.0 mm |
| October | 37.8 °C | 24.2 °C | 2.2 °C | 26.7 °C | 16.2 °C | 0.7 °C | 23.3 °C | 9.7 °C | -5.6 °C | 100.3 mm | 2.9 mm | 0.0 mm | 0.0 mm |
| November | 30.6 °C | 16.9 °C | -0.6 °C | 23.9 °C | 9.7 °C | -4.2 °C | 20.0 °C | 4.0 °C | -11.7 °C | 133.4 mm | 3.8 mm | 102.0 mm | 0.1 mm |
| December | 27.2 °C | 11.5 °C | -10.0 °C | 20.7 °C | 4.6 °C | -17.4 °C | 22.2 °C | 0.2 °C | -28.3 °C | 148.8 mm | 3.7 mm | 229.0 mm | 0.5 mm |
Data Visualisations
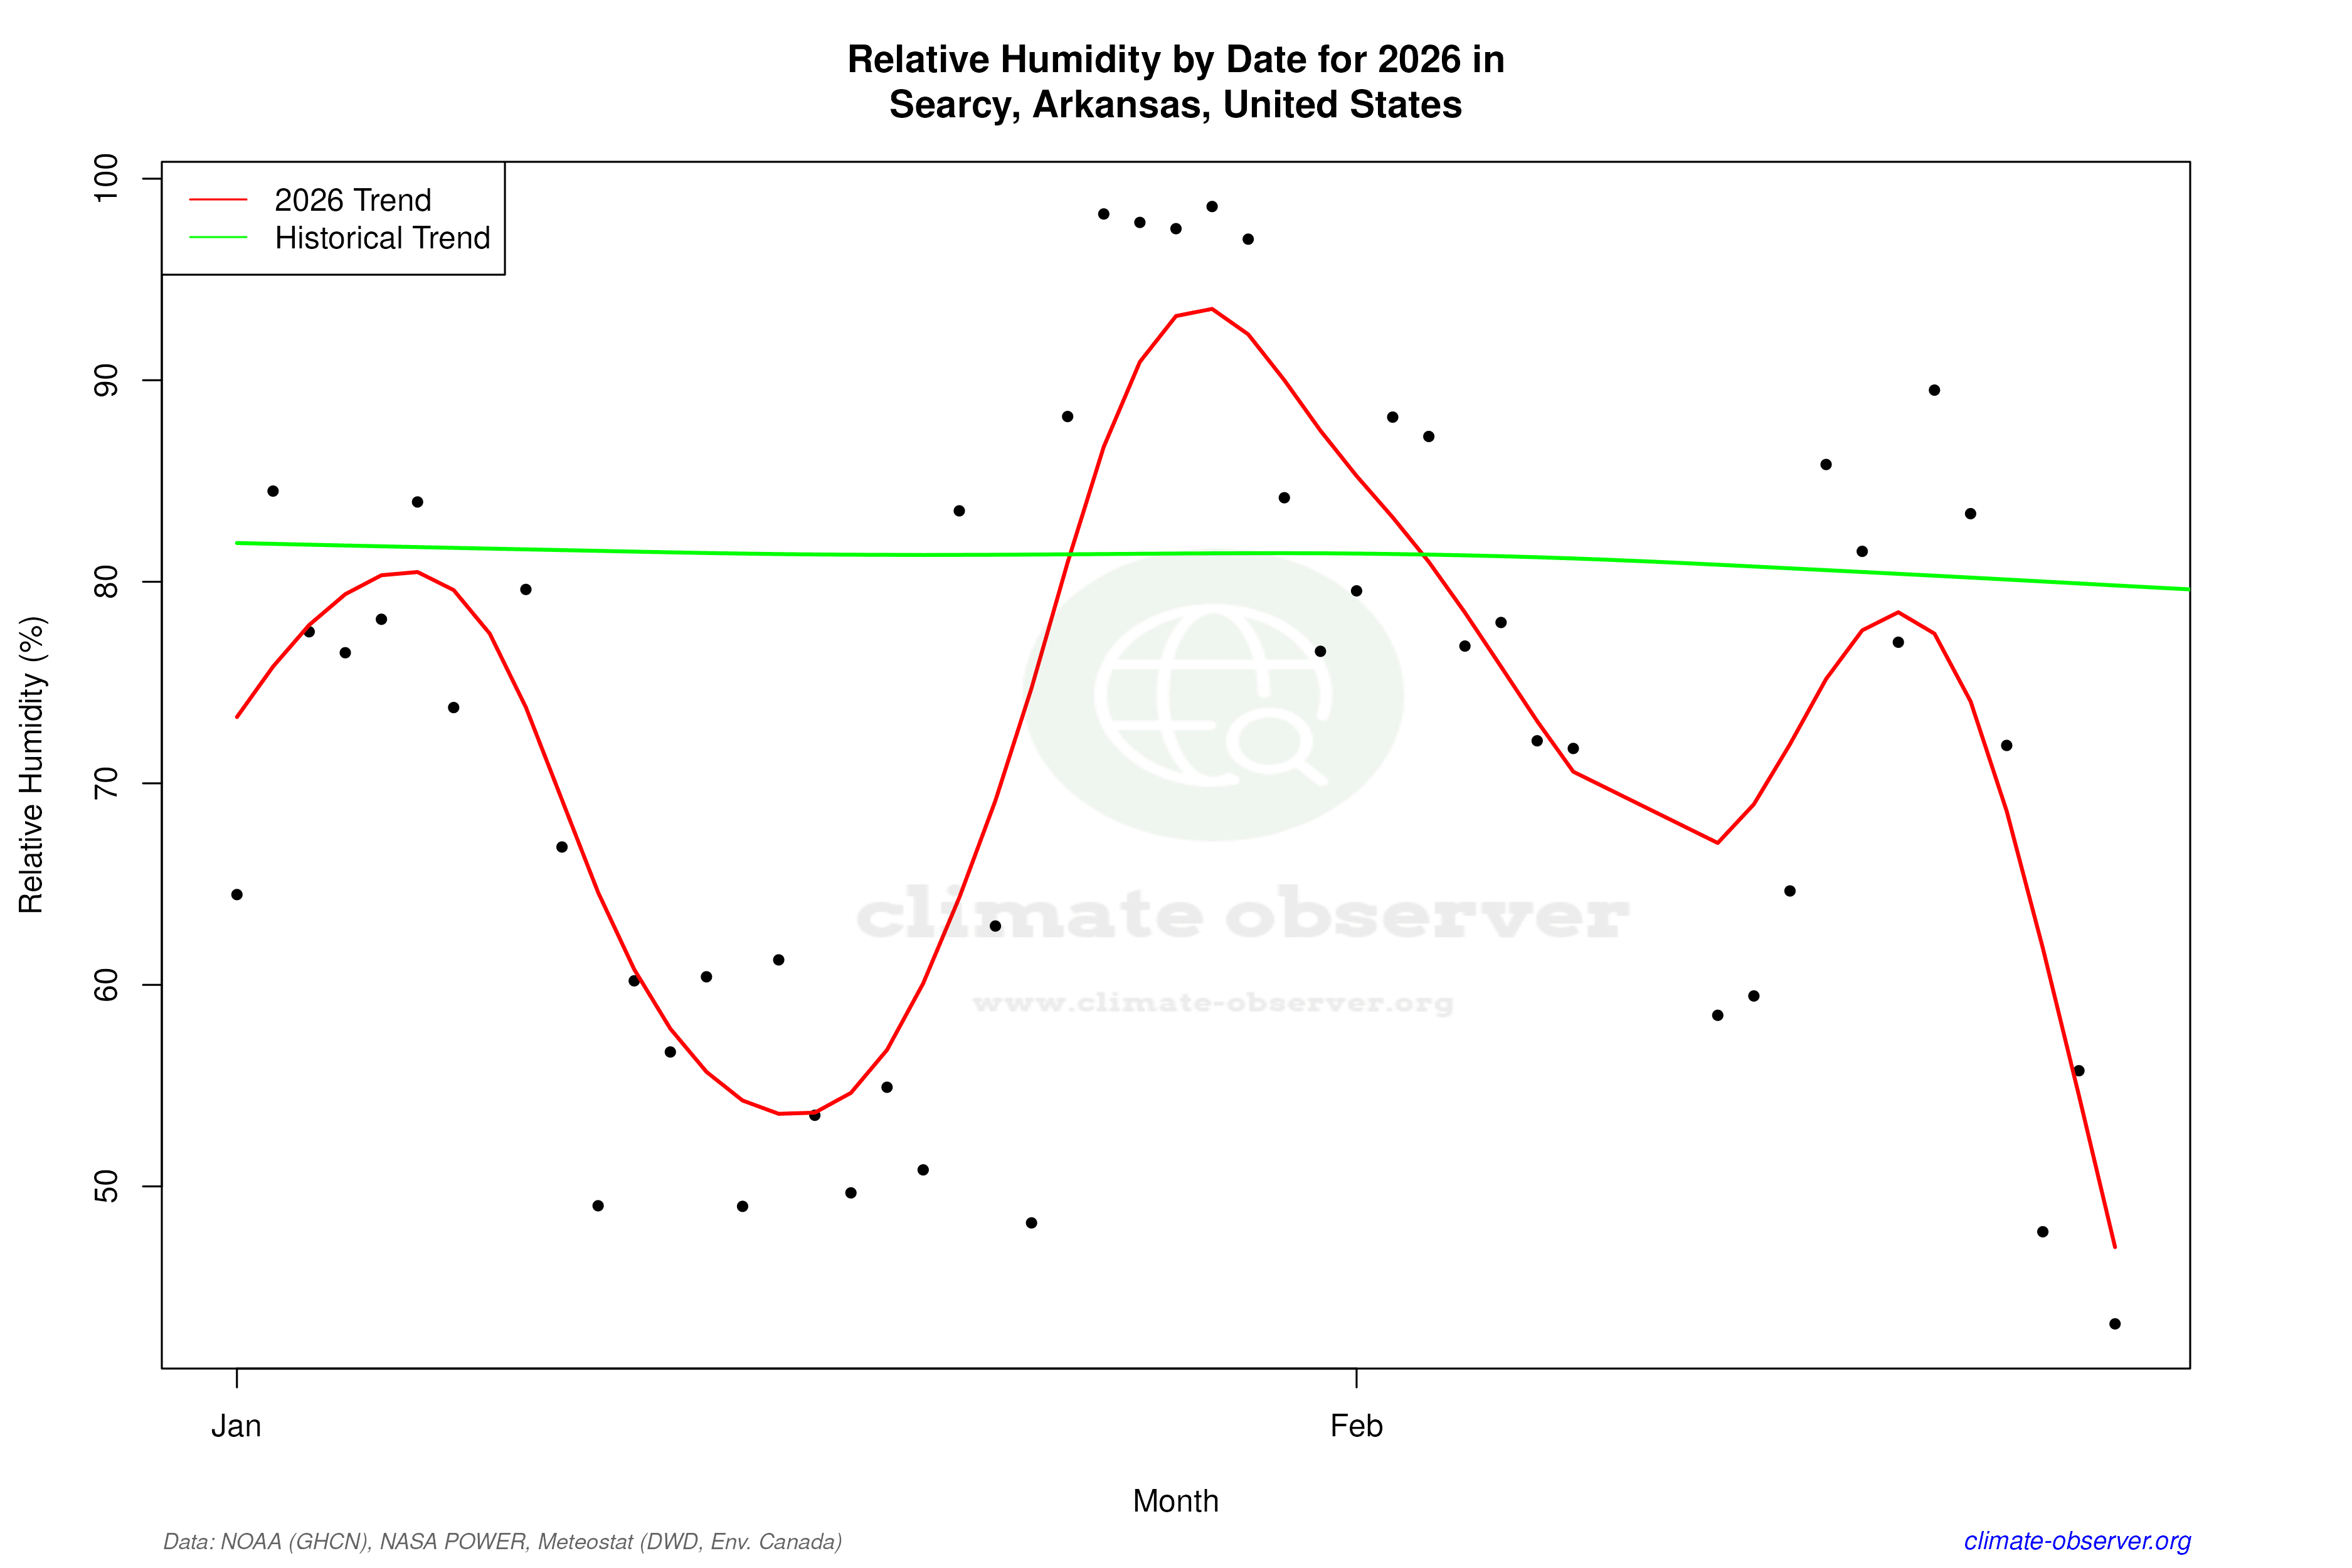
Remove WatermarksCurrent Year Climate Trends vs Historical


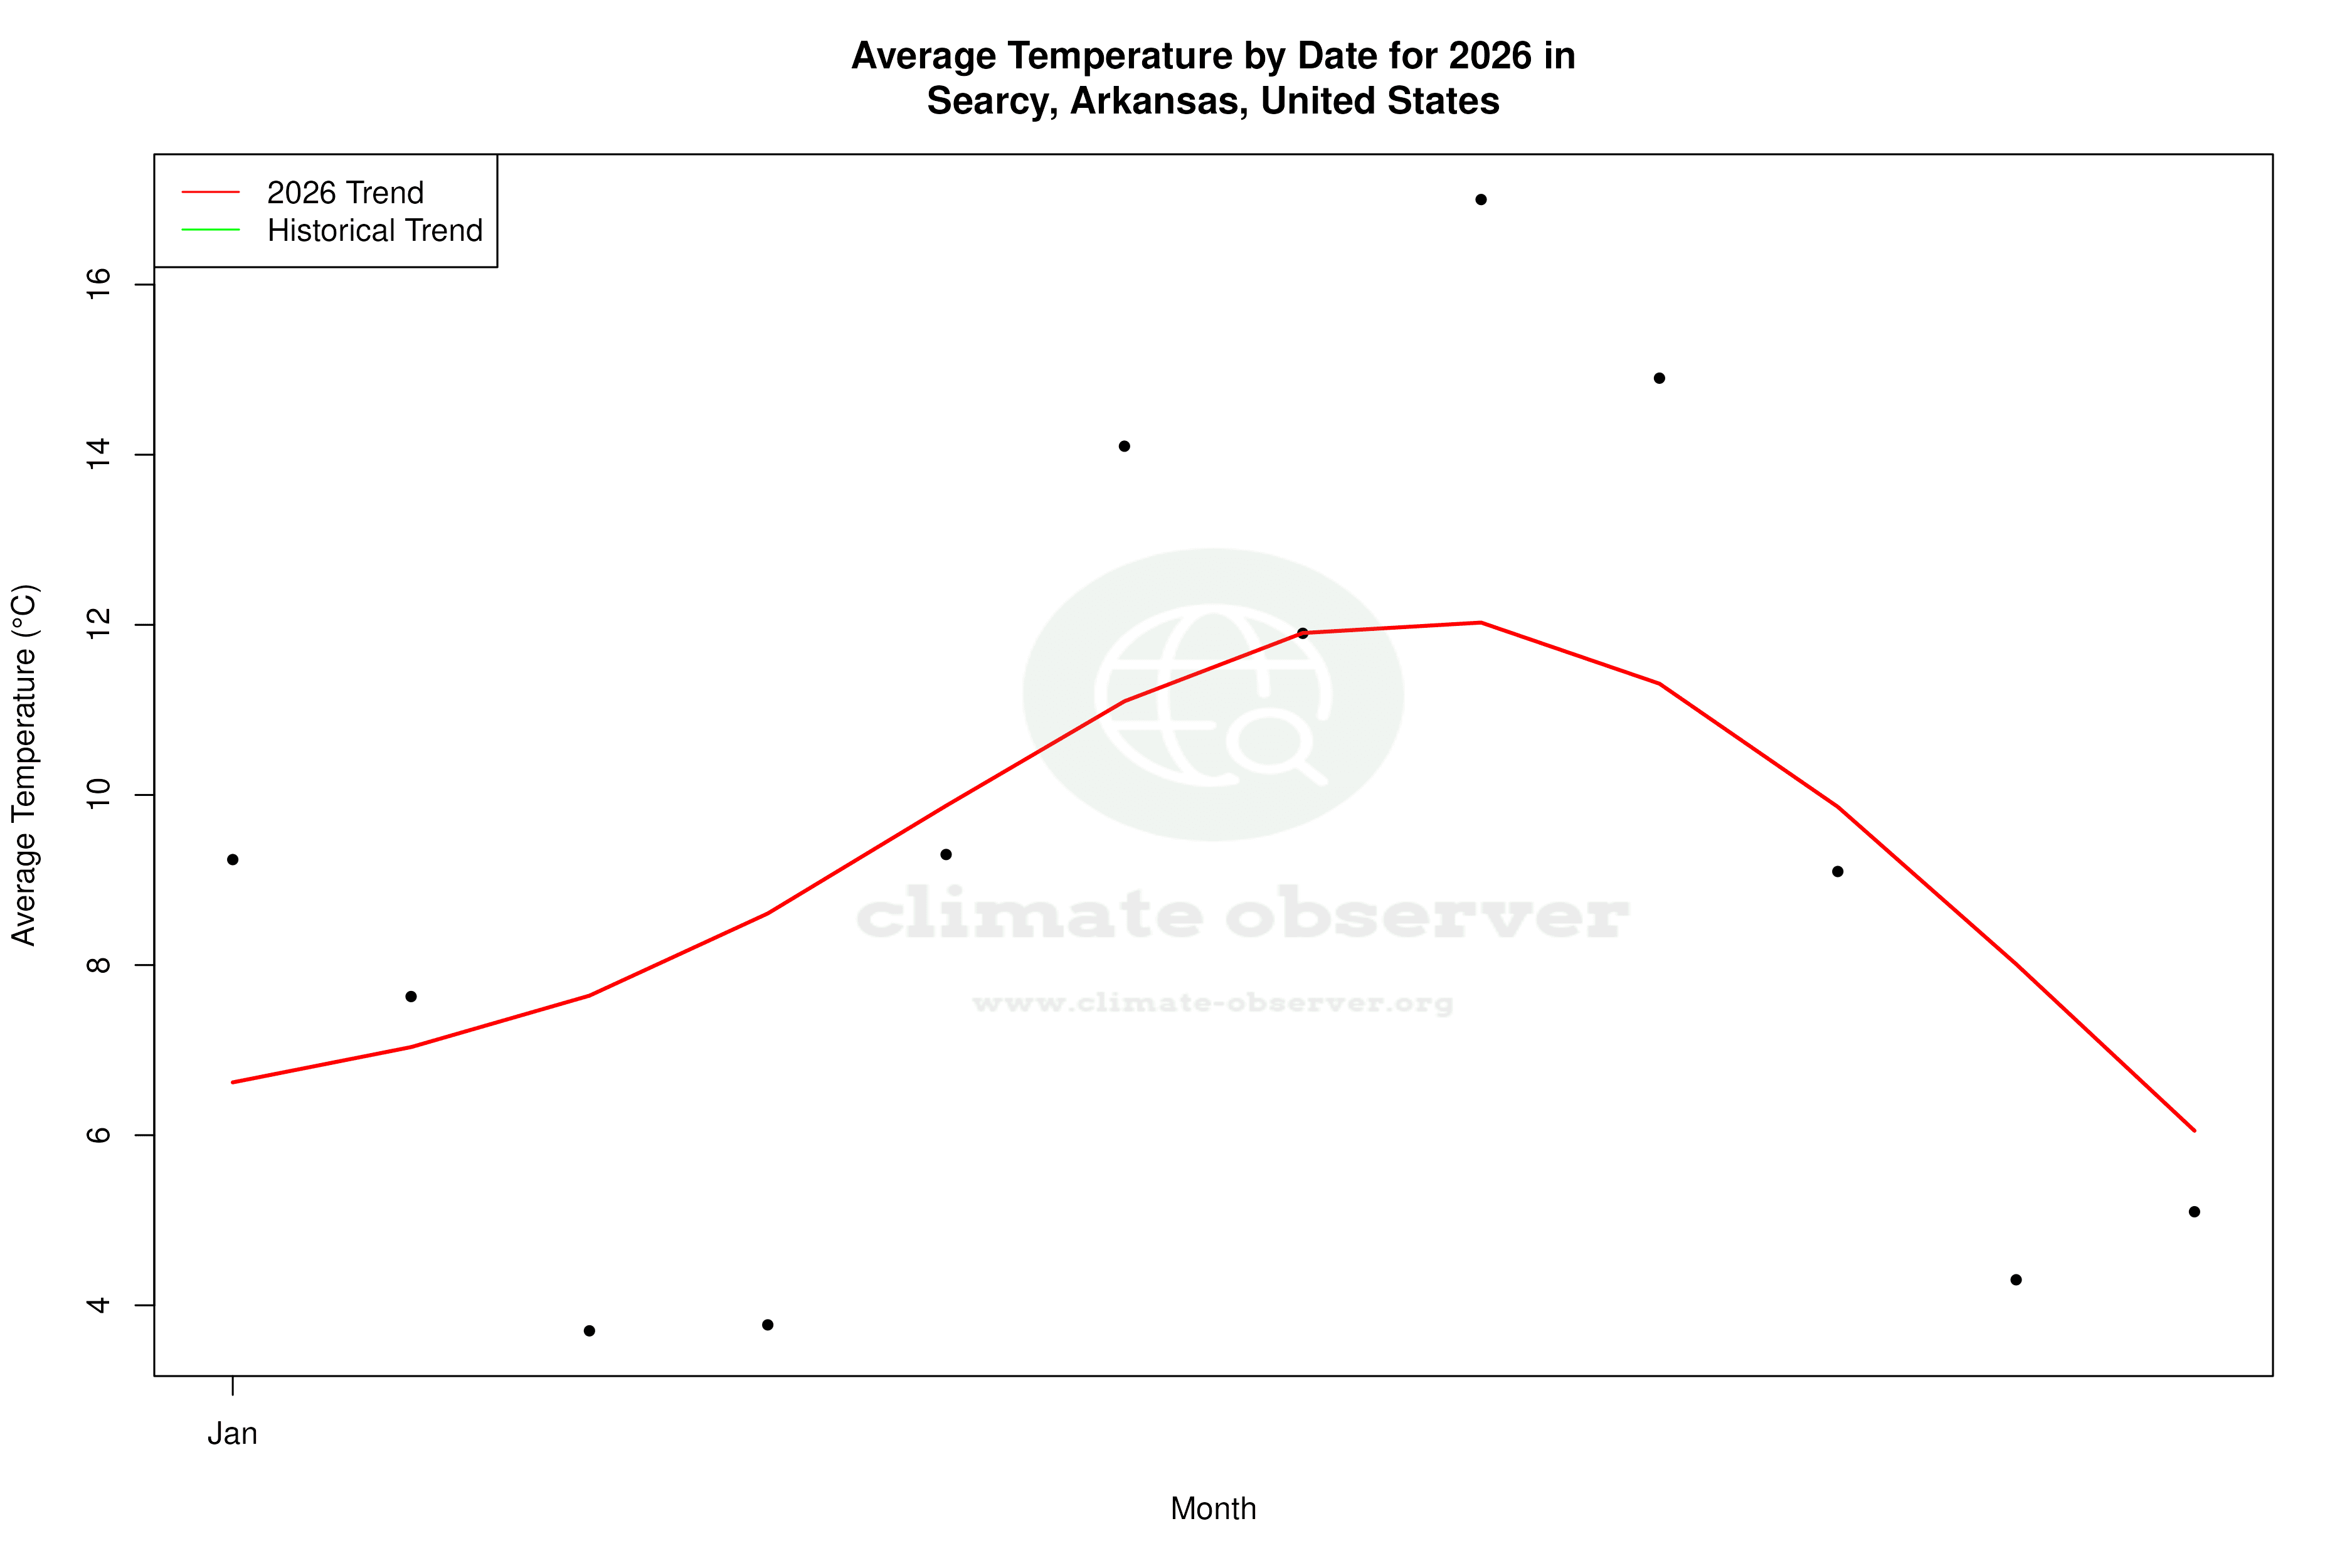


Max Temperature this Year | 1 of 6
Climate 12-Month Moving Averages


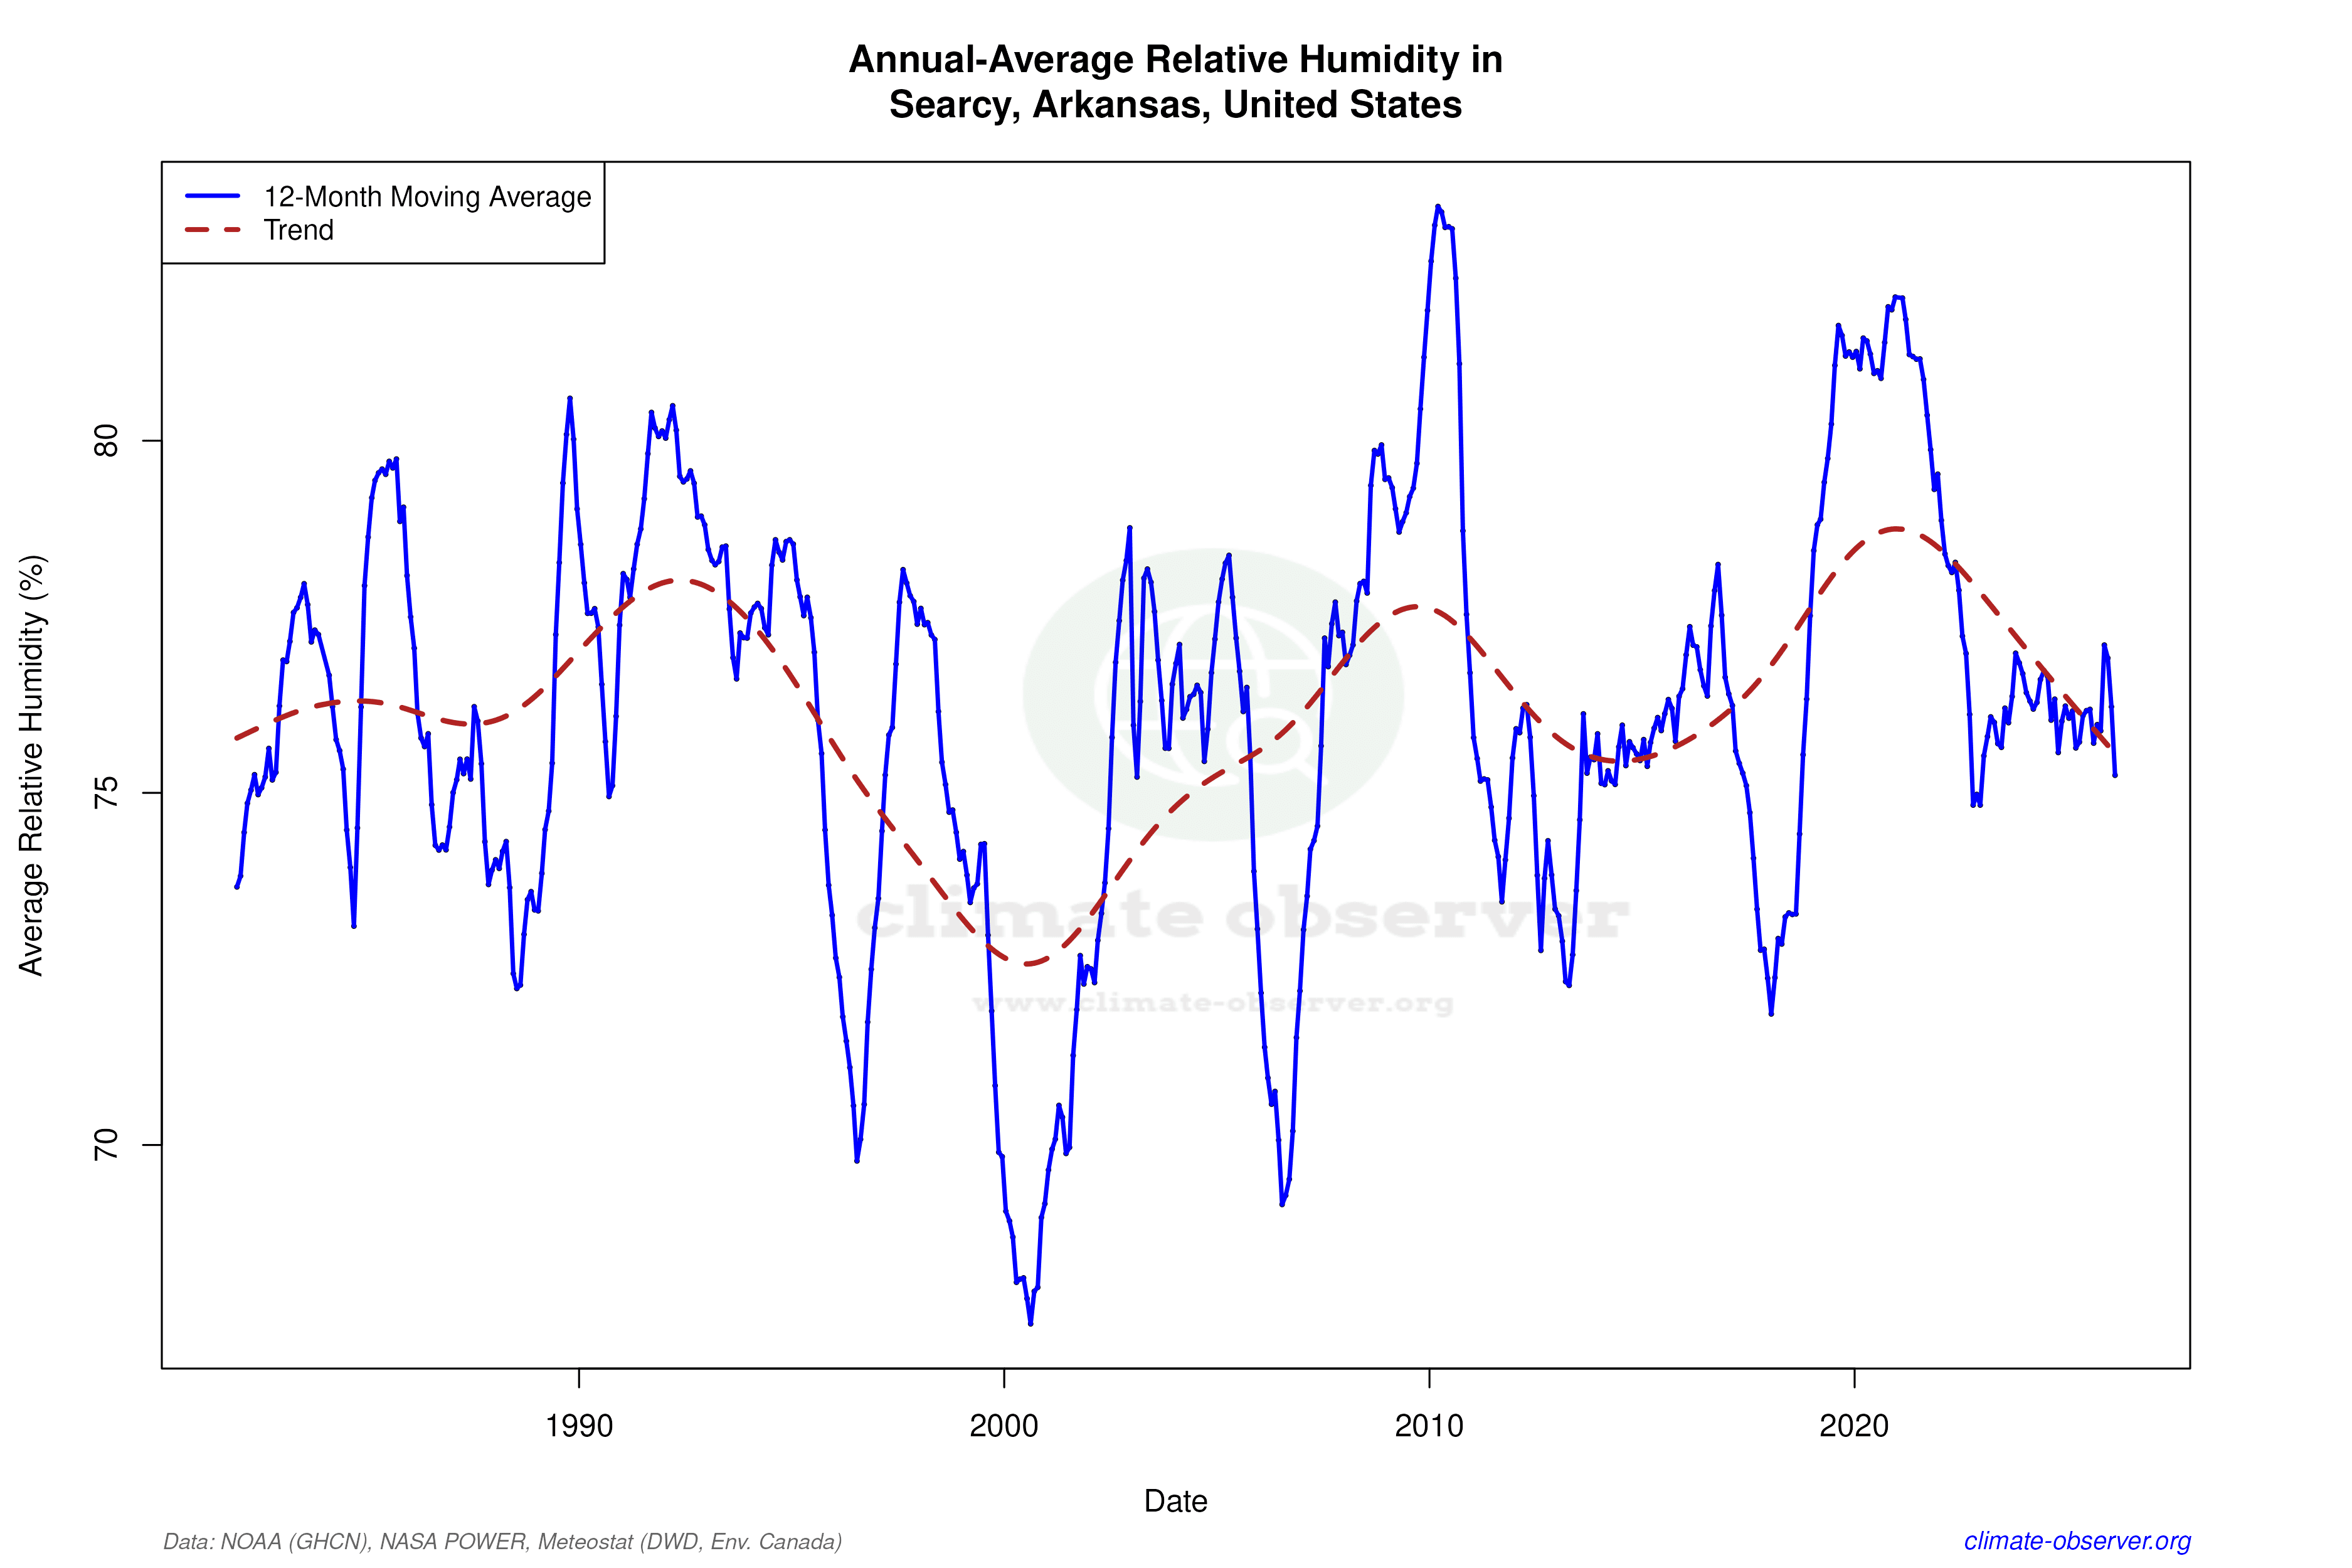

Max Temperature 12-Month MA | 1 of 6
Daily Data Points and Averages Throughout the Year


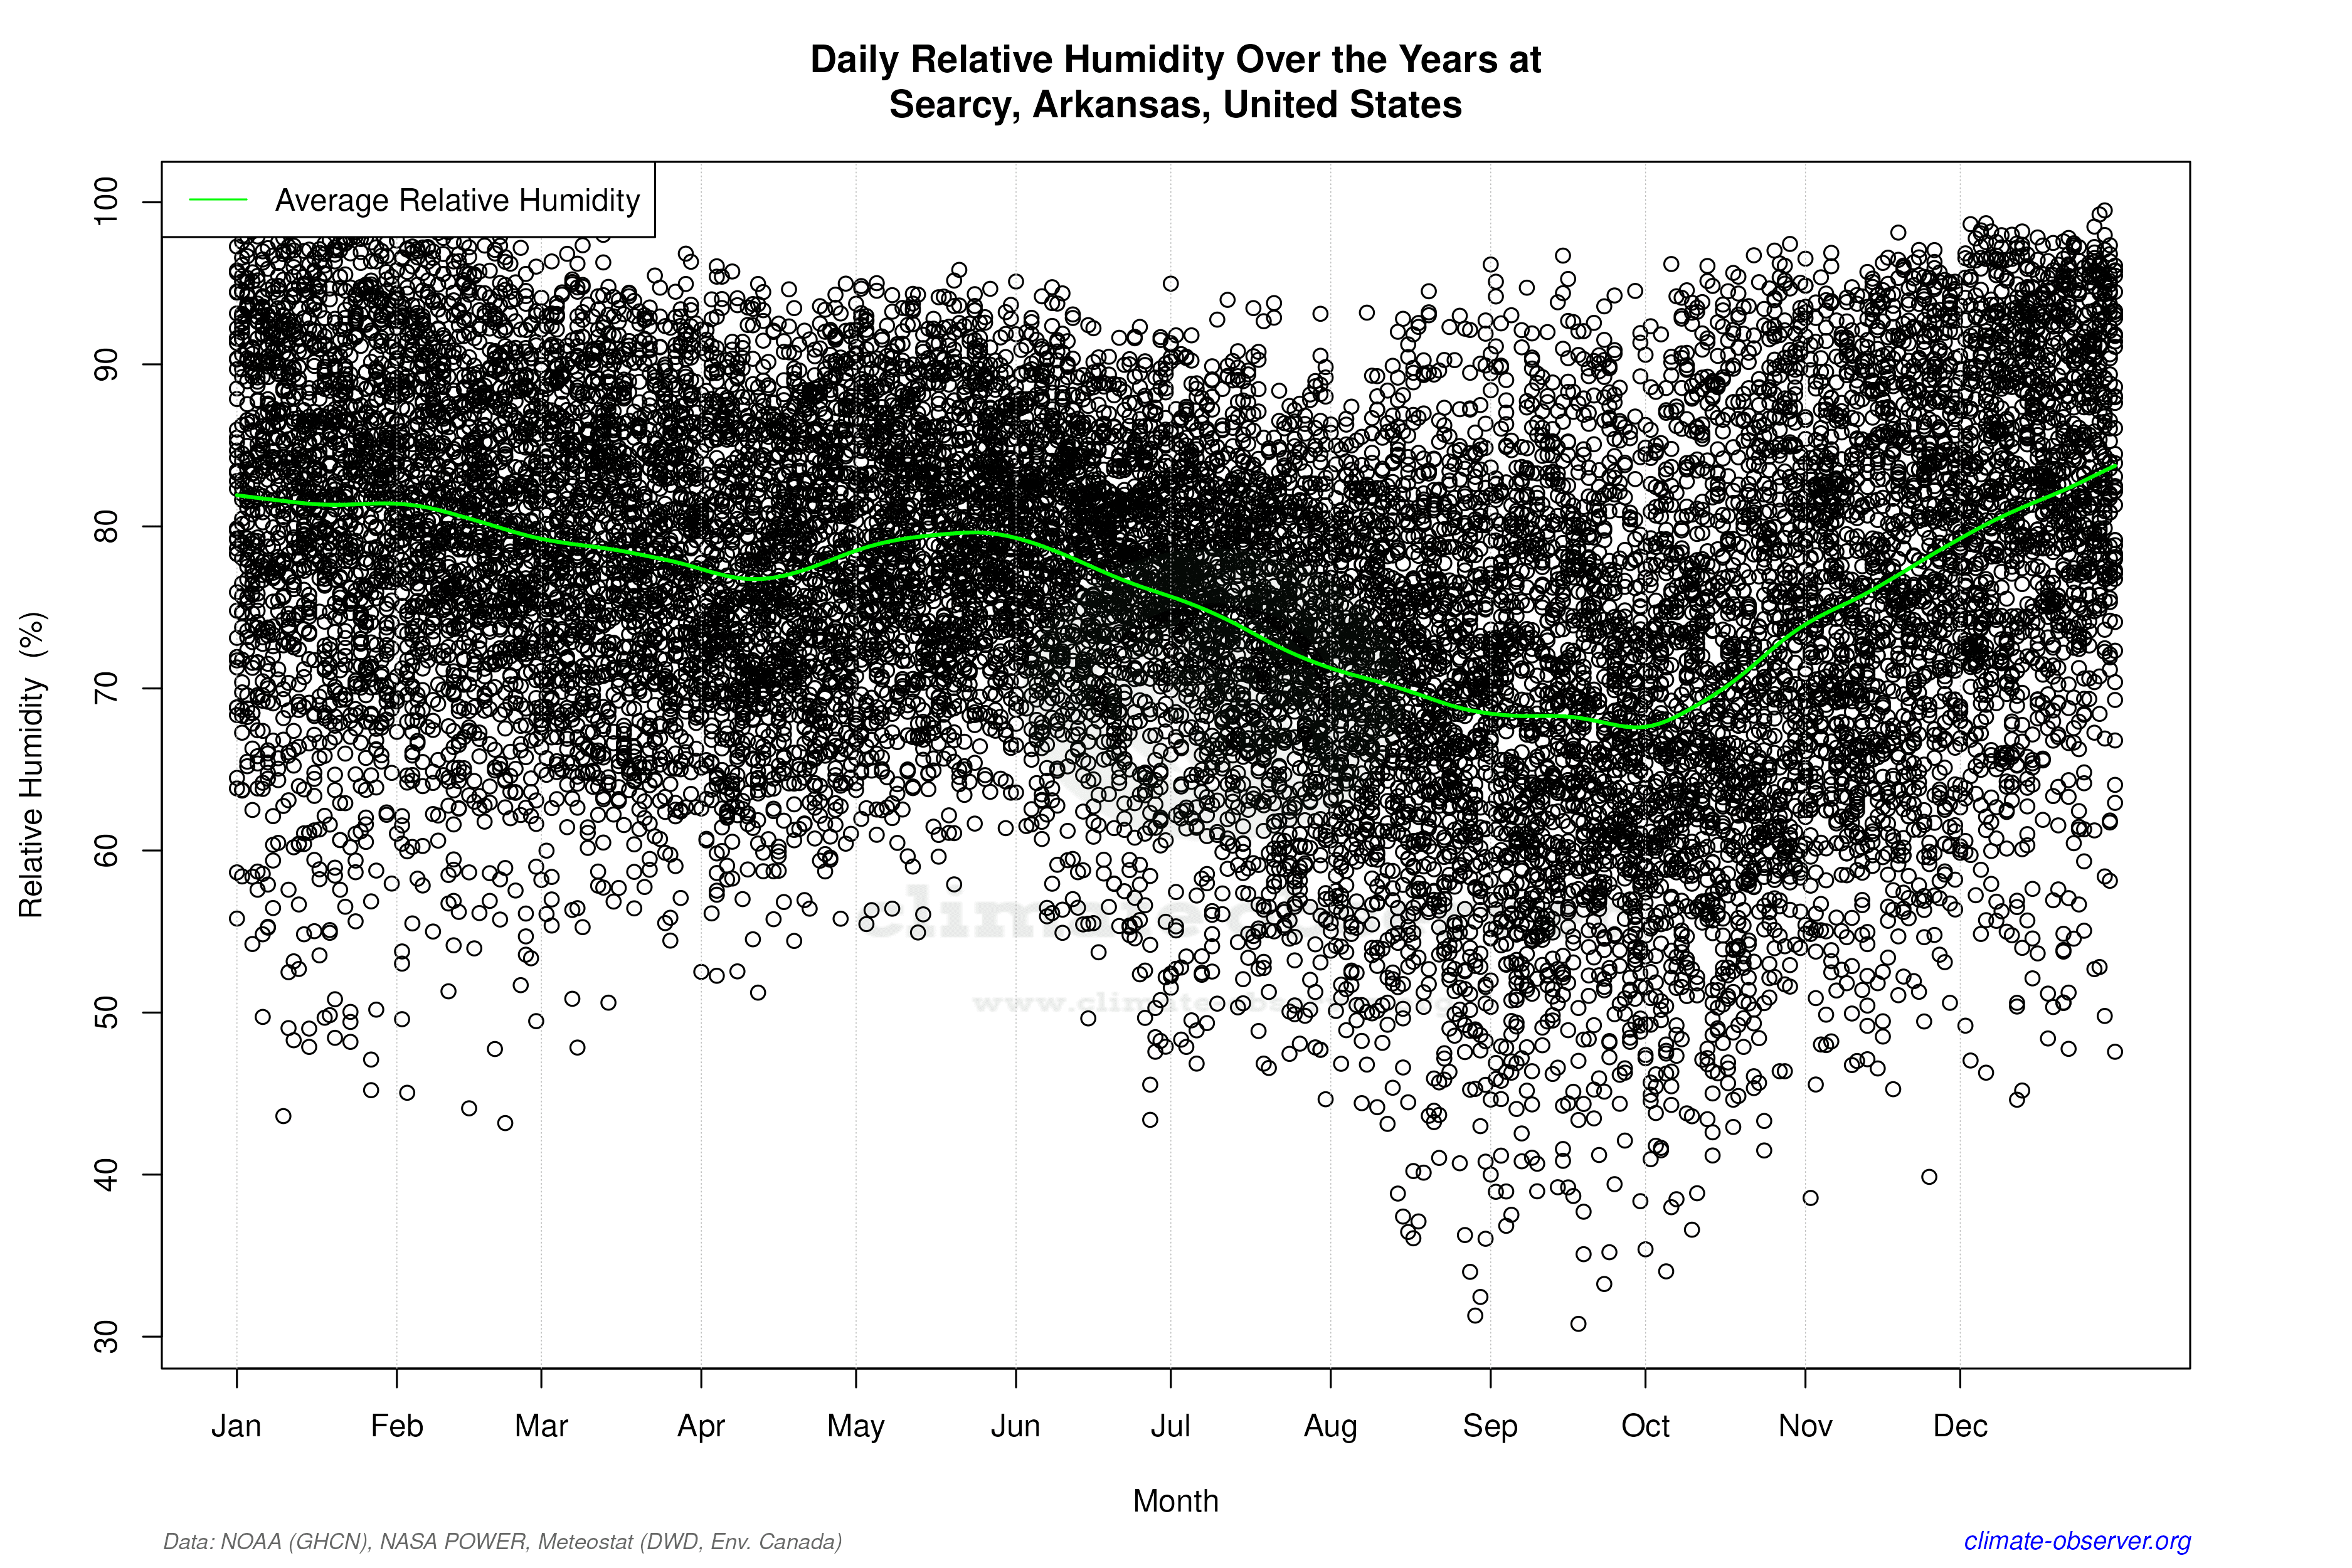

Average Max Temperature Throughout Year | 1 of 5
