Climate for Station: San Francisco Oceanside, California, United States
Loading live weather...
Climate Analysis & Overview
San Francisco Oceanside is experiencing a complex climate narrative. While long-term trends show a slight cooling in high temperatures, recent data indicates a warming of low temperatures. The distribution of rainfall has become more even, suggesting shifts in precipitation patterns.
Coastal Climate Dynamics
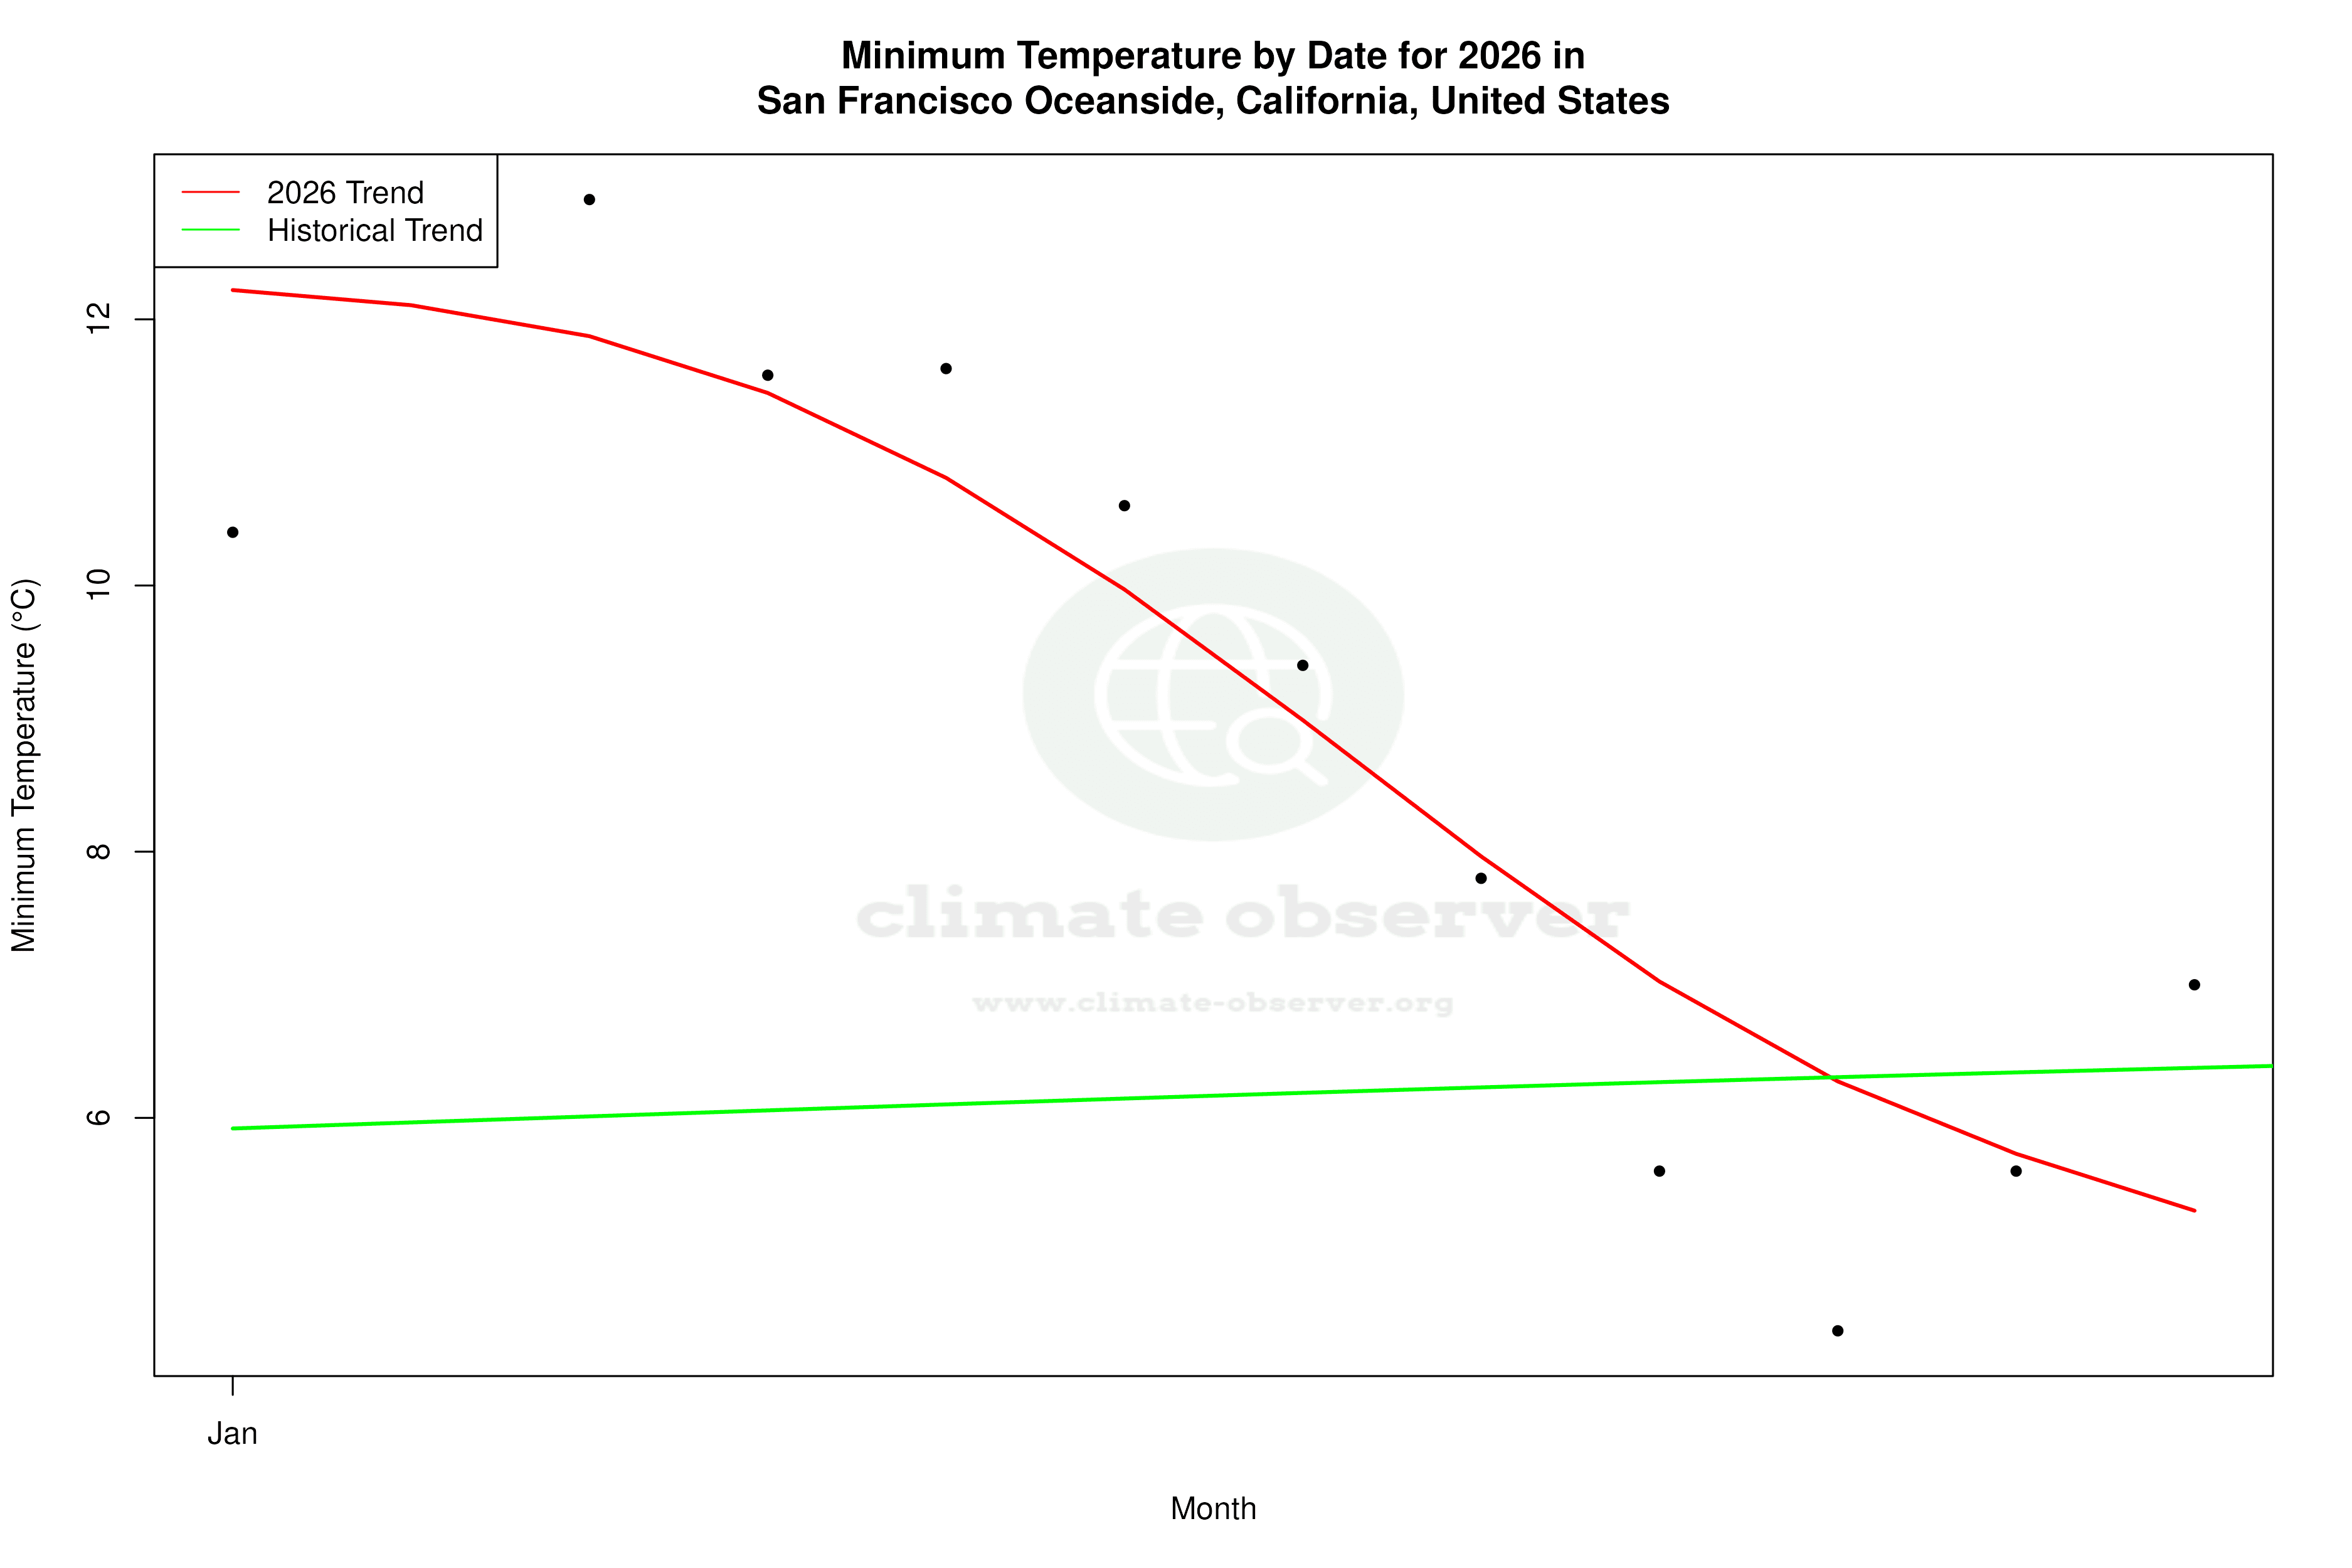
San Francisco Oceanside, located at the Oceanside Water Pollution Control Plant, is characterised by a Mediterranean climate (Köppen classification Csb). The Pacific Ocean's proximity significantly moderates temperatures, leading to mild, wet winters and dry summers. This maritime influence is evident in the all-time trend, where high temperatures have experienced a slight cooling of 0.08°C (0.14°F). In contrast, low temperatures have shown a rise of 0.20°C (0.36°F), indicating a warming trend during cooler periods.
Decadal Temperature Shifts
Over the past decade, the temperature trends have diverged from the all-time patterns. High temperatures have decreased by 1.19°C (2.14°F), suggesting a more pronounced cooling effect recently. Meanwhile, low temperatures have increased by 0.25°C (0.45°F), reinforcing the warming trend observed in the all-time data. These shifts may be influenced by regional climate initiatives aimed at reducing urban heat effects and increasing green cover.
Precipitation Patterns and Changes
The Precipitation Concentration Index (PCI) for San Francisco Oceanside has shown a significant decrease from a baseline of 21.4 to a current value of 15.4. This indicates that rainfall is now more evenly distributed throughout the year, moving away from highly concentrated precipitation events. Such changes can impact water management strategies and local ecosystems, potentially reducing the risk of flooding during intense storms.
Temperature Extremes and Records
San Francisco Oceanside has experienced notable temperature extremes, with a record high of 40.0°C (104.0°F) and a record low of -6.7°C (19.9°F). These records highlight the variability in the region's climate, which, while moderated by the ocean, can still experience significant fluctuations. Understanding these extremes is crucial for preparing for potential future weather events.
Implications for Regional Climate Policy
The observed trends at San Francisco Oceanside align with broader regional climate goals focused on adaptation and resilience. The cooling of high temperatures and the warming of lows suggest that efforts to mitigate urban heat and enhance energy efficiency may be having an impact. Meanwhile, the more even distribution of precipitation could support water conservation initiatives, crucial in a state frequently challenged by drought conditions.
Station Statistics
10-Year Trend
High: -0.71 °C/decade
Low: +0.41 °C/decade
Rain: -0.13 mm/decade
25-Year Trend
High: +0.93 °C/decade
Low: -0.07 °C/decade
Rain: -0.05 mm/decade
50-Year Trend
High: -0.09 °C/decade
Low: +0.10 °C/decade
Rain: -0.03 mm/decade
All-Time Trend
High: -0.07 °C/decade
Low: +0.19 °C/decade
Rain: +0.01 mm/decade
Percentage Above-Average Days
Last 12 Months: 42.7%
This Year: 82.5%
Precipitation Concentration Index (PCI) ℹ️
Last 12 Months: 18.2
Historical Average: 25.2
Percentile Rank of Last 12 Months ℹ️
High: 44th percentile
Low: 83rd percentile
Rain: 41st percentile
Change in Variance ℹ️
High: +27.4%
Low: +12.9%
Intraday: +28.0%
Data Coverage
89.4%
First Year of Data
1943
Station Location
Historical Weather Records
| Max High | Avg High | Min High | Max Avg | Avg Avg | Min Avg | Max Low | Avg Low | Min Low | Max Precipitation | Avg Precipitation | Max Snow | Avg Snow | |
|---|---|---|---|---|---|---|---|---|---|---|---|---|---|
| Record | 40.6 °C | — | 3.9 °C | 28.2 °C | — | 0.0 °C | 22.8 °C | — | -6.7 °C | 97.9 mm | — | 0.0 mm | — |
| January | 27.8 °C | 14.1 °C | 3.9 °C | 17.6 °C | 10.3 °C | 4.3 °C | 21.1 °C | 6.5 °C | -6.7 °C | 88.6 mm | 3.3 mm | 0.0 mm | 0.0 mm |
| February | 25.6 °C | 15.3 °C | 5.6 °C | 18.6 °C | 11.4 °C | 3.0 °C | 17.8 °C | 7.4 °C | -1.7 °C | 74.2 mm | 3.0 mm | 0.0 mm | 0.0 mm |
| March | 29.4 °C | 15.7 °C | 6.7 °C | 21.1 °C | 12.3 °C | 5.7 °C | 17.2 °C | 8.0 °C | -3.9 °C | 50.5 mm | 2.3 mm | 0.0 mm | 0.0 mm |
| April | 32.8 °C | 16.3 °C | 9.4 °C | 23.9 °C | 13.3 °C | 6.3 °C | 17.8 °C | 8.7 °C | -2.8 °C | 33.3 mm | 1.1 mm | 0.0 mm | 0.0 mm |
| May | 35.6 °C | 16.7 °C | 10.6 °C | 25.6 °C | 14.6 °C | 9.5 °C | 18.9 °C | 9.9 °C | 1.7 °C | 32.5 mm | 0.3 mm | 0.0 mm | 0.0 mm |
| June | 40.6 °C | 17.9 °C | 11.1 °C | 26.7 °C | 16.0 °C | 11.3 °C | 18.9 °C | 11.1 °C | 1.1 °C | 42.2 mm | 0.1 mm | 0.0 mm | 0.0 mm |
| July | 37.2 °C | 18.2 °C | 6.7 °C | 24.8 °C | 16.7 °C | 12.8 °C | 18.3 °C | 11.9 °C | 4.4 °C | 12.7 mm | 0.0 mm | 0.0 mm | 0.0 mm |
| August | 37.8 °C | 18.9 °C | 11.7 °C | 25.6 °C | 17.1 °C | 12.7 °C | 19.4 °C | 12.6 °C | 4.4 °C | 30.5 mm | 0.0 mm | 0.0 mm | 0.0 mm |
| September | 38.9 °C | 19.9 °C | 12.2 °C | 28.2 °C | 17.3 °C | 12.6 °C | 20.0 °C | 12.4 °C | 2.2 °C | 50.3 mm | 0.1 mm | 0.0 mm | 0.0 mm |
| October | 37.2 °C | 19.7 °C | 7.2 °C | 25.6 °C | 16.1 °C | 10.9 °C | 22.8 °C | 11.1 °C | -0.6 °C | 97.9 mm | 0.7 mm | 0.0 mm | 0.0 mm |
| November | 32.2 °C | 17.1 °C | 7.8 °C | 20.1 °C | 13.1 °C | 7.0 °C | 20.0 °C | 8.8 °C | -3.3 °C | 60.7 mm | 1.9 mm | 0.0 mm | 0.0 mm |
| December | 23.9 °C | 14.3 °C | 4.4 °C | 17.3 °C | 10.5 °C | 0.0 °C | 16.7 °C | 6.9 °C | -6.7 °C | 93.2 mm | 3.2 mm | 0.0 mm | 0.0 mm |
Data Visualisations
Remove WatermarksCurrent Year Climate Trends vs Historical


Max Temperature this Year | 1 of 6
Climate 12-Month Moving Averages


Max Temperature 12-Month MA | 1 of 6
Daily Data Points and Averages Throughout the Year


Average Max Temperature Throughout Year | 1 of 5
