Climate for Station: Yreka, California, United States
Loading live weather...
Climate Analysis & Overview
Yreka's climate story is one of subtle shifts and contrasts. While the all-time temperature trends reveal a slight warming of 0.08°C (0.14°F) for highs, the recent decade tells a different tale with a cooling of 0.20°C (0.36°F). Meanwhile, precipitation has become more evenly distributed, reflecting broader regional climate goals.
A Tale of Two Temperature Trends
Yreka, located in Siskiyou County, California, is characterised by a Mediterranean climate with hot, dry summers and cool, wet winters. Nestled in the Klamath Mountains, the region's climate is influenced by its elevation and proximity to the Pacific Ocean. The all-time temperature trends in Yreka show a modest warming of 0.08°C (0.14°F) for highs and 0.06°C (0.11°F) for lows. However, the last decade presents a contrasting narrative with a cooling of 0.20°C (0.36°F) in highs and a more pronounced cooling of 1.35°C (2.43°F) in lows. This divergence highlights the complexity of regional climate patterns and the importance of long-term monitoring to understand these shifts fully.
Extremes in Temperature Records
Yreka has experienced notable temperature extremes, with a record high of 51.1°C (124.0°F) and a record low of -23.9°C (-11.0°F). These records reflect the wide thermal range typical of interior California regions, where summer heat can be intense, and winter cold can be severe. Such extremes are crucial for understanding the potential impacts of climate variability on local ecosystems and communities.
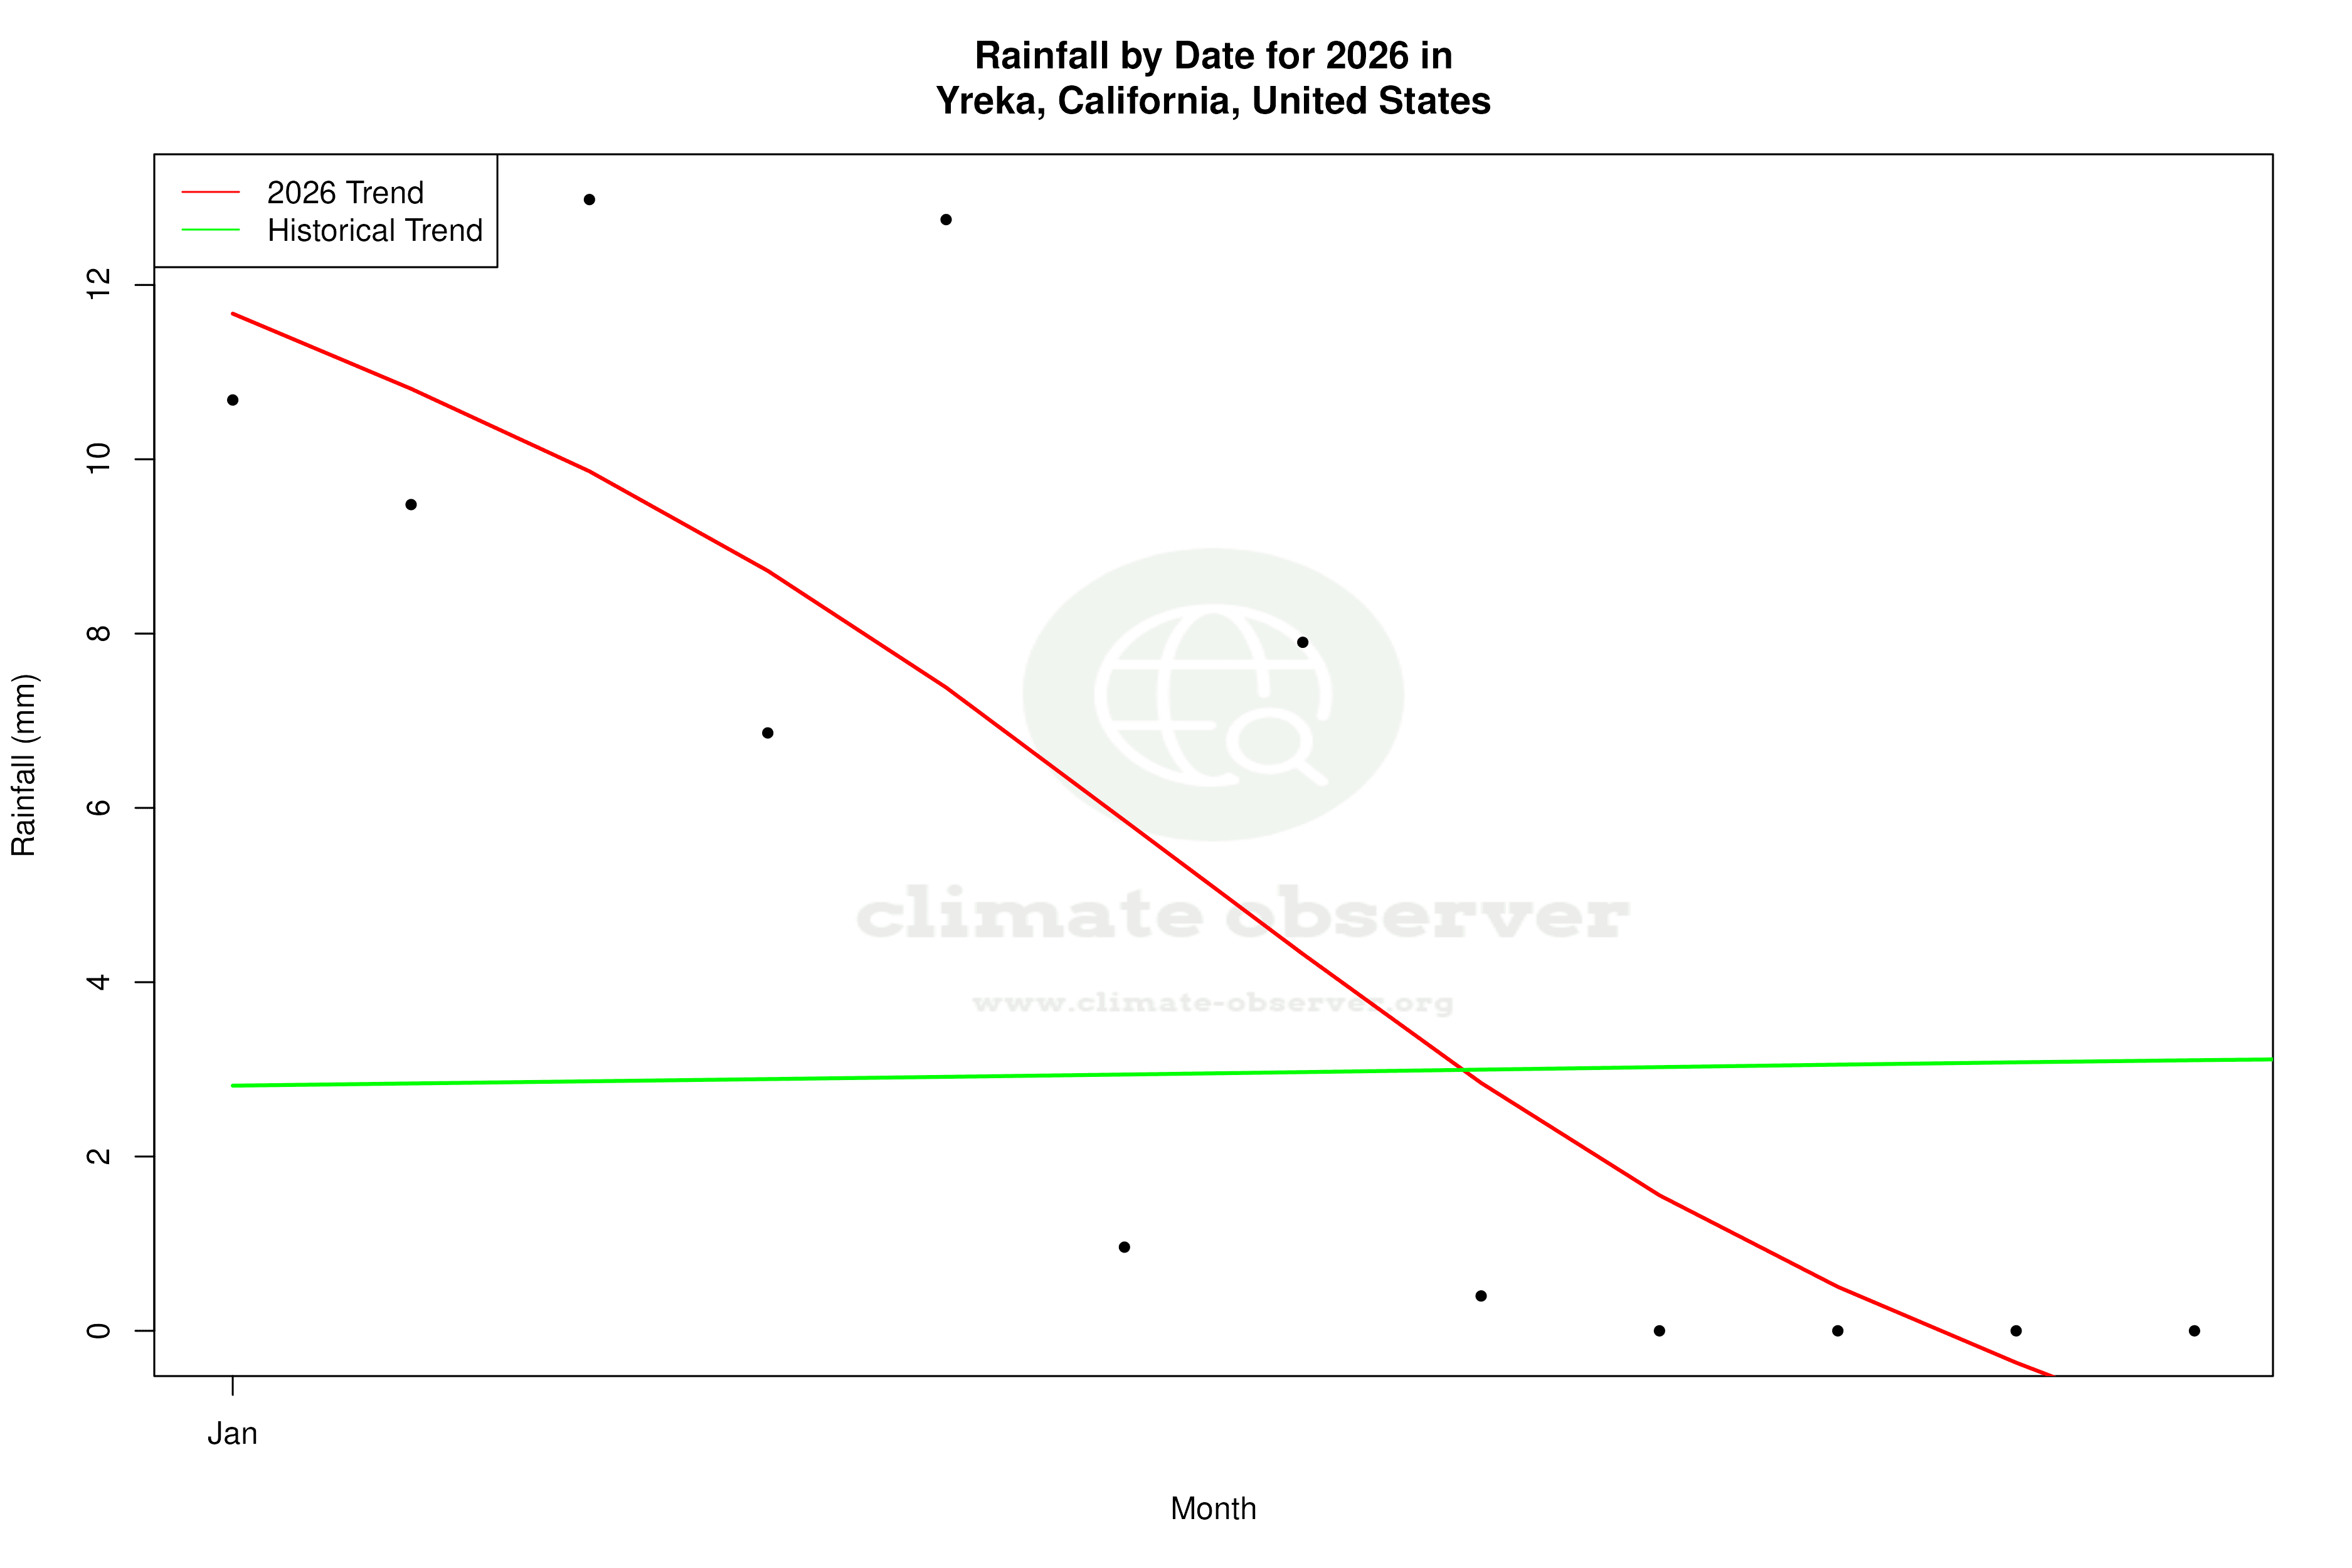
Precipitation Patterns: A Shift Towards Evenness
The Precipitation Concentration Index (PCI) is a measure of how rainfall is distributed over time. Yreka's PCI has decreased from a baseline of 17.67 to a current value of 15.38, indicating a more even distribution of precipitation events. This shift suggests that rainfall is becoming less concentrated in intense storms, aligning with broader regional climate goals of reducing flood risks and promoting water resource sustainability.
Geographical Influences on Climate Trends
Yreka's location in the Klamath Mountains significantly influences its climate. The mountains act as a barrier, affecting wind patterns and precipitation distribution. This geographical setting contributes to the area's unique climate characteristics, where localised weather patterns can differ markedly from broader regional trends. Understanding these geographical influences is essential for interpreting the observed climate data accurately.
Regional Climate Goals and Future Implications
The observed trends in Yreka's climate data align with broader regional efforts to mitigate climate change impacts. The shift towards more evenly distributed precipitation is a positive sign for water resource management and flood prevention. However, the contrasting temperature trends underscore the need for continued monitoring and adaptive strategies to address the challenges posed by climate variability.
Station Statistics
10-Year Trend
High: -0.01 °C/decade
Low: -1.20 °C/decade
Rain: -1.23 mm/decade
25-Year Trend
High: +0.22 °C/decade
Low: +0.90 °C/decade
Rain: -0.33 mm/decade
50-Year Trend
High: +0.34 °C/decade
Low: +0.27 °C/decade
Rain: -0.07 mm/decade
All-Time Trend
High: +0.08 °C/decade
Low: +0.07 °C/decade
Rain: +0.08 mm/decade
Percentage Above-Average Days
Last 12 Months: 50.1%
This Year: 67.9%
Precipitation Concentration Index (PCI) ℹ️
Last 12 Months: 15.3
Historical Average: 17.2
Percentile Rank of Last 12 Months ℹ️
High: 80th percentile
Low: 64th percentile
Rain: 66th percentile
Change in Variance ℹ️
High: +9.0%
Low: +2.2%
Intraday: -2.7%
Data Coverage
83.5%
First Year of Data
1893
Station Location
Historical Weather Records
| Max High | Avg High | Min High | Max Avg | Avg Avg | Min Avg | Max Low | Avg Low | Min Low | Max Precipitation | Avg Precipitation | Max Snow | Avg Snow | |
|---|---|---|---|---|---|---|---|---|---|---|---|---|---|
| Record | 51.1 °C | — | -11.7 °C | 33.3 °C | — | -14.2 °C | 27.8 °C | — | -23.9 °C | 160.0 mm | — | 1600.0 mm | — |
| January | 19.4 °C | 7.0 °C | -11.7 °C | 13.5 °C | 0.8 °C | -14.0 °C | 7.8 °C | -4.2 °C | -23.9 °C | 160.0 mm | 2.9 mm | 1600.0 mm | 6.3 mm |
| February | 23.3 °C | 10.3 °C | -6.1 °C | 13.0 °C | 2.3 °C | -13.0 °C | 8.9 °C | -2.7 °C | -23.3 °C | 74.0 mm | 2.6 mm | 318.0 mm | 3.6 mm |
| March | 27.8 °C | 13.8 °C | -6.7 °C | 16.4 °C | 4.8 °C | -5.3 °C | 9.4 °C | -0.9 °C | -17.8 °C | 53.1 mm | 2.1 mm | 320.0 mm | 1.4 mm |
| April | 35.6 °C | 17.7 °C | 1.7 °C | 19.5 °C | 8.0 °C | -3.9 °C | 15.0 °C | 1.4 °C | -8.3 °C | 35.3 mm | 1.2 mm | 152.0 mm | 0.4 mm |
| May | 39.4 °C | 22.9 °C | 1.7 °C | 26.3 °C | 12.3 °C | 0.5 °C | 24.4 °C | 4.7 °C | -6.7 °C | 35.4 mm | 1.0 mm | 33.0 mm | 0.0 mm |
| June | 42.8 °C | 27.7 °C | 7.2 °C | 31.2 °C | 16.9 °C | 3.9 °C | 26.1 °C | 8.2 °C | -3.3 °C | 29.3 mm | 0.7 mm | 0.0 mm | 0.0 mm |
| July | 51.1 °C | 33.2 °C | 13.3 °C | 33.3 °C | 22.2 °C | 6.4 °C | 27.8 °C | 11.5 °C | 1.1 °C | 33.3 mm | 0.3 mm | 0.0 mm | 0.0 mm |
| August | 43.3 °C | 32.5 °C | 14.4 °C | 30.4 °C | 21.4 °C | 9.1 °C | 26.1 °C | 10.9 °C | -0.6 °C | 28.7 mm | 0.3 mm | 0.0 mm | 0.0 mm |
| September | 41.7 °C | 28.0 °C | 7.8 °C | 28.5 °C | 17.1 °C | 3.5 °C | 18.9 °C | 7.0 °C | -6.7 °C | 32.5 mm | 0.5 mm | 8.0 mm | 0.0 mm |
| October | 35.0 °C | 20.8 °C | 2.2 °C | 21.2 °C | 10.5 °C | -0.3 °C | 15.0 °C | 2.4 °C | -13.9 °C | 53.8 mm | 1.2 mm | 102.0 mm | 0.1 mm |
| November | 30.6 °C | 12.0 °C | -4.4 °C | 15.0 °C | 4.1 °C | -8.3 °C | 12.2 °C | -1.4 °C | -17.2 °C | 75.9 mm | 2.6 mm | 378.0 mm | 1.5 mm |
| December | 18.9 °C | 7.0 °C | -10.6 °C | 11.7 °C | 0.7 °C | -14.2 °C | 9.4 °C | -3.5 °C | -23.9 °C | 116.1 mm | 3.4 mm | 762.0 mm | 4.5 mm |
Data Visualisations
Remove WatermarksCurrent Year Climate Trends vs Historical


Max Temperature this Year | 1 of 6
Climate 12-Month Moving Averages


Max Temperature 12-Month MA | 1 of 6
Daily Data Points and Averages Throughout the Year


Average Max Temperature Throughout Year | 1 of 5
