Climate for Station: Dillon 1 e, Colorado, United States
Loading live weather...
Climate Analysis & Overview
Dillon 1 e, nestled in the heart of Colorado's mountainous terrain, reveals a complex climatic narrative. While the all-time data suggest a slight cooling trend in high temperatures and a warming trend in lows, the recent decade shows a contrasting pattern. Precipitation has become more evenly distributed, hinting at subtle shifts in local weather dynamics.
Mountainous Climate Dynamics
Dillon 1 e is situated in the high-altitude regions of Summit County, Colorado, characterised by a Köppen climate classification of Dfb, denoting a humid continental climate with warm summers and cold, snowy winters. The surrounding Rocky Mountains significantly influence local weather patterns, contributing to temperature variations and precipitation distribution. This geographical context is crucial for understanding the station's climatic data, where elevation plays a pivotal role in shaping the thermal and hydrological profiles.
Temperature Trends: A Tale of Two Scales
The all-time temperature trends at Dillon 1 e reveal a nuanced story. The high temperatures have experienced a slight cooling of 0.00°C (0.01°F), while low temperatures have shown a notable warming of 0.34°C (0.61°F). This suggests a narrowing of the diurnal temperature range over the long term. However, the 10-year trends paint a different picture, with high temperatures showing a warming of 0.29°C (0.52°F) and low temperatures a cooling of 0.05°C (0.09°F). These contrasting trends highlight the complexity of climate dynamics in this region, possibly influenced by both natural variability and anthropogenic factors.
Precipitation Patterns: A Shift Towards Even Distribution
The Precipitation Concentration Index (PCI) at Dillon 1 e has decreased from a baseline of 10.66 to a current value of 8.54. This indicates a more even distribution of precipitation events over time. A lower PCI suggests that rainfall is spread more uniformly throughout the year, reducing the risk of intense, concentrated downpours. This shift could be beneficial for local water management and agricultural practices, ensuring a steadier water supply.
Extreme Temperature Records
Dillon 1 e has recorded extreme temperatures, with a maximum of 31.7°C (89.1°F) and a minimum of -43.3°C (-45.9°F). These records underscore the station's exposure to significant thermal extremes, typical of high-altitude environments. Such extremes can have profound implications for local ecosystems, infrastructure, and human activities, necessitating adaptive strategies to mitigate potential impacts.
Regional Climate Considerations
In the broader context of the United States' climate goals, Dillon 1 e's data provide valuable insights into regional climate trends. The observed changes align with national efforts to understand and adapt to climate variability, particularly in mountainous regions. Recent weather events, such as increased snowfall or unexpected warm spells, further highlight the importance of continuous monitoring and research to inform policy and decision-making.
Station Statistics
10-Year Trend
High: +0.15 °C/decade
Low: -0.14 °C/decade
Rain: +0.89 mm/decade
25-Year Trend
High: +0.17 °C/decade
Low: +0.12 °C/decade
Rain: +0.21 mm/decade
50-Year Trend
High: +0.20 °C/decade
Low: +0.02 °C/decade
Rain: +0.15 mm/decade
All-Time Trend
High: -0.00 °C/decade
Low: +0.34 °C/decade
Rain: +0.05 mm/decade
Percentage Above-Average Days
Last 12 Months: 56.7%
This Year: 46.2%
Precipitation Concentration Index (PCI) ℹ️
Last 12 Months: 8.8
Historical Average: 11.4
Percentile Rank of Last 12 Months ℹ️
High: 86th percentile
Low: 91st percentile
Rain: 92nd percentile
Change in Variance ℹ️
High: +8.9%
Low: -20.1%
Intraday: -25.9%
Data Coverage
84.0%
First Year of Data
1893
Station Location
Historical Weather Records
| Max High | Avg High | Min High | Max Avg | Avg Avg | Min Avg | Max Low | Avg Low | Min Low | Max Precipitation | Avg Precipitation | Max Snow | Avg Snow | |
|---|---|---|---|---|---|---|---|---|---|---|---|---|---|
| Record | 31.7 °C | — | -23.3 °C | 18.8 °C | — | -31.2 °C | 17.2 °C | — | -43.3 °C | 59.4 mm | — | 610.0 mm | — |
| January | 16.1 °C | -0.5 °C | -23.3 °C | 3.3 °C | -11.2 °C | -28.1 °C | 2.2 °C | -18.1 °C | -42.2 °C | 24.1 mm | 1.1 mm | 406.0 mm | 14.9 mm |
| February | 15.6 °C | 0.9 °C | -21.1 °C | 3.2 °C | -10.4 °C | -31.2 °C | 3.3 °C | -16.7 °C | -42.8 °C | 35.8 mm | 1.3 mm | 368.0 mm | 16.3 mm |
| March | 17.2 °C | 4.0 °C | -15.0 °C | 6.0 °C | -6.9 °C | -23.8 °C | 7.8 °C | -13.3 °C | -38.9 °C | 46.5 mm | 1.5 mm | 457.0 mm | 17.4 mm |
| April | 24.4 °C | 8.7 °C | -10.0 °C | 8.7 °C | -2.4 °C | -17.8 °C | 9.4 °C | -8.0 °C | -30.6 °C | 50.8 mm | 1.7 mm | 610.0 mm | 15.2 mm |
| May | 26.7 °C | 14.6 °C | -3.3 °C | 15.4 °C | 3.1 °C | -12.2 °C | 9.4 °C | -3.5 °C | -17.8 °C | 47.8 mm | 1.4 mm | 356.0 mm | 6.1 mm |
| June | 30.6 °C | 20.6 °C | 2.2 °C | 18.8 °C | 9.4 °C | -4.8 °C | 11.1 °C | -0.1 °C | -11.7 °C | 36.6 mm | 1.1 mm | 254.0 mm | 0.6 mm |
| July | 31.7 °C | 23.6 °C | 10.0 °C | 18.3 °C | 12.7 °C | 3.0 °C | 17.2 °C | 3.0 °C | -5.6 °C | 41.4 mm | 1.7 mm | 0.0 mm | 0.0 mm |
| August | 30.6 °C | 22.6 °C | 11.1 °C | 18.5 °C | 11.6 °C | 2.6 °C | 17.2 °C | 2.3 °C | -6.7 °C | 32.3 mm | 1.6 mm | 0.0 mm | 0.0 mm |
| September | 28.9 °C | 19.2 °C | -1.1 °C | 17.8 °C | 7.5 °C | -6.4 °C | 8.9 °C | -1.7 °C | -15.6 °C | 50.8 mm | 1.3 mm | 279.0 mm | 1.2 mm |
| October | 25.0 °C | 12.9 °C | -12.2 °C | 12.9 °C | 0.8 °C | -18.5 °C | 15.0 °C | -6.4 °C | -27.2 °C | 41.7 mm | 1.1 mm | 356.0 mm | 6.1 mm |
| November | 18.3 °C | 5.1 °C | -15.0 °C | 6.8 °C | -6.0 °C | -25.5 °C | 3.3 °C | -12.1 °C | -37.8 °C | 24.1 mm | 1.1 mm | 356.0 mm | 12.6 mm |
| December | 16.1 °C | 0.3 °C | -20.0 °C | 4.6 °C | -10.8 °C | -30.2 °C | 0.0 °C | -16.7 °C | -43.3 °C | 59.4 mm | 1.2 mm | 406.0 mm | 14.4 mm |
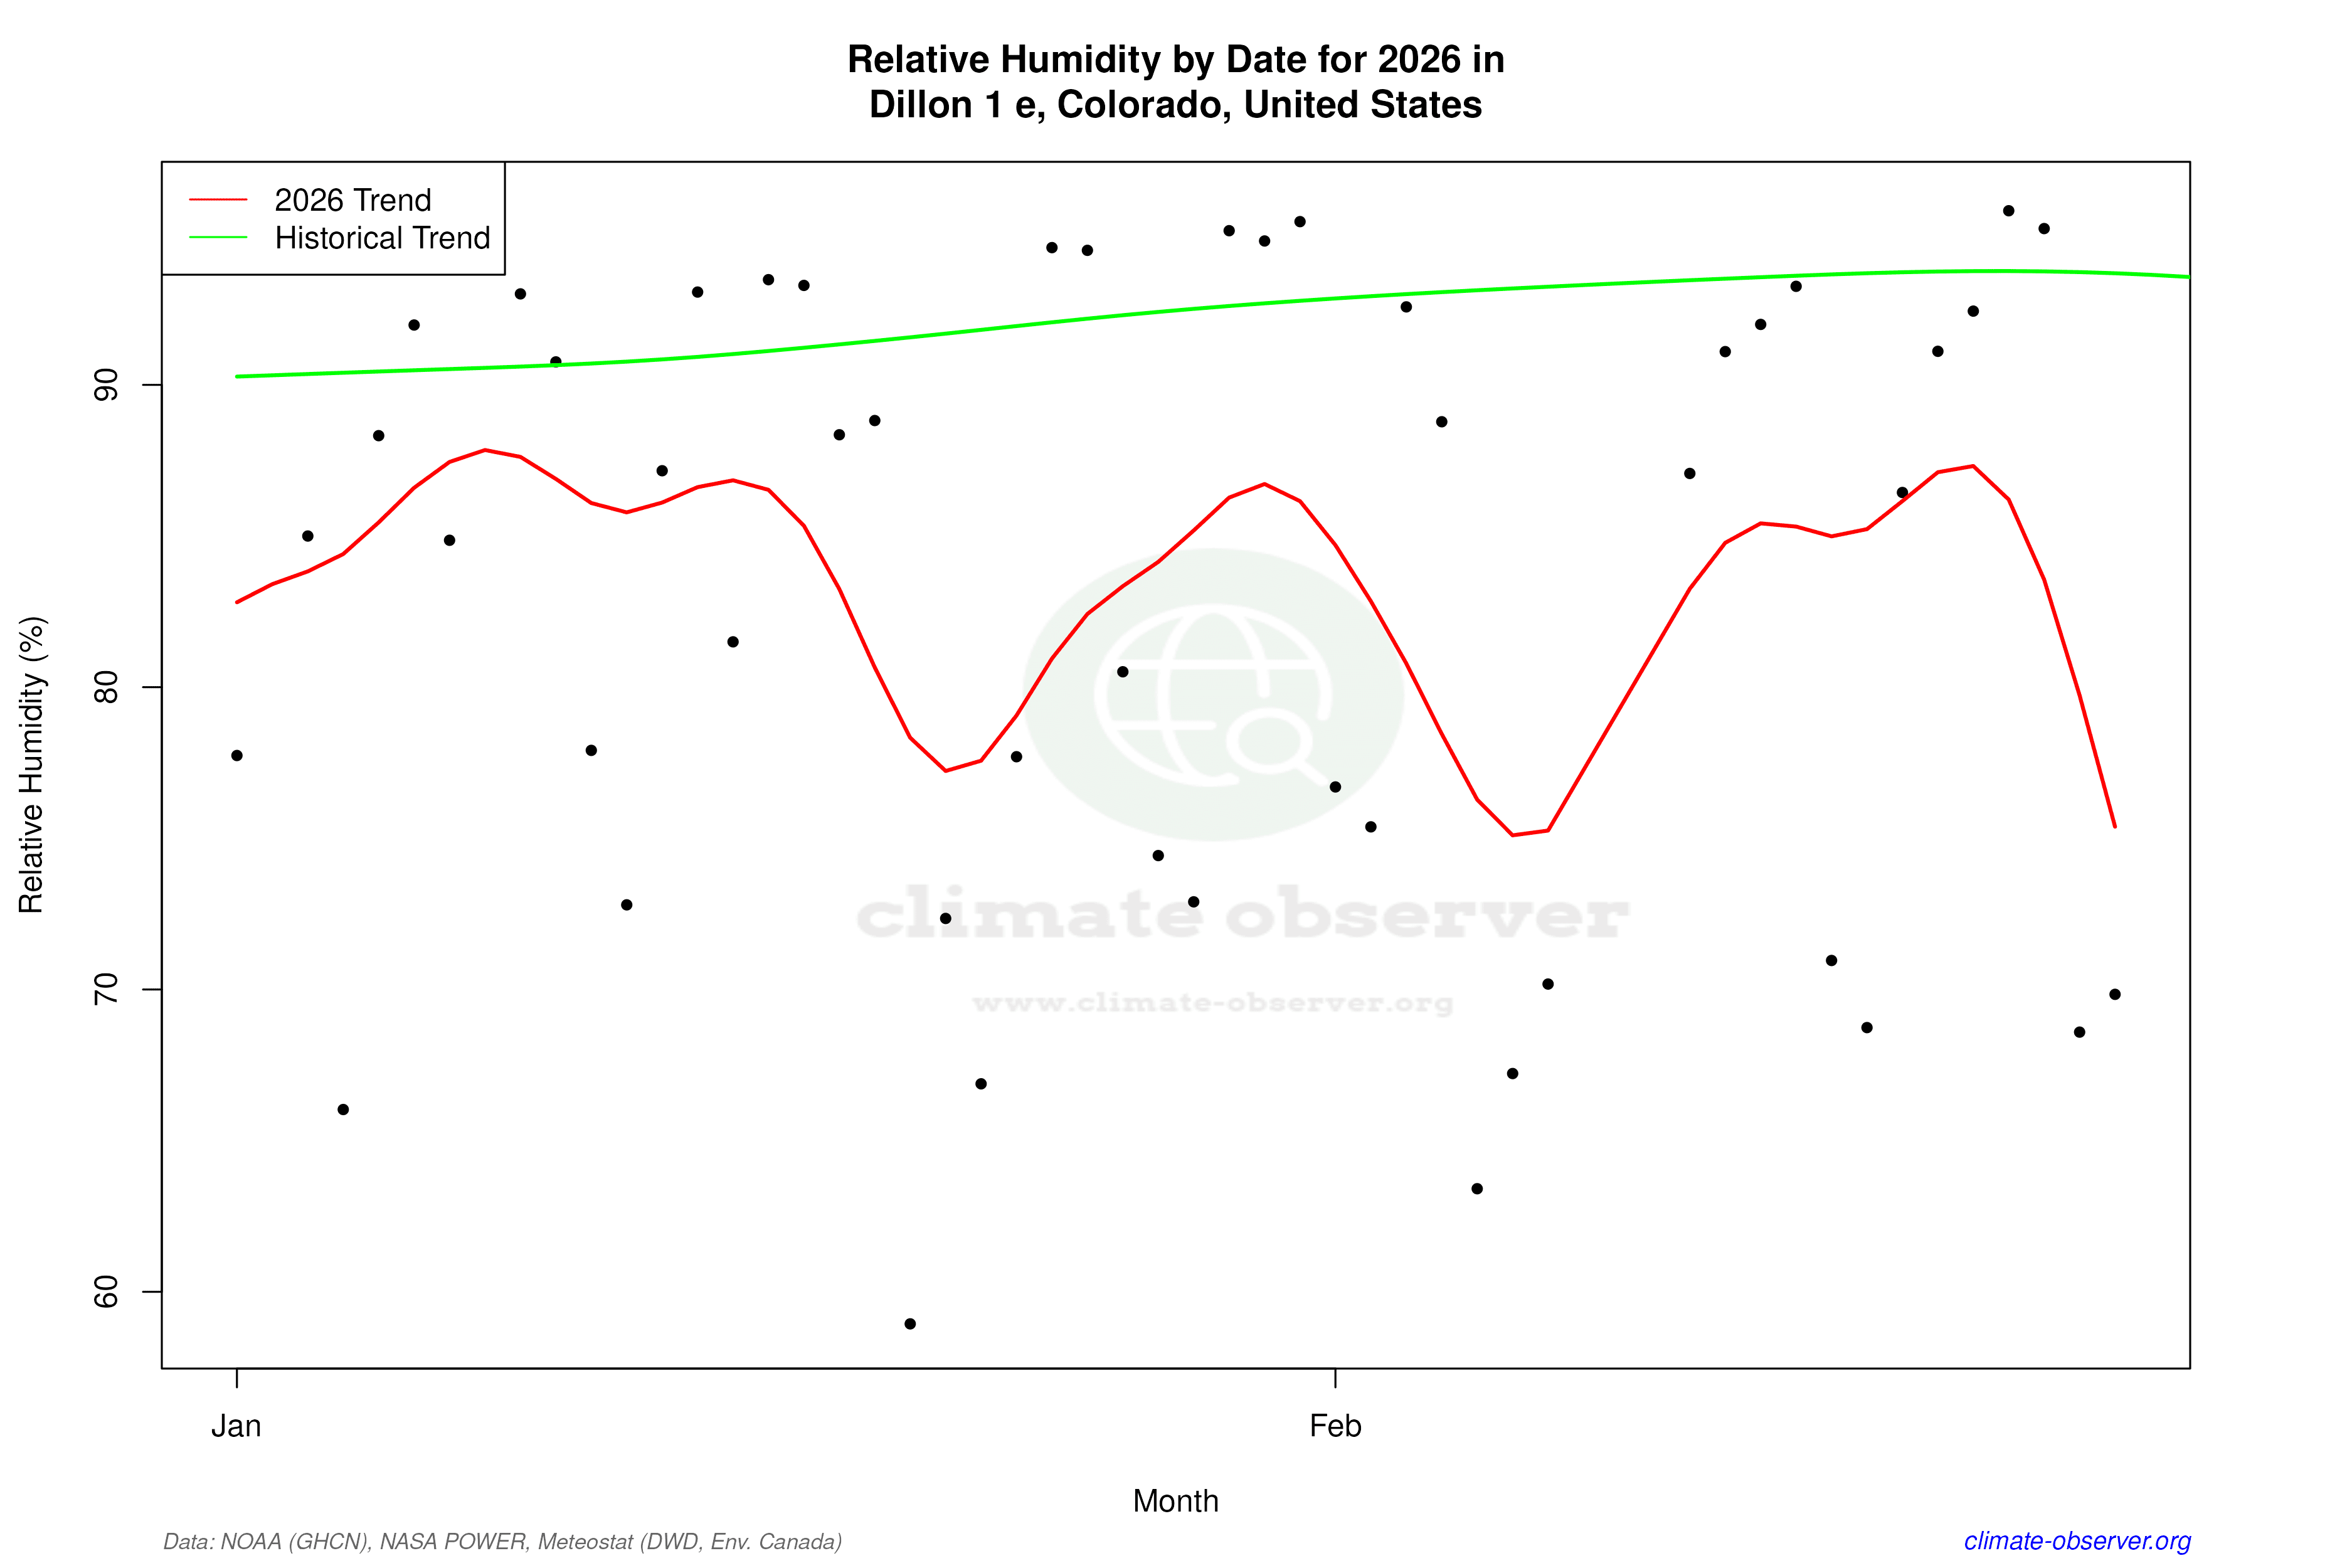
Data Visualisations
Remove WatermarksCurrent Year Climate Trends vs Historical


Max Temperature this Year | 1 of 6
Climate 12-Month Moving Averages


Max Temperature 12-Month MA | 1 of 6
Daily Data Points and Averages Throughout the Year


Average Max Temperature Throughout Year | 1 of 5
