Climate for Station: Fernandina Beach, Florida, United States
Loading live weather...
Climate Analysis & Overview
Fernandina Beach, located on Florida's northeastern coast, experiences a complex climate narrative. While long-term trends indicate a slight warming, recent data reveals a stark contrast with a notable cooling in low temperatures. Precipitation patterns are becoming more concentrated, suggesting potential challenges in water management.
Coastal Climate Dynamics
Fernandina Beach, situated at 30.6669°N, -81.4525°W, falls under the humid subtropical climate classification (Köppen: Cfa). This classification is characterized by hot, humid summers and mild winters, heavily influenced by its proximity to the Atlantic Ocean. The oceanic influence moderates temperature extremes, yet the region is not immune to significant climatic shifts.
Temperature Trends: A Tale of Two Directions
The all-time temperature trends for Fernandina Beach reveal a subtle warming pattern, with highs increasing by 0.03°C (0.05°F) and lows rising by 0.06°C (0.11°F). However, the last decade tells a different story. High temperatures have increased by 0.74°C (1.33°F), while low temperatures have experienced a significant cooling of -1.57°C (-2.82°F). This divergence suggests a more pronounced diurnal temperature range, which could impact local ecosystems and energy consumption patterns.
Precipitation Patterns: Increasing Concentration
The Precipitation Concentration Index (PCI) for Fernandina Beach has increased from a baseline of 12.51 to a current value of 13.40. This indicates a marginal shift towards more concentrated rainfall events. While not yet reaching the threshold of highly concentrated precipitation, this trend could lead to challenges in water management and flood mitigation, especially during the hurricane season, which is a significant concern for coastal communities in Florida.
Record Extremes: Historical Context
Fernandina Beach's climate records highlight the potential for extreme weather events. The highest recorded temperature is 40.0°C (104.0°F), while the lowest plummeted to -15.6°C (3.9°F). These extremes underscore the variability inherent in the region's climate, influenced by both tropical and polar air masses.
Regional Implications and Future Considerations
The climate trends observed in Fernandina Beach reflect broader patterns seen across the southeastern United States, where climate change and variability pose challenges to achieving regional climate goals. The cooling trend in low temperatures over the past decade may offer temporary relief from heat stress but complicates long-term planning for agriculture and infrastructure. As precipitation becomes more concentrated, the region must adapt to potential increases in flooding and water scarcity during dry spells.
Station Statistics
10-Year Trend
High: +0.74 °C/decade
Low: -1.77 °C/decade
Rain: +1.64 mm/decade
25-Year Trend
High: +0.55 °C/decade
Low: +0.37 °C/decade
Rain: +0.36 mm/decade
50-Year Trend
High: +0.32 °C/decade
Low: +0.40 °C/decade
Rain: -0.10 mm/decade
All-Time Trend
High: +0.01 °C/decade
Low: +0.04 °C/decade
Rain: -0.00 mm/decade
Percentage Above-Average Days
Last 12 Months: 62.1%
This Year: 55.1%
Precipitation Concentration Index (PCI) ℹ️
Last 12 Months: 13.7
Historical Average: 12.0
Percentile Rank of Last 12 Months ℹ️
High: 93rd percentile
Low: 77th percentile
Rain: 32nd percentile
Change in Variance ℹ️
High: -13.3%
Low: -1.2%
Intraday: +49.1%
Data Coverage
82.4%
First Year of Data
1892
Station Location
Historical Weather Records
| Max High | Avg High | Min High | Max Avg | Avg Avg | Min Avg | Max Low | Avg Low | Min Low | Max Precipitation | Avg Precipitation | Max Snow | Avg Snow | |
|---|---|---|---|---|---|---|---|---|---|---|---|---|---|
| Record | 40.0 °C | — | -2.8 °C | 32.7 °C | — | -6.6 °C | 29.4 °C | — | -15.6 °C | 315.0 mm | — | 38.0 mm | — |
| January | 31.7 °C | 17.7 °C | -2.8 °C | 23.8 °C | 13.1 °C | -6.6 °C | 19.4 °C | 7.2 °C | -15.6 °C | 73.7 mm | 2.5 mm | 25.0 mm | 0.0 mm |
| February | 32.8 °C | 19.1 °C | -1.7 °C | 24.0 °C | 14.8 °C | -0.8 °C | 20.0 °C | 8.4 °C | -8.3 °C | 116.8 mm | 3.0 mm | 38.0 mm | 0.0 mm |
| March | 35.0 °C | 22.2 °C | 4.4 °C | 25.8 °C | 17.3 °C | 2.1 °C | 23.3 °C | 11.3 °C | -6.1 °C | 161.3 mm | 2.9 mm | 8.0 mm | 0.0 mm |
| April | 34.4 °C | 25.3 °C | 11.7 °C | 28.8 °C | 20.5 °C | 7.9 °C | 25.0 °C | 14.8 °C | 1.7 °C | 94.0 mm | 2.3 mm | 0.0 mm | 0.0 mm |
| May | 38.3 °C | 28.5 °C | 13.3 °C | 30.5 °C | 24.2 °C | 13.7 °C | 28.3 °C | 18.8 °C | 5.6 °C | 138.4 mm | 2.8 mm | 0.0 mm | 0.0 mm |
| June | 40.0 °C | 31.0 °C | 20.0 °C | 31.6 °C | 26.8 °C | 20.4 °C | 28.9 °C | 22.1 °C | 13.9 °C | 163.6 mm | 4.7 mm | 0.0 mm | 0.0 mm |
| July | 39.4 °C | 32.1 °C | 24.4 °C | 32.7 °C | 27.8 °C | 23.7 °C | 29.4 °C | 23.1 °C | 17.2 °C | 184.4 mm | 4.9 mm | 0.0 mm | 0.0 mm |
| August | 38.9 °C | 31.8 °C | 23.9 °C | 31.3 °C | 27.7 °C | 21.4 °C | 28.4 °C | 23.2 °C | 16.0 °C | 225.0 mm | 5.1 mm | 0.0 mm | 0.0 mm |
| September | 38.9 °C | 29.9 °C | 17.8 °C | 31.0 °C | 26.5 °C | 19.0 °C | 27.8 °C | 22.3 °C | 13.9 °C | 315.0 mm | 6.1 mm | 0.0 mm | 0.0 mm |
| October | 35.6 °C | 26.2 °C | 13.3 °C | 29.8 °C | 23.1 °C | 10.3 °C | 28.9 °C | 17.8 °C | 3.9 °C | 174.8 mm | 3.4 mm | 0.0 mm | 0.0 mm |
| November | 33.9 °C | 22.0 °C | 6.1 °C | 26.8 °C | 18.6 °C | 6.1 °C | 25.6 °C | 12.3 °C | -4.4 °C | 156.0 mm | 1.9 mm | 0.0 mm | 0.0 mm |
| December | 29.4 °C | 18.8 °C | -1.7 °C | 24.6 °C | 15.0 °C | -3.6 °C | 23.0 °C | 8.6 °C | -11.1 °C | 97.3 mm | 2.4 mm | 0.0 mm | 0.0 mm |
Data Visualisations
Remove WatermarksCurrent Year Climate Trends vs Historical


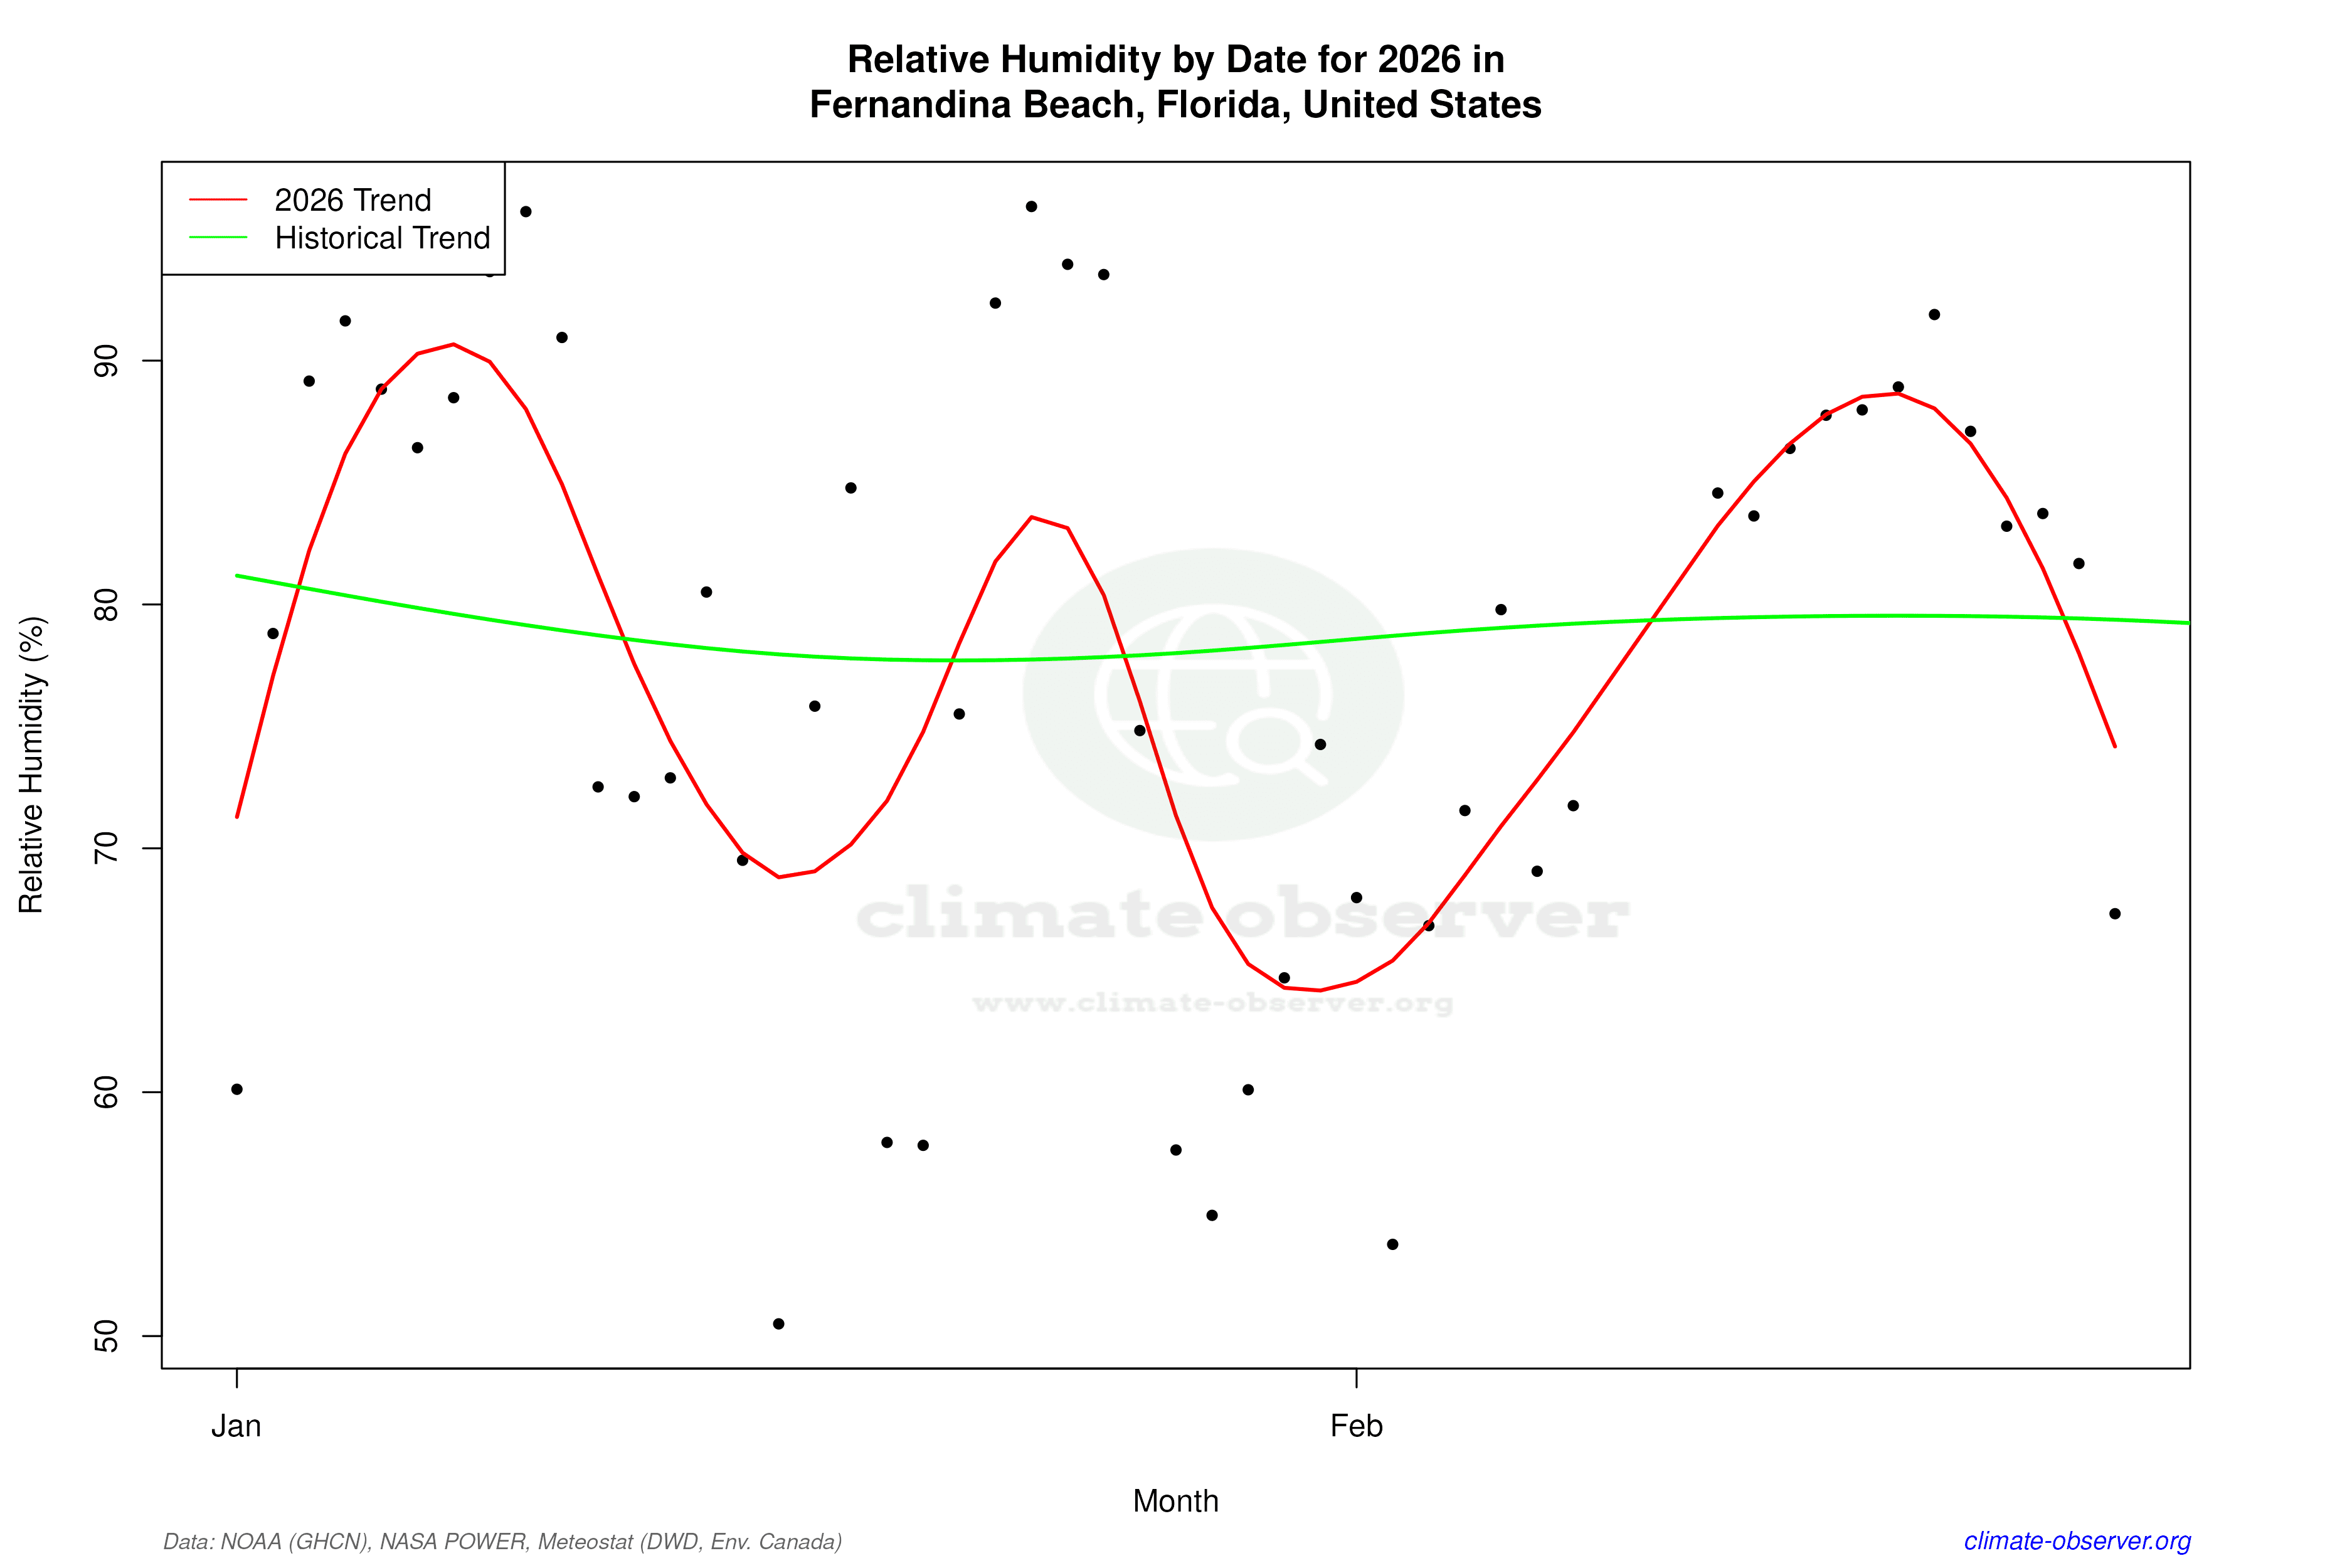

Max Temperature this Year | 1 of 6
Climate 12-Month Moving Averages


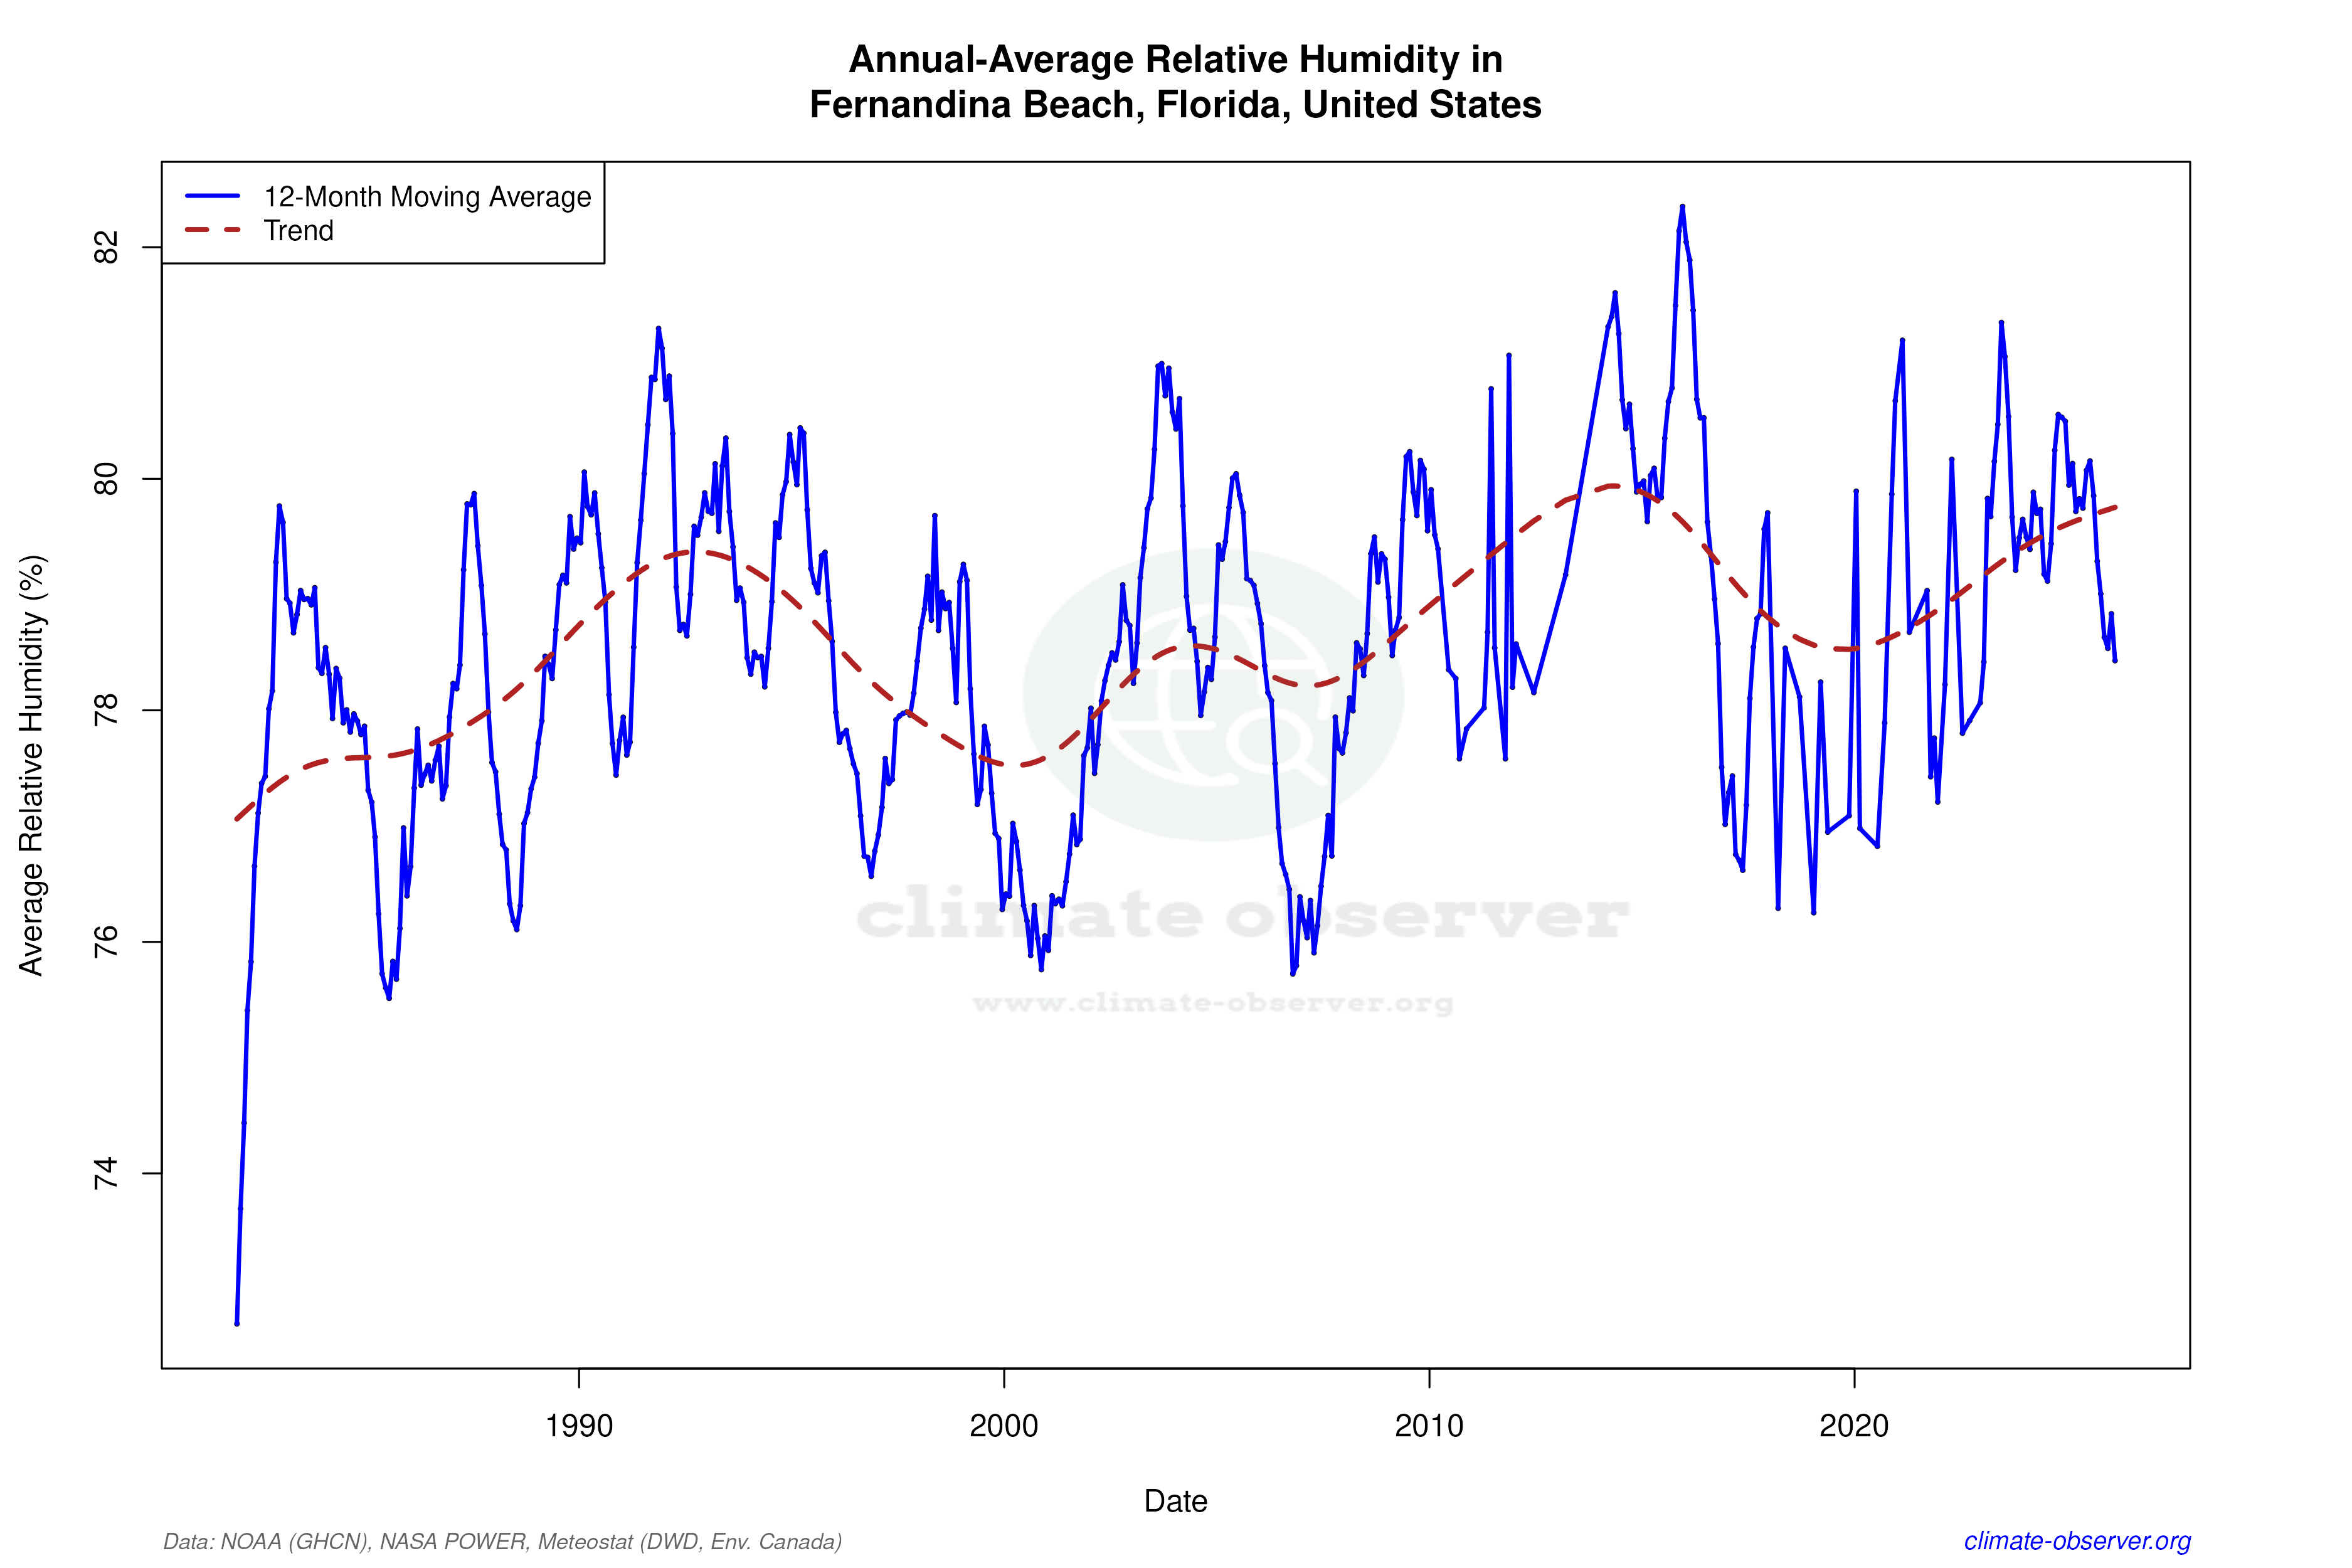

Max Temperature 12-Month MA | 1 of 6
Daily Data Points and Averages Throughout the Year


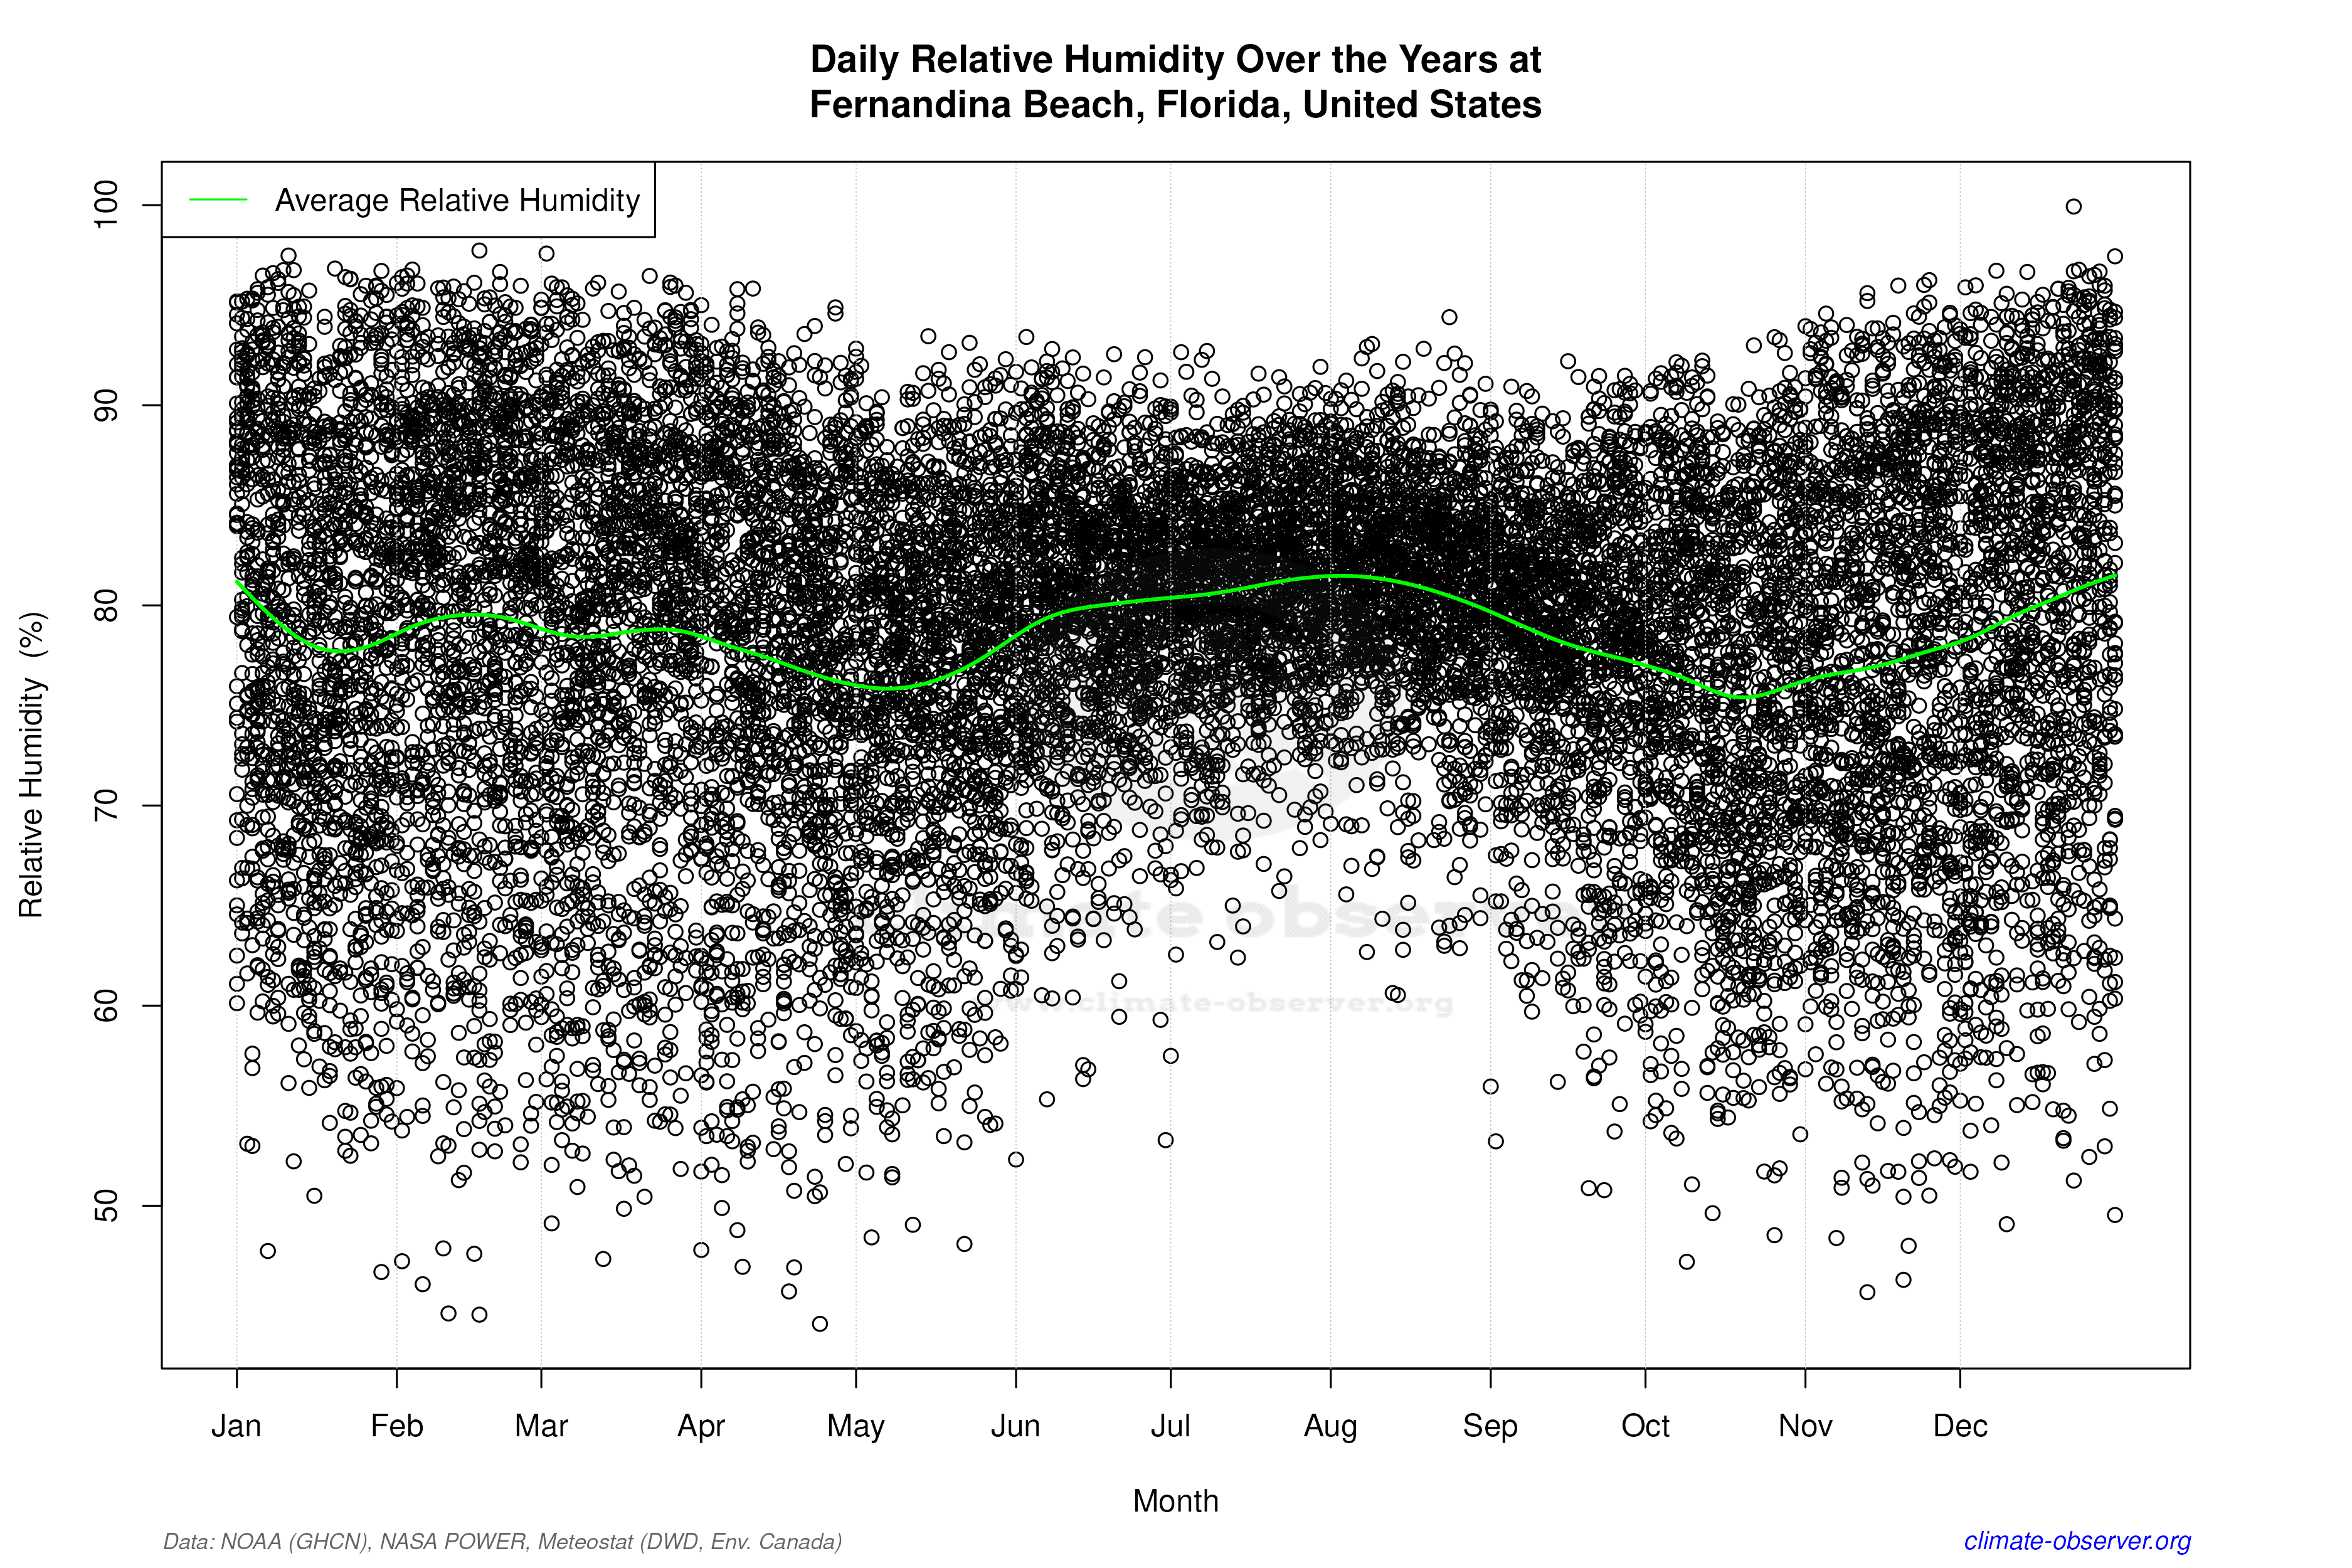

Average Max Temperature Throughout Year | 1 of 5
