Climate for Station: Waynesboro 2 s, Georgia, United States
Loading live weather...
Climate Analysis & Overview
Waynesboro, Georgia, experiences a slight cooling trend with a more concentrated precipitation pattern. Over the past decade, both highs and lows have decreased, reflecting a broader regional cooling. This shift is accompanied by a marginal increase in precipitation concentration, suggesting more intense rainfall events.
Subtropical Climate Dynamics
Waynesboro, located in Burke County, Georgia, falls under the humid subtropical climate classification (Köppen: Cfa). This region typically experiences hot summers and mild winters, influenced by its proximity to the Atlantic Ocean and the Gulf of Mexico. The geographical position allows for significant moisture influx, contributing to its characteristic precipitation patterns.
Cooling Trends: A Closer Look
The all-time temperature trends indicate a slight cooling in Waynesboro. Highs have decreased by 0.01°C (0.02°F), while lows have fallen by 0.07°C (0.13°F). This cooling is more pronounced over the past decade, with highs dropping by 0.94°C (1.69°F) and lows by 0.70°C (1.26°F). These trends suggest a shift towards cooler conditions, which could impact local agriculture and energy demands, aligning with broader cooling patterns observed in parts of the southeastern United States.
Precipitation Patterns: Concentration Increases
The Precipitation Concentration Index (PCI) has risen from a baseline of 11.58 to a current value of 12.22. This marginal increase indicates a slight shift towards more concentrated rainfall events, meaning precipitation is occurring in fewer, more intense storms. Such changes can lead to increased runoff and potential flooding, challenging local water management strategies.
Temperature Extremes: Record Observations
Waynesboro's climate is marked by notable temperature extremes. The record high stands at 43.3°C (109.9°F), while the record low is -18.3°C (-0.9°F). These extremes highlight the variability inherent in the region's climate, which can pose challenges for infrastructure and health systems during severe weather events.
Regional Implications and Climate Goals
The observed cooling trend and increased precipitation concentration in Waynesboro have implications for regional climate adaptation strategies. As the United States aims to mitigate climate change impacts, understanding localised trends is crucial for developing effective policies. Recent weather events, such as hurricanes and heatwaves, underscore the need for resilience in the face of evolving climate dynamics.
Station Statistics
10-Year Trend
High: -0.96 °C/decade
Low: -0.70 °C/decade
Rain: -0.26 mm/decade
25-Year Trend
High: +0.42 °C/decade
Low: +0.29 °C/decade
Rain: +0.22 mm/decade
50-Year Trend
High: +0.24 °C/decade
Low: +0.54 °C/decade
Rain: +0.01 mm/decade
All-Time Trend
High: -0.01 °C/decade
Low: -0.07 °C/decade
Rain: +0.01 mm/decade
Percentage Above-Average Days
Last 12 Months: 60.0%
This Year: 42.5%
Precipitation Concentration Index (PCI) ℹ️
Last 12 Months: 12.0
Historical Average: 12.7
Percentile Rank of Last 12 Months ℹ️
High: 68th percentile
Low: 67th percentile
Rain: 27th percentile
Change in Variance ℹ️
High: -16.8%
Low: -0.6%
Intraday: -2.7%
Data Coverage
86.0%
First Year of Data
1891
Station Location
Historical Weather Records
| Max High | Avg High | Min High | Max Avg | Avg Avg | Min Avg | Max Low | Avg Low | Min Low | Max Precipitation | Avg Precipitation | Max Snow | Avg Snow | |
|---|---|---|---|---|---|---|---|---|---|---|---|---|---|
| Record | 43.3 °C | — | -6.7 °C | 33.3 °C | — | -10.8 °C | 31.7 °C | — | -18.3 °C | 154.7 mm | — | 406.0 mm | — |
| January | 28.9 °C | 14.5 °C | -6.7 °C | 23.3 °C | 7.6 °C | -10.8 °C | 20.6 °C | 1.4 °C | -18.3 °C | 83.8 mm | 3.0 mm | 127.0 mm | 0.3 mm |
| February | 40.6 °C | 16.4 °C | -2.2 °C | 23.5 °C | 9.7 °C | -5.2 °C | 21.1 °C | 2.6 °C | -12.8 °C | 91.4 mm | 3.7 mm | 406.0 mm | 0.6 mm |
| March | 35.0 °C | 20.6 °C | -1.7 °C | 24.5 °C | 13.7 °C | -4.7 °C | 20.0 °C | 6.4 °C | -8.3 °C | 130.8 mm | 3.6 mm | 0.0 mm | 0.0 mm |
| April | 36.7 °C | 24.9 °C | 7.2 °C | 26.9 °C | 17.5 °C | 5.9 °C | 22.2 °C | 10.2 °C | -6.7 °C | 80.3 mm | 2.7 mm | 0.0 mm | 0.0 mm |
| May | 40.0 °C | 28.9 °C | 12.8 °C | 30.0 °C | 21.9 °C | 9.4 °C | 31.7 °C | 15.0 °C | 1.1 °C | 89.7 mm | 2.8 mm | 0.0 mm | 0.0 mm |
| June | 42.8 °C | 32.0 °C | 16.1 °C | 32.2 °C | 25.6 °C | 16.0 °C | 27.2 °C | 19.1 °C | 6.7 °C | 119.4 mm | 3.9 mm | 0.0 mm | 0.0 mm |
| July | 42.2 °C | 33.1 °C | 20.6 °C | 32.9 °C | 27.1 °C | 18.9 °C | 27.2 °C | 20.9 °C | 12.2 °C | 129.5 mm | 4.1 mm | 0.0 mm | 0.0 mm |
| August | 41.7 °C | 32.5 °C | 18.9 °C | 33.3 °C | 26.3 °C | 16.3 °C | 29.4 °C | 20.5 °C | 9.4 °C | 117.3 mm | 4.0 mm | 0.0 mm | 0.0 mm |
| September | 43.3 °C | 30.0 °C | 14.4 °C | 29.9 °C | 23.4 °C | 12.7 °C | 25.0 °C | 17.4 °C | 1.1 °C | 154.7 mm | 2.9 mm | 0.0 mm | 0.0 mm |
| October | 38.3 °C | 25.3 °C | 11.1 °C | 28.0 °C | 17.7 °C | 5.3 °C | 25.0 °C | 10.9 °C | -5.0 °C | 106.0 mm | 2.0 mm | 0.0 mm | 0.0 mm |
| November | 32.2 °C | 20.2 °C | -4.4 °C | 25.0 °C | 12.6 °C | -6.5 °C | 21.7 °C | 5.3 °C | -11.7 °C | 66.8 mm | 2.2 mm | 25.0 mm | 0.0 mm |
| December | 28.3 °C | 15.4 °C | -6.7 °C | 22.5 °C | 8.8 °C | -9.7 °C | 20.0 °C | 2.1 °C | -15.0 °C | 148.6 mm | 3.1 mm | 102.0 mm | 0.1 mm |
Data Visualisations
Remove WatermarksCurrent Year Climate Trends vs Historical


Max Temperature this Year | 1 of 6
Climate 12-Month Moving Averages
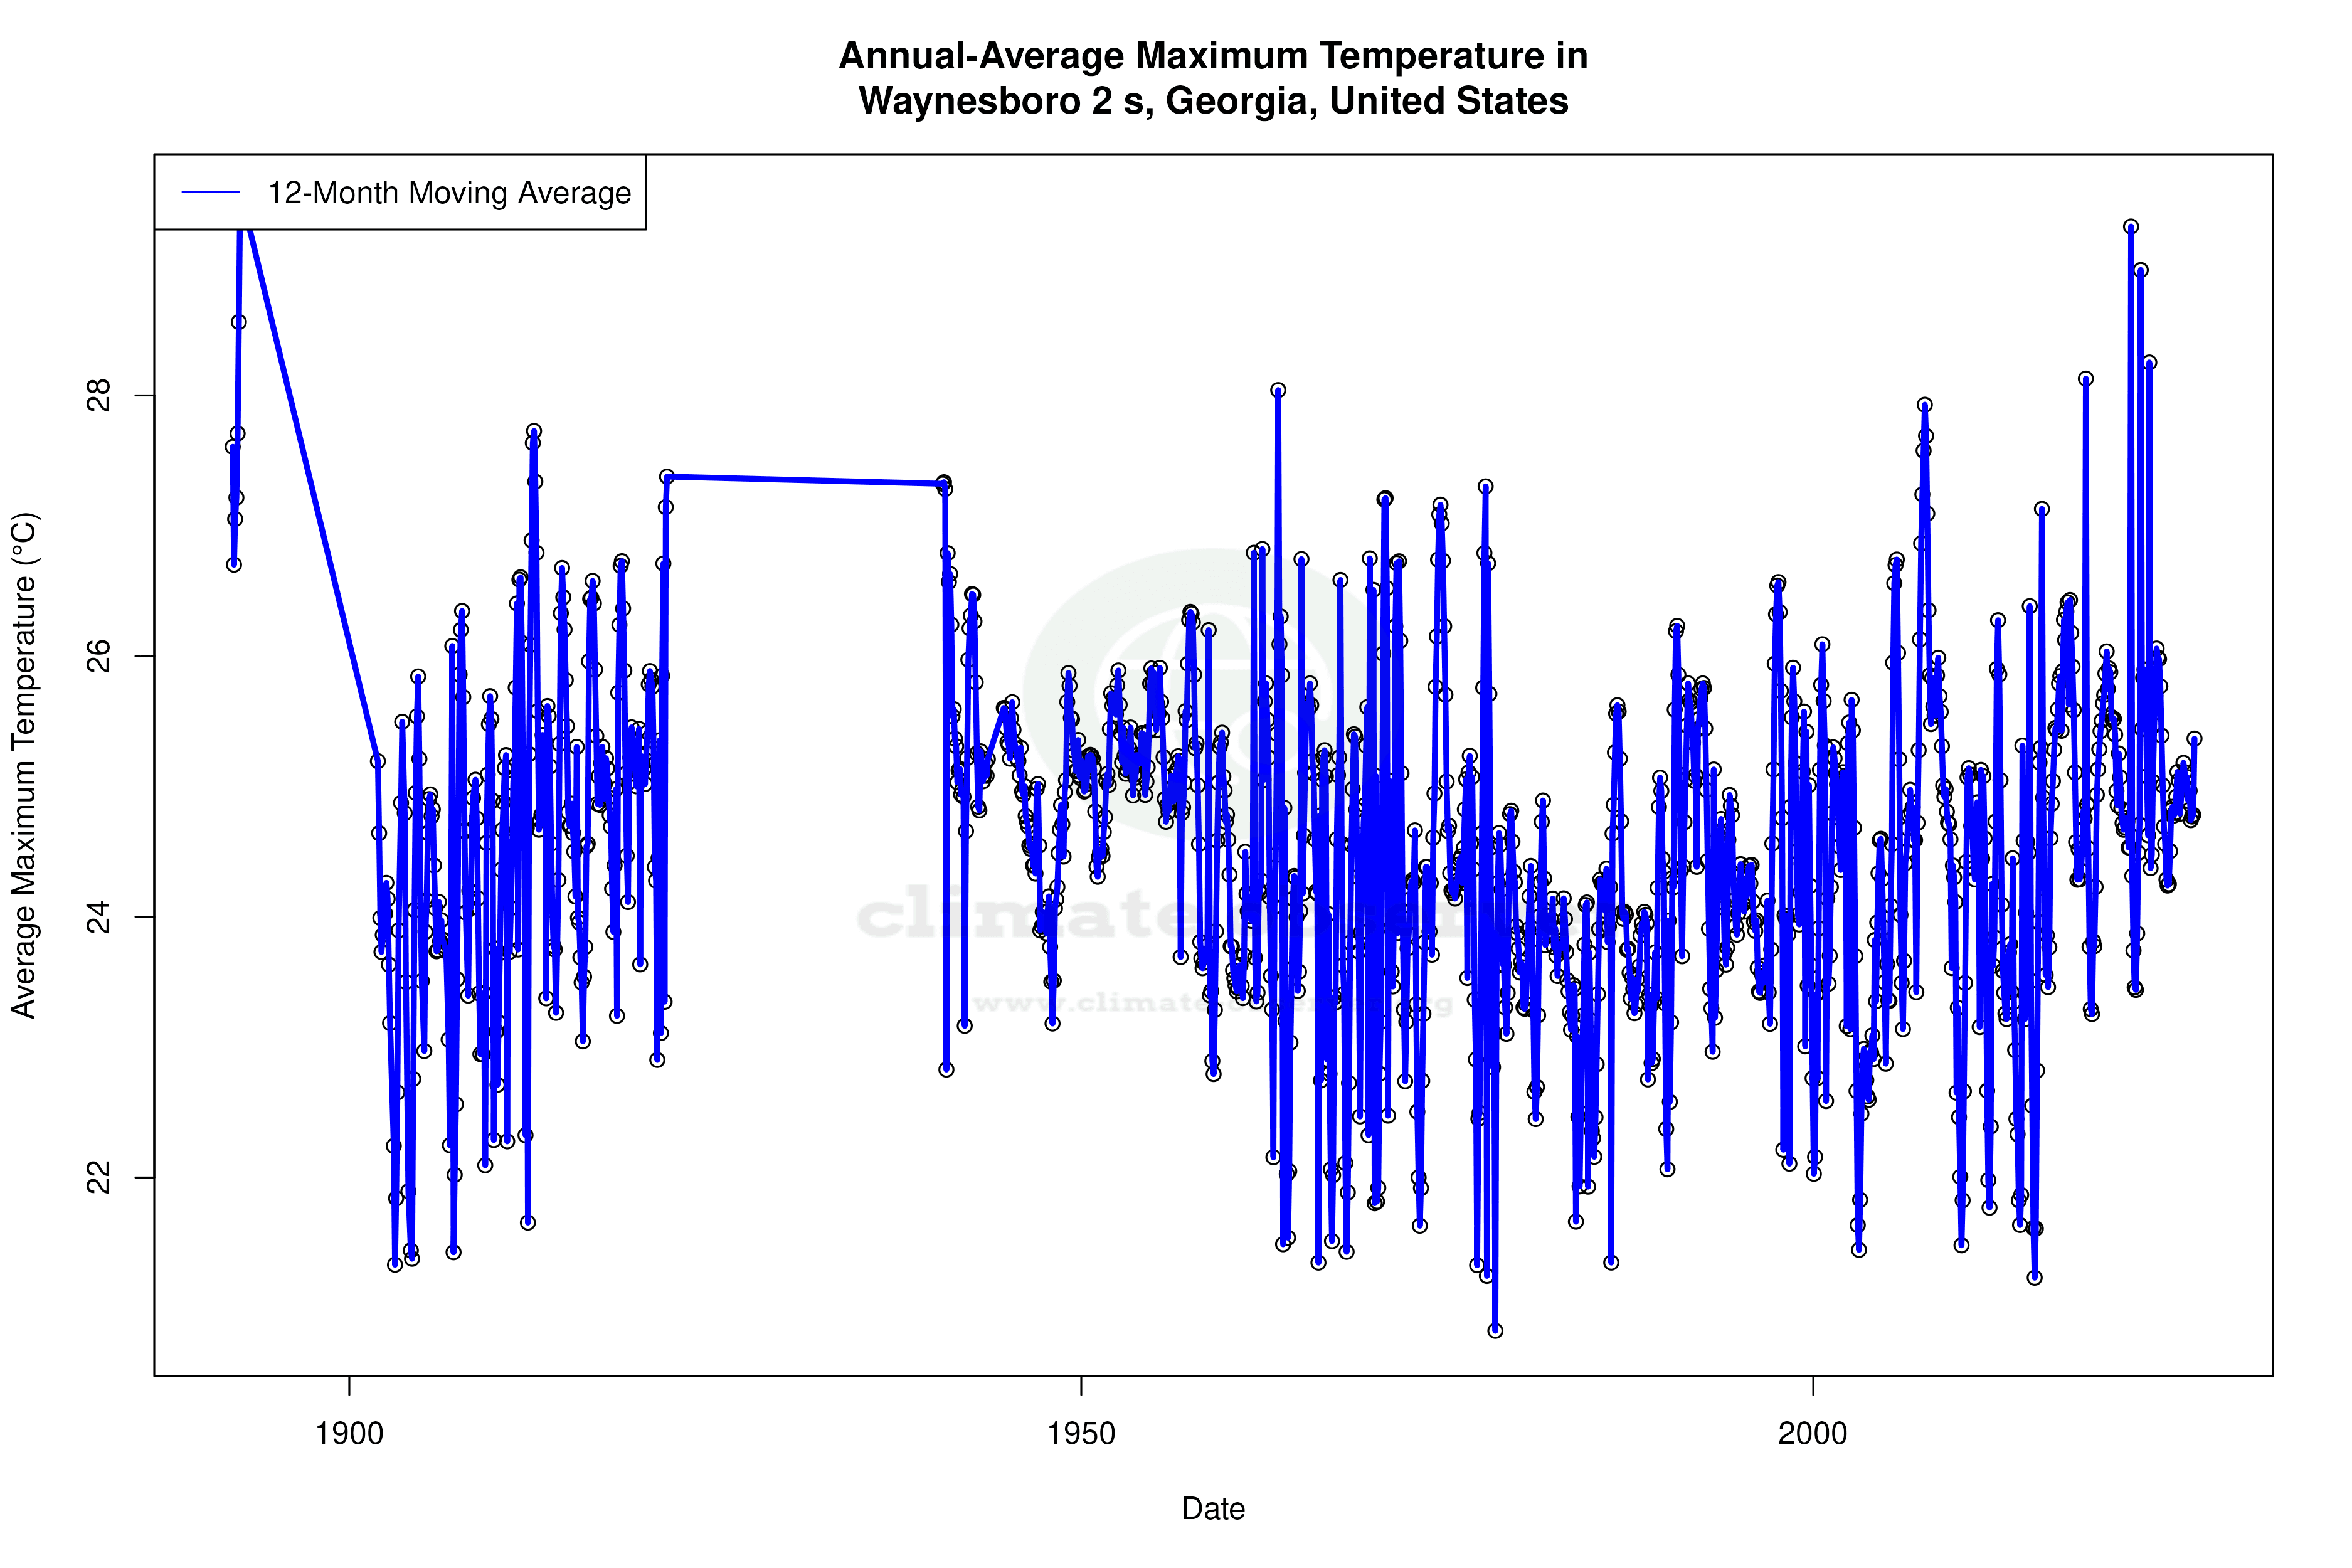


Max Temperature 12-Month MA | 1 of 6
Daily Data Points and Averages Throughout the Year


Average Max Temperature Throughout Year | 1 of 5
