Climate for Station: Ann Arbor u of Mich, Michigan, United States
Loading live weather...
Climate Analysis & Overview
Ann Arbor's climate is experiencing a mixed trend with a 0.14°C (0.25°F) all-time rise in high temperatures and a 0.12°C (0.22°F) rise in lows, indicating a warming pattern. However, recent data shows a 0.55°C (0.99°F) increase in highs and a notable 1.19°C (2.14°F) decrease in lows over the past decade, suggesting a complex local climate dynamic. The Precipitation Concentration Index has decreased, indicating more evenly distributed rainfall.
Moderate Continental Climate
Ann Arbor, located in southeastern Michigan, falls under the humid continental climate classification (Köppen Dfa), characterized by cold winters and warm summers. The city's proximity to the Great Lakes influences its weather patterns, often moderating temperatures and contributing to precipitation. The all-time data reveals a slight warming trend with high temperatures rising by 0.14°C (0.25°F) and lows by 0.12°C (0.22°F), suggesting a gradual increase in baseline temperatures over the years.
Recent Temperature Fluctuations
In the past decade, Ann Arbor has experienced a 0.55°C (0.99°F) increase in high temperatures, reflecting a warming trend that aligns with broader regional climate patterns. However, the lows have shown a cooling trend, dropping by 1.19°C (2.14°F). This divergence between highs and lows may indicate increased variability in daily temperatures, possibly linked to changes in atmospheric circulation or local factors such as urban heat effects.
Record Extremes and Variability
Ann Arbor's historical temperature records highlight the region's potential for extreme weather. The highest recorded temperature is 40.6°C (105.1°F), while the lowest is -30.0°C (-22.0°F). These extremes underscore the significant seasonal variability typical of a continental climate. Such variability can pose challenges for local ecosystems and infrastructure, requiring adaptive strategies to mitigate potential impacts.
Precipitation Patterns and Distribution
The Precipitation Concentration Index (PCI) for Ann Arbor has decreased from a baseline of 11.6 to 10.0, indicating a shift towards more evenly distributed rainfall events. This change suggests a reduction in the intensity of individual precipitation events, which can be beneficial for reducing flood risk and improving water management. A PCI below 10 is considered very even, highlighting a positive trend for local agriculture and water resources.
Regional Climate Goals and Implications
The United States has set ambitious climate goals, focusing on reducing greenhouse gas emissions and enhancing resilience to climate change. Ann Arbor's mixed temperature trends and more evenly distributed precipitation align with these goals by potentially reducing the frequency of extreme weather events. However, the cooling trend in lows over the past decade may require further investigation to understand its implications for local climate adaptation strategies.
Station Statistics
10-Year Trend
High: +0.28 °C/decade
Low: -1.40 °C/decade
Rain: -0.21 mm/decade
25-Year Trend
High: +0.43 °C/decade
Low: -0.33 °C/decade
Rain: -0.02 mm/decade
50-Year Trend
High: +0.36 °C/decade
Low: +0.16 °C/decade
Rain: -0.02 mm/decade
All-Time Trend
High: +0.14 °C/decade
Low: +0.12 °C/decade
Rain: +0.01 mm/decade
Percentage Above-Average Days
Last 12 Months: 55.9%
This Year: 62.5%
Precipitation Concentration Index (PCI) ℹ️
Last 12 Months: 9.8
Historical Average: 11.7
Percentile Rank of Last 12 Months ℹ️
High: 92nd percentile
Low: 48th percentile
Rain: 46th percentile
Change in Variance ℹ️
High: -6.5%
Low: -8.2%
Intraday: +49.6%
Data Coverage
83.6%
First Year of Data
1933
Station Location
Historical Weather Records
| Max High | Avg High | Min High | Max Avg | Avg Avg | Min Avg | Max Low | Avg Low | Min Low | Max Precipitation | Avg Precipitation | Max Snow | Avg Snow | |
|---|---|---|---|---|---|---|---|---|---|---|---|---|---|
| Record | 40.6 °C | — | -20.6 °C | 31.9 °C | — | -22.7 °C | 27.2 °C | — | -30.0 °C | 100.1 mm | — | 1524.0 mm | — |
| January | 22.2 °C | -0.4 °C | -20.6 °C | 14.1 °C | -4.9 °C | -22.7 °C | 11.7 °C | -8.2 °C | -30.0 °C | 49.6 mm | 1.6 mm | 356.0 mm | 9.6 mm |
| February | 22.8 °C | 0.8 °C | -19.4 °C | 14.3 °C | -3.7 °C | -20.2 °C | 11.7 °C | -7.9 °C | -29.4 °C | 64.8 mm | 1.6 mm | 279.0 mm | 9.4 mm |
| March | 29.4 °C | 7.0 °C | -12.8 °C | 19.4 °C | 1.9 °C | -15.9 °C | 16.7 °C | -3.1 °C | -22.2 °C | 59.7 mm | 1.9 mm | 1524.0 mm | 5.9 mm |
| April | 31.1 °C | 14.5 °C | -3.9 °C | 23.6 °C | 8.1 °C | -6.7 °C | 19.4 °C | 2.7 °C | -13.9 °C | 59.7 mm | 2.6 mm | 196.0 mm | 1.6 mm |
| May | 35.0 °C | 21.1 °C | 2.2 °C | 27.1 °C | 14.5 °C | 3.2 °C | 23.3 °C | 8.7 °C | -6.7 °C | 65.8 mm | 2.8 mm | 89.0 mm | 0.1 mm |
| June | 39.4 °C | 26.3 °C | 7.8 °C | 29.0 °C | 19.7 °C | 9.5 °C | 26.7 °C | 14.0 °C | 1.7 °C | 83.6 mm | 2.9 mm | 0.0 mm | 0.0 mm |
| July | 40.6 °C | 28.6 °C | 16.1 °C | 31.9 °C | 22.2 °C | 13.8 °C | 27.2 °C | 16.5 °C | 5.0 °C | 72.4 mm | 2.5 mm | 0.0 mm | 0.0 mm |
| August | 40.0 °C | 27.4 °C | 15.6 °C | 29.6 °C | 21.2 °C | 11.2 °C | 26.7 °C | 15.6 °C | 3.9 °C | 94.7 mm | 2.3 mm | 0.0 mm | 0.0 mm |
| September | 37.2 °C | 23.6 °C | 6.1 °C | 27.5 °C | 17.0 °C | 5.5 °C | 25.6 °C | 11.8 °C | -2.8 °C | 100.1 mm | 2.5 mm | 0.0 mm | 0.0 mm |
| October | 32.8 °C | 16.7 °C | 0.0 °C | 23.2 °C | 10.1 °C | -1.2 °C | 19.4 °C | 5.8 °C | -7.2 °C | 72.4 mm | 2.1 mm | 61.0 mm | 0.1 mm |
| November | 25.6 °C | 8.5 °C | -8.9 °C | 21.0 °C | 3.7 °C | -11.3 °C | 16.1 °C | -0.0 °C | -19.4 °C | 58.2 mm | 2.1 mm | 381.0 mm | 3.3 mm |
| December | 19.4 °C | 1.7 °C | -15.0 °C | 16.5 °C | -1.9 °C | -19.2 °C | 15.6 °C | -5.5 °C | -28.9 °C | 54.6 mm | 1.8 mm | 401.0 mm | 7.8 mm |
Data Visualisations
Remove WatermarksCurrent Year Climate Trends vs Historical


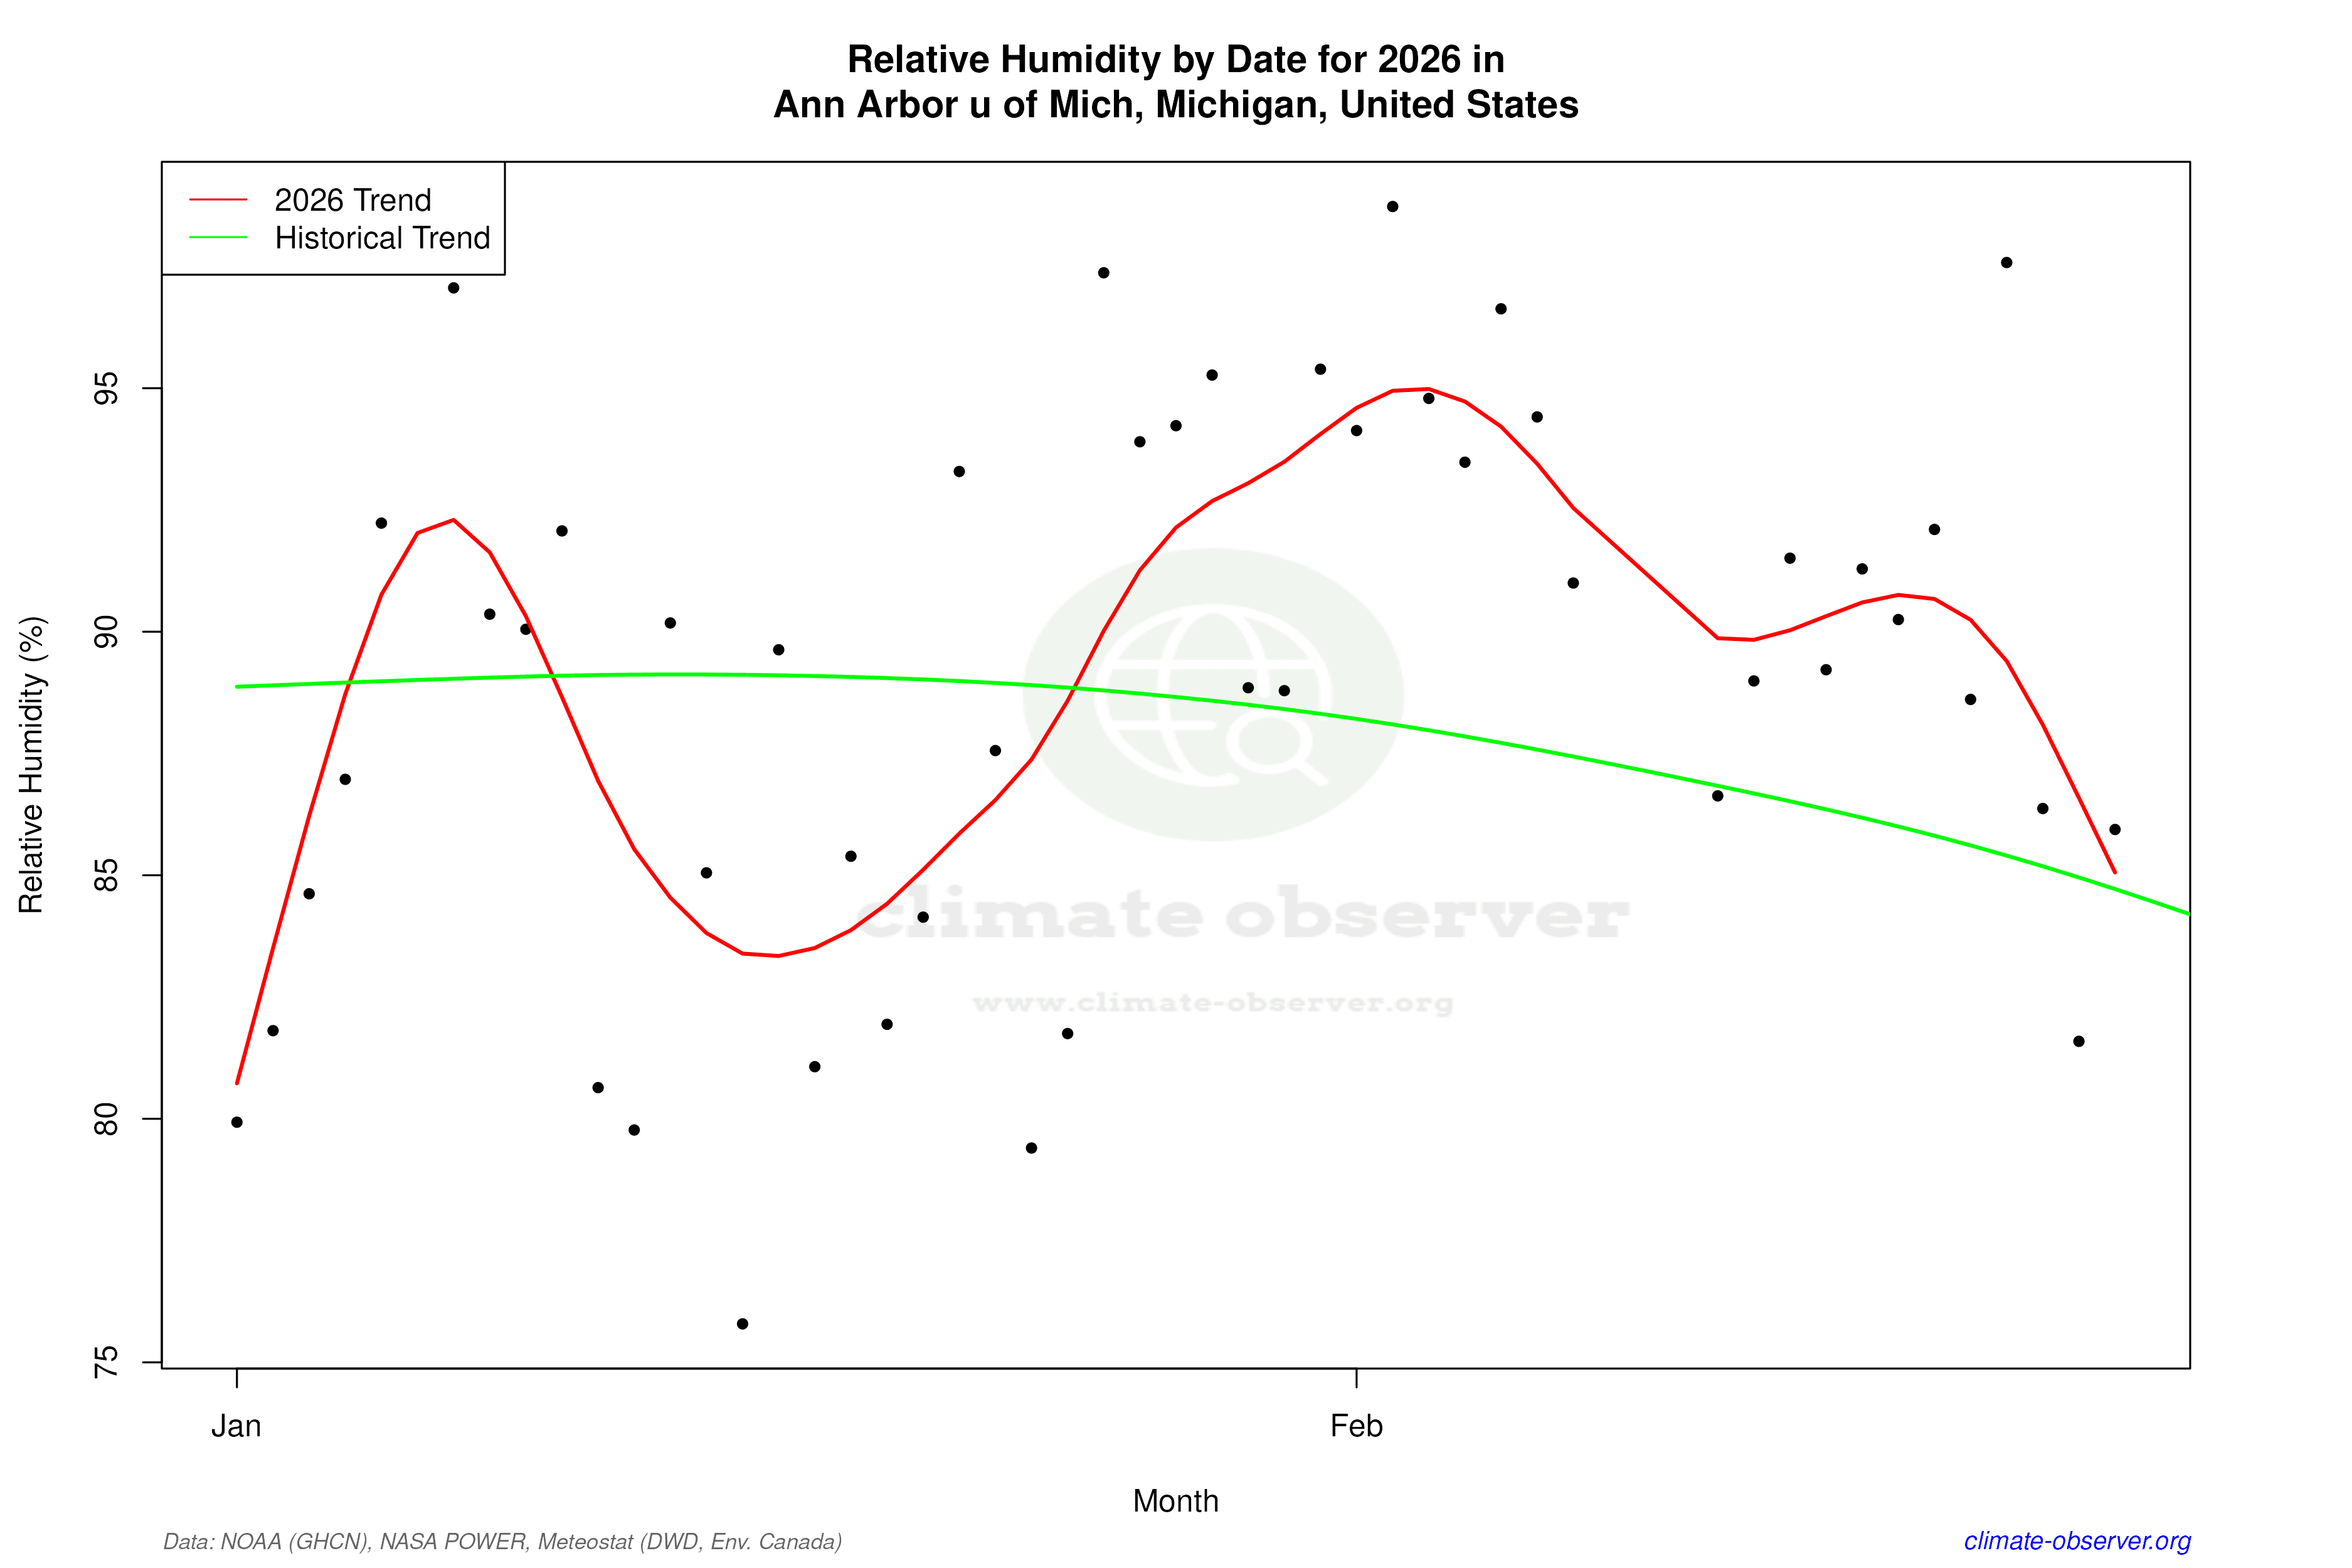

Max Temperature this Year | 1 of 6
Climate 12-Month Moving Averages


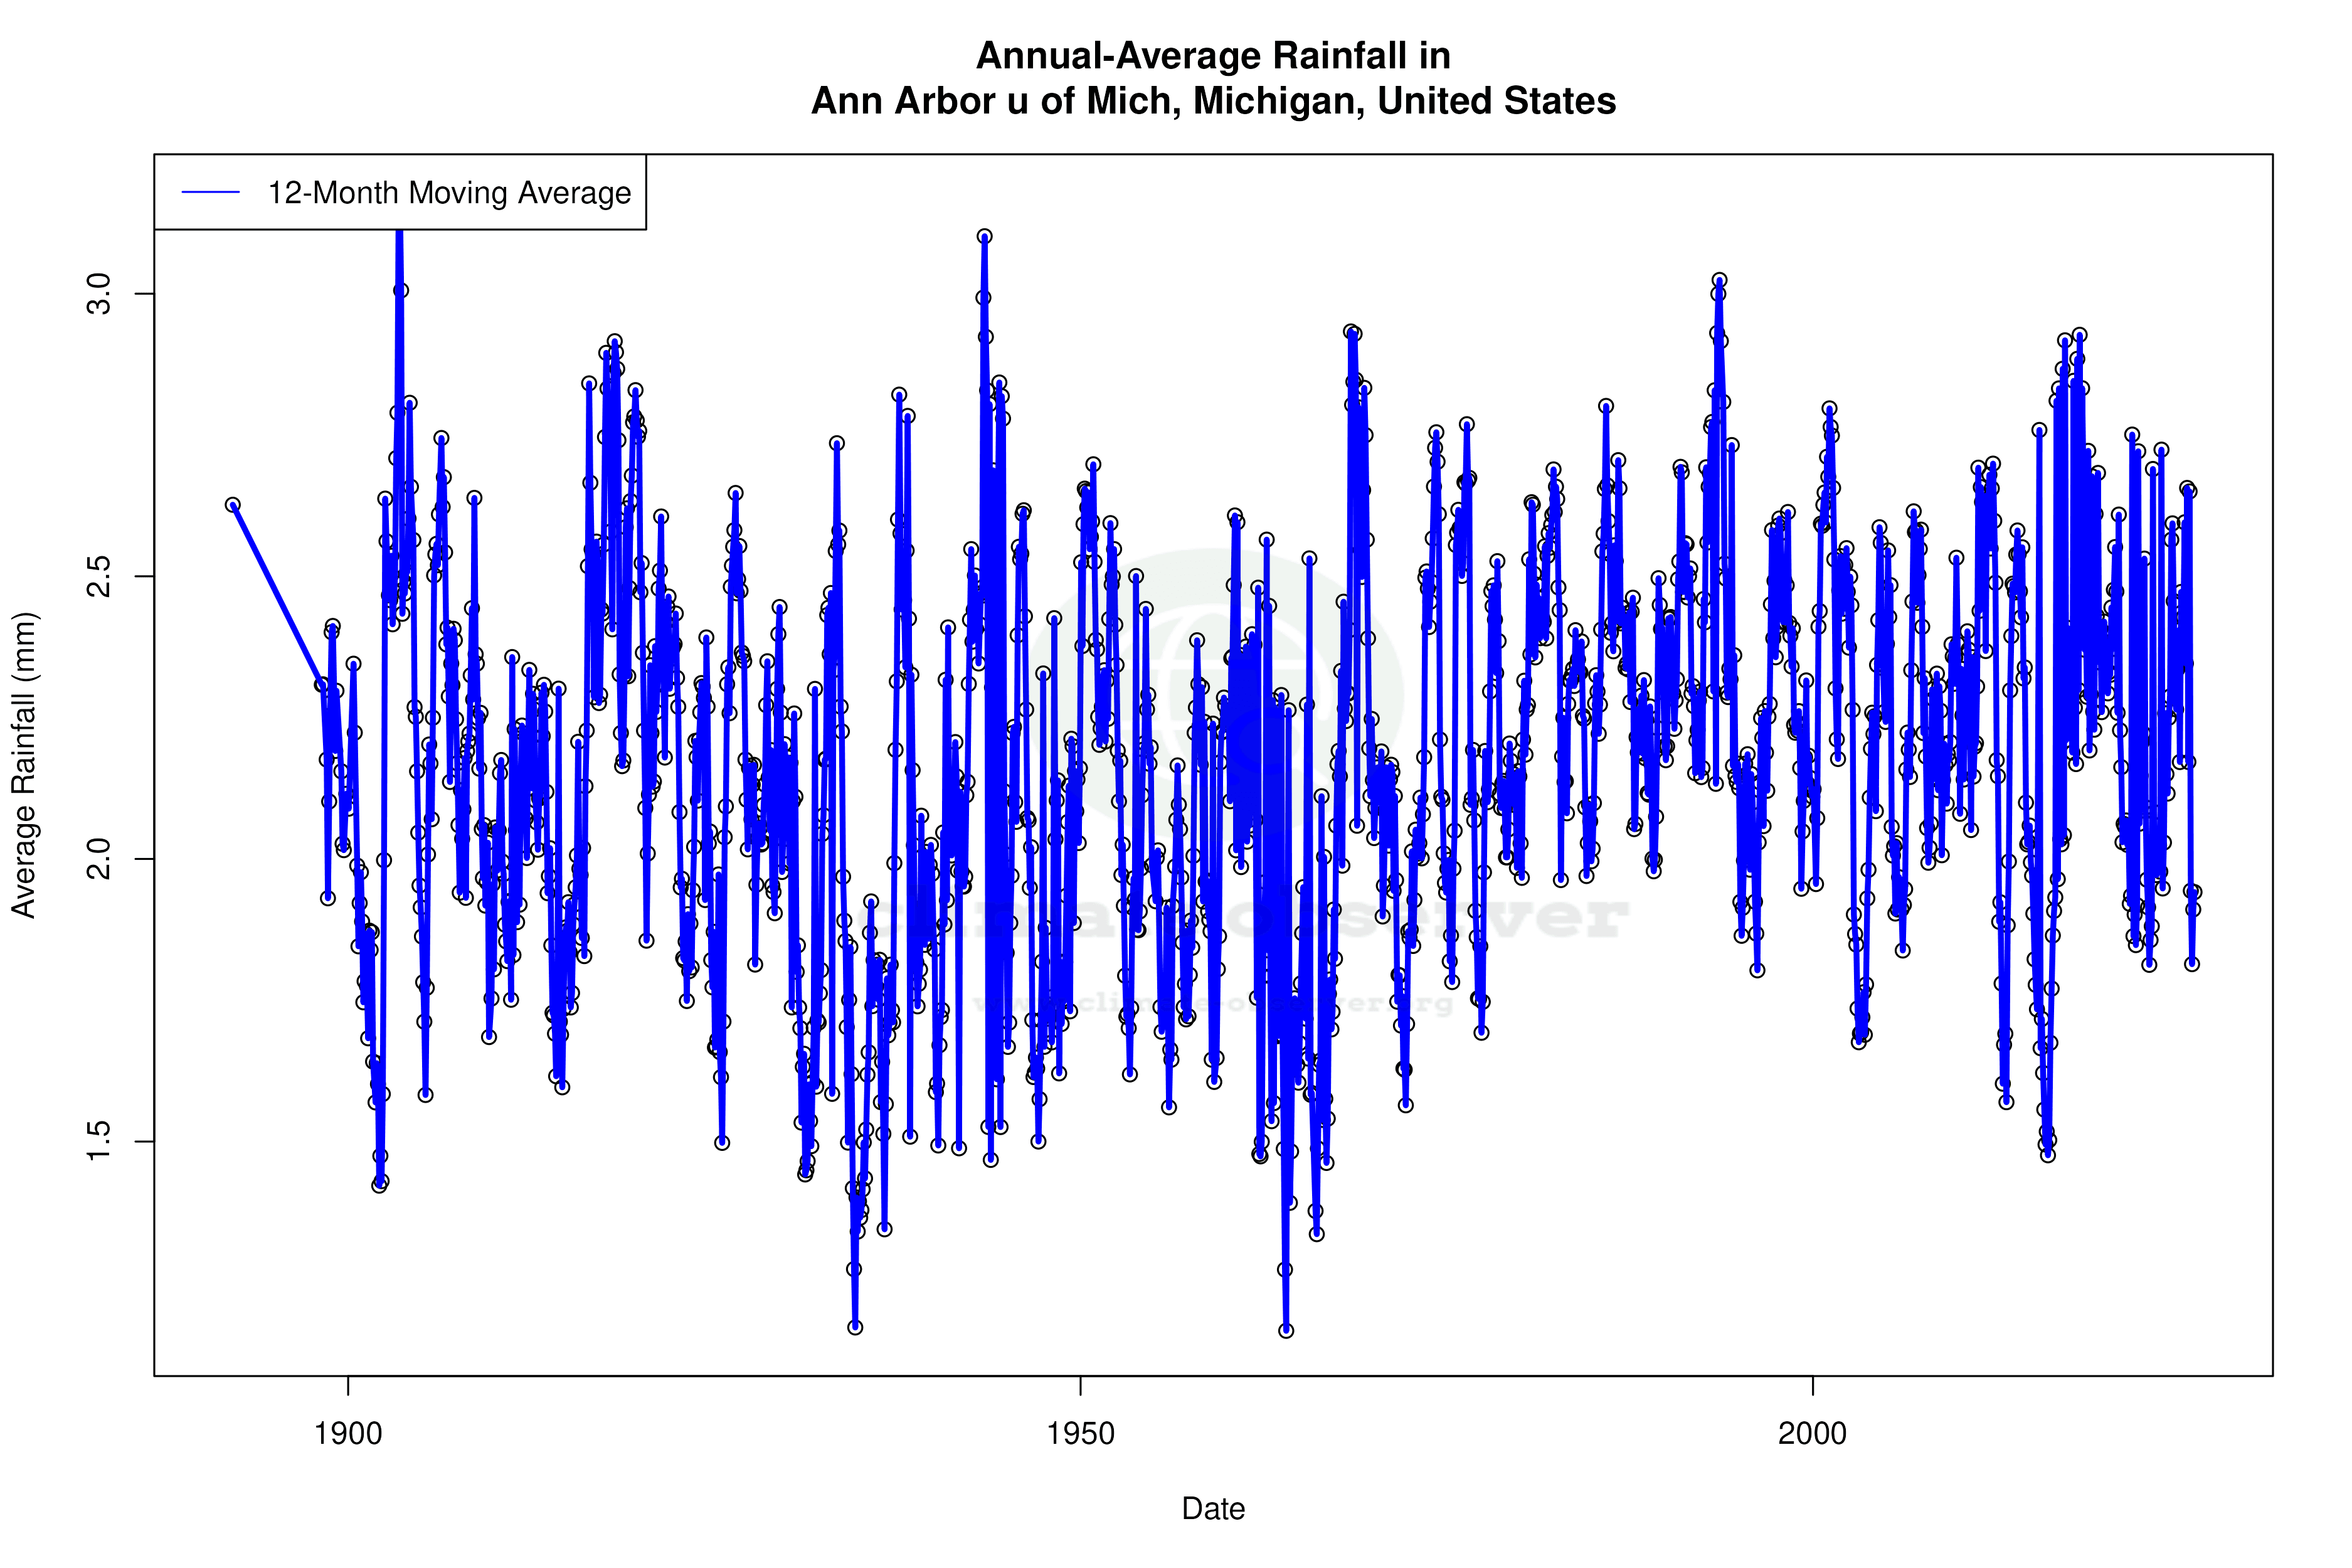


Max Temperature 12-Month MA | 1 of 6
Daily Data Points and Averages Throughout the Year


Average Max Temperature Throughout Year | 1 of 5
