Climate for Station: Central City, Nebraska, United States
Loading live weather...
Climate Analysis & Overview
Central City, Nebraska, is experiencing a nuanced climate evolution. Over the last decade, temperatures have cooled, while all-time data shows a slight warming trend. Precipitation events have become marginally more concentrated, suggesting changes in local weather patterns.
Subtle Shifts in Temperature Trends
Central City, located at 41.1269, -98.0222, falls under the Köppen climate classification of Dfa, indicating a humid continental climate with hot summers and no dry season. The past decade has seen a cooling trend, with high temperatures decreasing by 1.46°C (2.63°F) and low temperatures dropping by 2.88°C (5.18°F). This contrasts with the all-time trends, where high temperatures have shown a slight warming of 0.06°C (0.11°F) and lows a marginal rise of 0.06°C (0.10°F). These figures suggest that while recent years have been cooler, the long-term trajectory is towards a modest warming.
Precipitation Patterns: A Marginal Concentration
The Precipitation Concentration Index (PCI) for Central City has increased from a baseline of 15.08 to 15.85. The PCI measures how precipitation is distributed over time; a higher value indicates precipitation is concentrated in fewer, more intense events. This marginal increase suggests that while precipitation is not yet highly concentrated, there is a trend towards more intense rainfall events, which could impact agriculture and water management in the region.
Record Extremes: A Tale of Temperature Extremes
Central City has experienced record temperatures that highlight its climatic extremes. The highest recorded temperature is 46.7°C (116.1°F), while the lowest is -33.3°C (-27.9°F). These extremes are indicative of the region's continental climate, which is characterised by significant temperature variations between seasons.
Regional Climate Context and Implications
The subtle shifts in Central City's climate are occurring against a backdrop of national climate objectives aimed at reducing greenhouse gas emissions and enhancing climate resilience. Recent weather events in the United States, such as increased frequency of heatwaves and heavy rainfalls, underscore the importance of understanding local climate dynamics. The slight cooling trend observed over the past decade may provide temporary relief from heat-related stress, but the long-term warming trend necessitates continued adaptation and mitigation efforts.
Geographical Influences on Climate Trends
Central City's climate is influenced by its geographical setting in the Great Plains, which is characterised by flat terrain and a lack of significant geographical barriers. This allows for the free movement of air masses, contributing to the region's temperature variability and precipitation patterns. The area's climate is further shaped by its distance from large bodies of water, which results in less moderated temperatures compared to coastal regions.
Station Statistics
10-Year Trend
High: +1.75 °C/decade
Low: -0.50 °C/decade
Rain: -0.70 mm/decade
25-Year Trend
High: -0.06 °C/decade
Low: -0.38 °C/decade
Rain: -0.01 mm/decade
50-Year Trend
High: +0.17 °C/decade
Low: +0.01 °C/decade
Rain: -0.01 mm/decade
All-Time Trend
High: +0.07 °C/decade
Low: +0.07 °C/decade
Rain: +0.03 mm/decade
Percentage Above-Average Days
Last 12 Months: 60.8%
This Year: 65.1%
Precipitation Concentration Index (PCI) ℹ️
Last 12 Months: 14.9
Historical Average: 15.0
Percentile Rank of Last 12 Months ℹ️
High: 80th percentile
Low: 52nd percentile
Rain: 23rd percentile
Change in Variance ℹ️
High: -5.8%
Low: -3.4%
Intraday: +3.9%
Data Coverage
88.8%
First Year of Data
1878
Station Location
Historical Weather Records
| Max High | Avg High | Min High | Max Avg | Avg Avg | Min Avg | Max Low | Avg Low | Min Low | Max Precipitation | Avg Precipitation | Max Snow | Avg Snow | |
|---|---|---|---|---|---|---|---|---|---|---|---|---|---|
| Record | 46.7 °C | — | -23.9 °C | 33.6 °C | — | -26.9 °C | 30.0 °C | — | -33.3 °C | 106.2 mm | — | 378.0 mm | — |
| January | 23.3 °C | 1.7 °C | -23.3 °C | 10.0 °C | -4.3 °C | -25.7 °C | 10.0 °C | -10.1 °C | -33.3 °C | 21.0 mm | 0.4 mm | 305.0 mm | 4.5 mm |
| February | 27.8 °C | 4.4 °C | -22.8 °C | 14.4 °C | -2.1 °C | -26.3 °C | 11.1 °C | -7.8 °C | -32.7 °C | 43.2 mm | 0.6 mm | 315.0 mm | 5.2 mm |
| March | 33.0 °C | 10.6 °C | -15.6 °C | 23.1 °C | 4.2 °C | -18.3 °C | 18.3 °C | -2.4 °C | -30.6 °C | 73.2 mm | 1.2 mm | 378.0 mm | 4.3 mm |
| April | 35.0 °C | 18.0 °C | -8.3 °C | 26.1 °C | 10.3 °C | -8.7 °C | 19.4 °C | 3.9 °C | -17.2 °C | 67.8 mm | 2.0 mm | 183.0 mm | 1.0 mm |
| May | 40.6 °C | 23.5 °C | 2.8 °C | 29.5 °C | 16.4 °C | 3.3 °C | 23.3 °C | 10.2 °C | -4.4 °C | 88.0 mm | 3.3 mm | 168.0 mm | 0.1 mm |
| June | 42.2 °C | 29.1 °C | 8.3 °C | 32.3 °C | 22.4 °C | 7.8 °C | 25.6 °C | 15.8 °C | -0.6 °C | 106.2 mm | 3.3 mm | 0.0 mm | 0.0 mm |
| July | 46.7 °C | 31.6 °C | 16.1 °C | 33.6 °C | 24.7 °C | 14.3 °C | 30.0 °C | 18.5 °C | 6.1 °C | 85.1 mm | 2.4 mm | 0.0 mm | 0.0 mm |
| August | 45.0 °C | 30.4 °C | 14.4 °C | 33.6 °C | 23.2 °C | 13.3 °C | 27.8 °C | 17.5 °C | 3.9 °C | 86.9 mm | 2.2 mm | 0.0 mm | 0.0 mm |
| September | 41.7 °C | 26.2 °C | 3.9 °C | 30.2 °C | 18.6 °C | 1.9 °C | 26.1 °C | 12.2 °C | -4.4 °C | 63.5 mm | 1.9 mm | 30.0 mm | 0.0 mm |
| October | 36.1 °C | 19.8 °C | -5.6 °C | 27.0 °C | 11.3 °C | -6.6 °C | 22.8 °C | 5.2 °C | -12.8 °C | 45.3 mm | 1.1 mm | 203.0 mm | 0.3 mm |
| November | 29.4 °C | 10.6 °C | -11.7 °C | 20.6 °C | 3.5 °C | -17.8 °C | 18.3 °C | -2.3 °C | -23.9 °C | 44.5 mm | 0.8 mm | 305.0 mm | 2.3 mm |
| December | 27.8 °C | 3.6 °C | -23.9 °C | 14.4 °C | -2.5 °C | -26.9 °C | 9.4 °C | -7.7 °C | -32.2 °C | 36.1 mm | 0.5 mm | 310.0 mm | 4.4 mm |
Data Visualisations
Remove WatermarksCurrent Year Climate Trends vs Historical


Max Temperature this Year | 1 of 6
Climate 12-Month Moving Averages
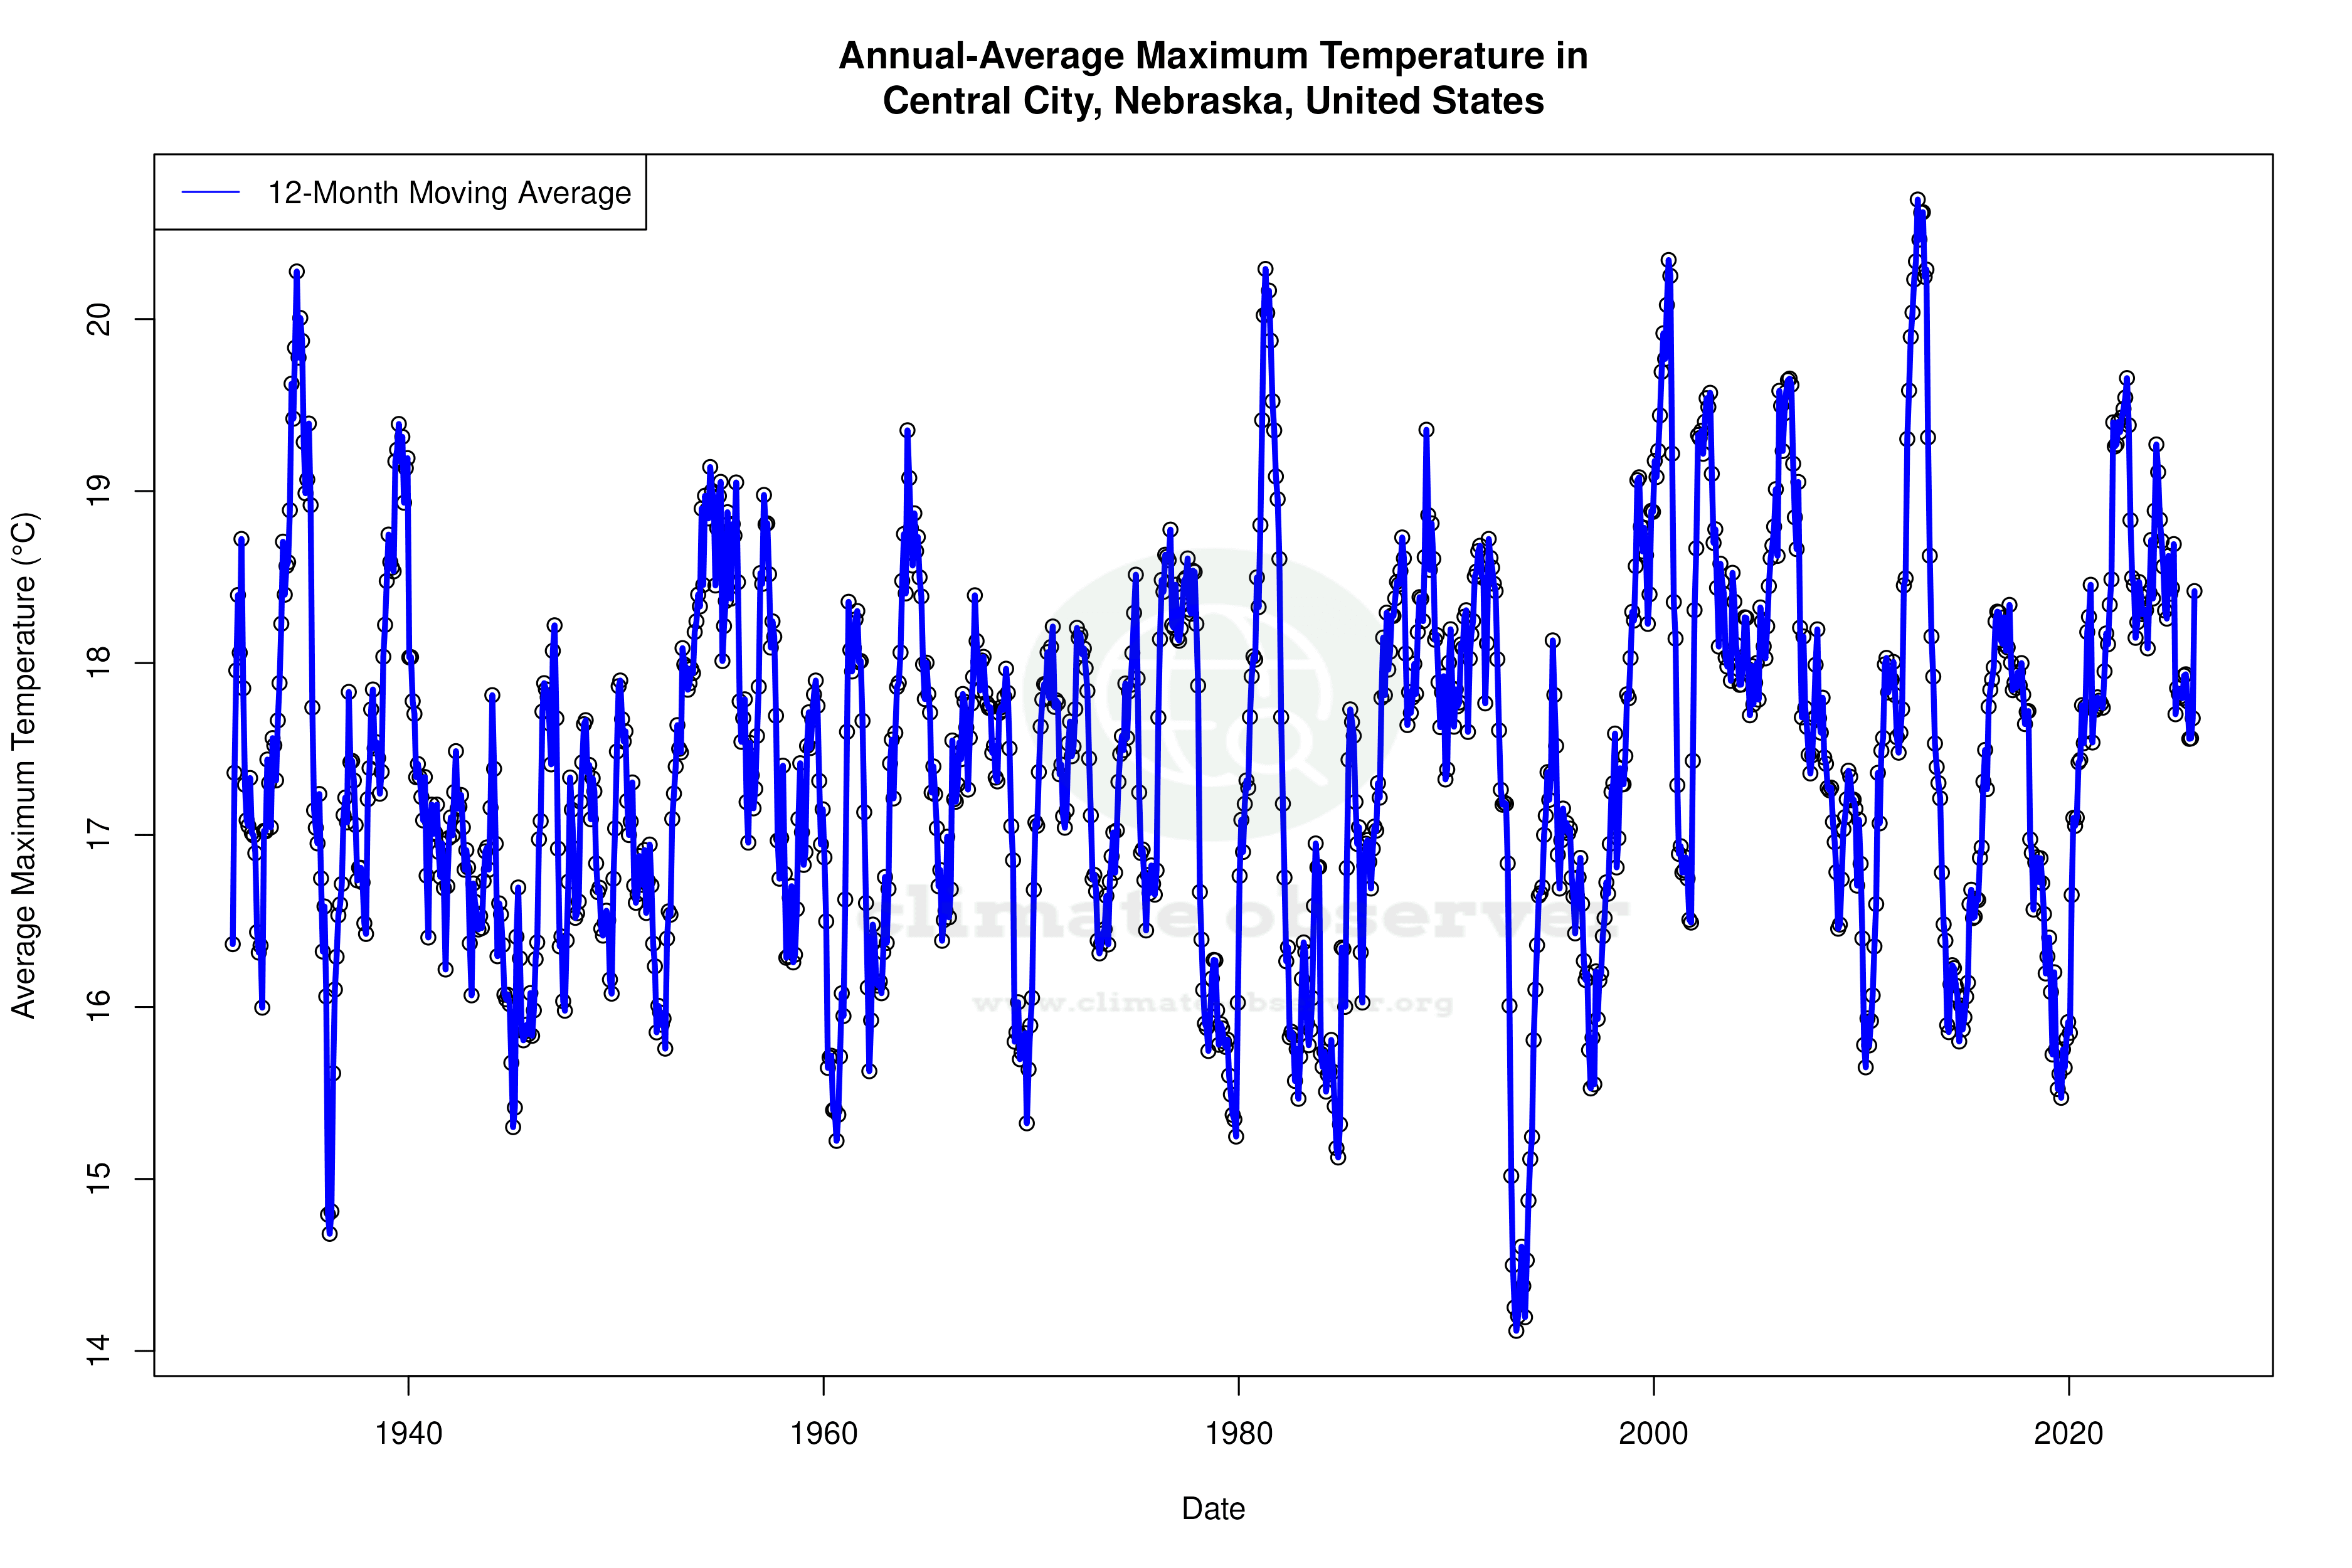


Max Temperature 12-Month MA | 1 of 6
Daily Data Points and Averages Throughout the Year


Average Max Temperature Throughout Year | 1 of 5
