Climate for Station: Lowville, New York, United States
Loading live weather...
Climate Analysis & Overview
Lowville, New York, is experiencing a warming trend in both high and low temperatures, with more evenly distributed precipitation. The past decade has seen significant warming, contrasting with the minimal all-time warming trend. This shift aligns with regional climate goals to manage temperature increases and precipitation patterns.
Climate Classification and Local Influences
Lowville is situated in a region classified under the Köppen climate classification as Dfb, indicating a humid continental climate with warm summers and cold, snowy winters. Nestled in Lewis County, New York, Lowville's climate is influenced by its proximity to the Tug Hill Plateau and the Adirondack Mountains. These geographical features contribute to its significant snowfall and temperature variability. The area's elevation and topography play a crucial role in shaping its climate patterns, often leading to colder temperatures and more precipitation compared to surrounding areas.
Temperature Trends: A Decade of Change
Over the past ten years, Lowville has experienced a notable warming trend. High temperatures have risen by 1.09°C (1.96°F), while low temperatures have increased by 1.32°C (2.37°F). This recent warming is significant compared to the all-time trends, where highs have only increased by a marginal 0.01°C (0.02°F) and lows by 0.08°C (0.14°F). The disparity between the decadal and all-time trends highlights a recent acceleration in temperature rise, possibly due to broader regional and global climate changes. This warming trend aligns with the United States' climate goals to monitor and adapt to rising temperatures.
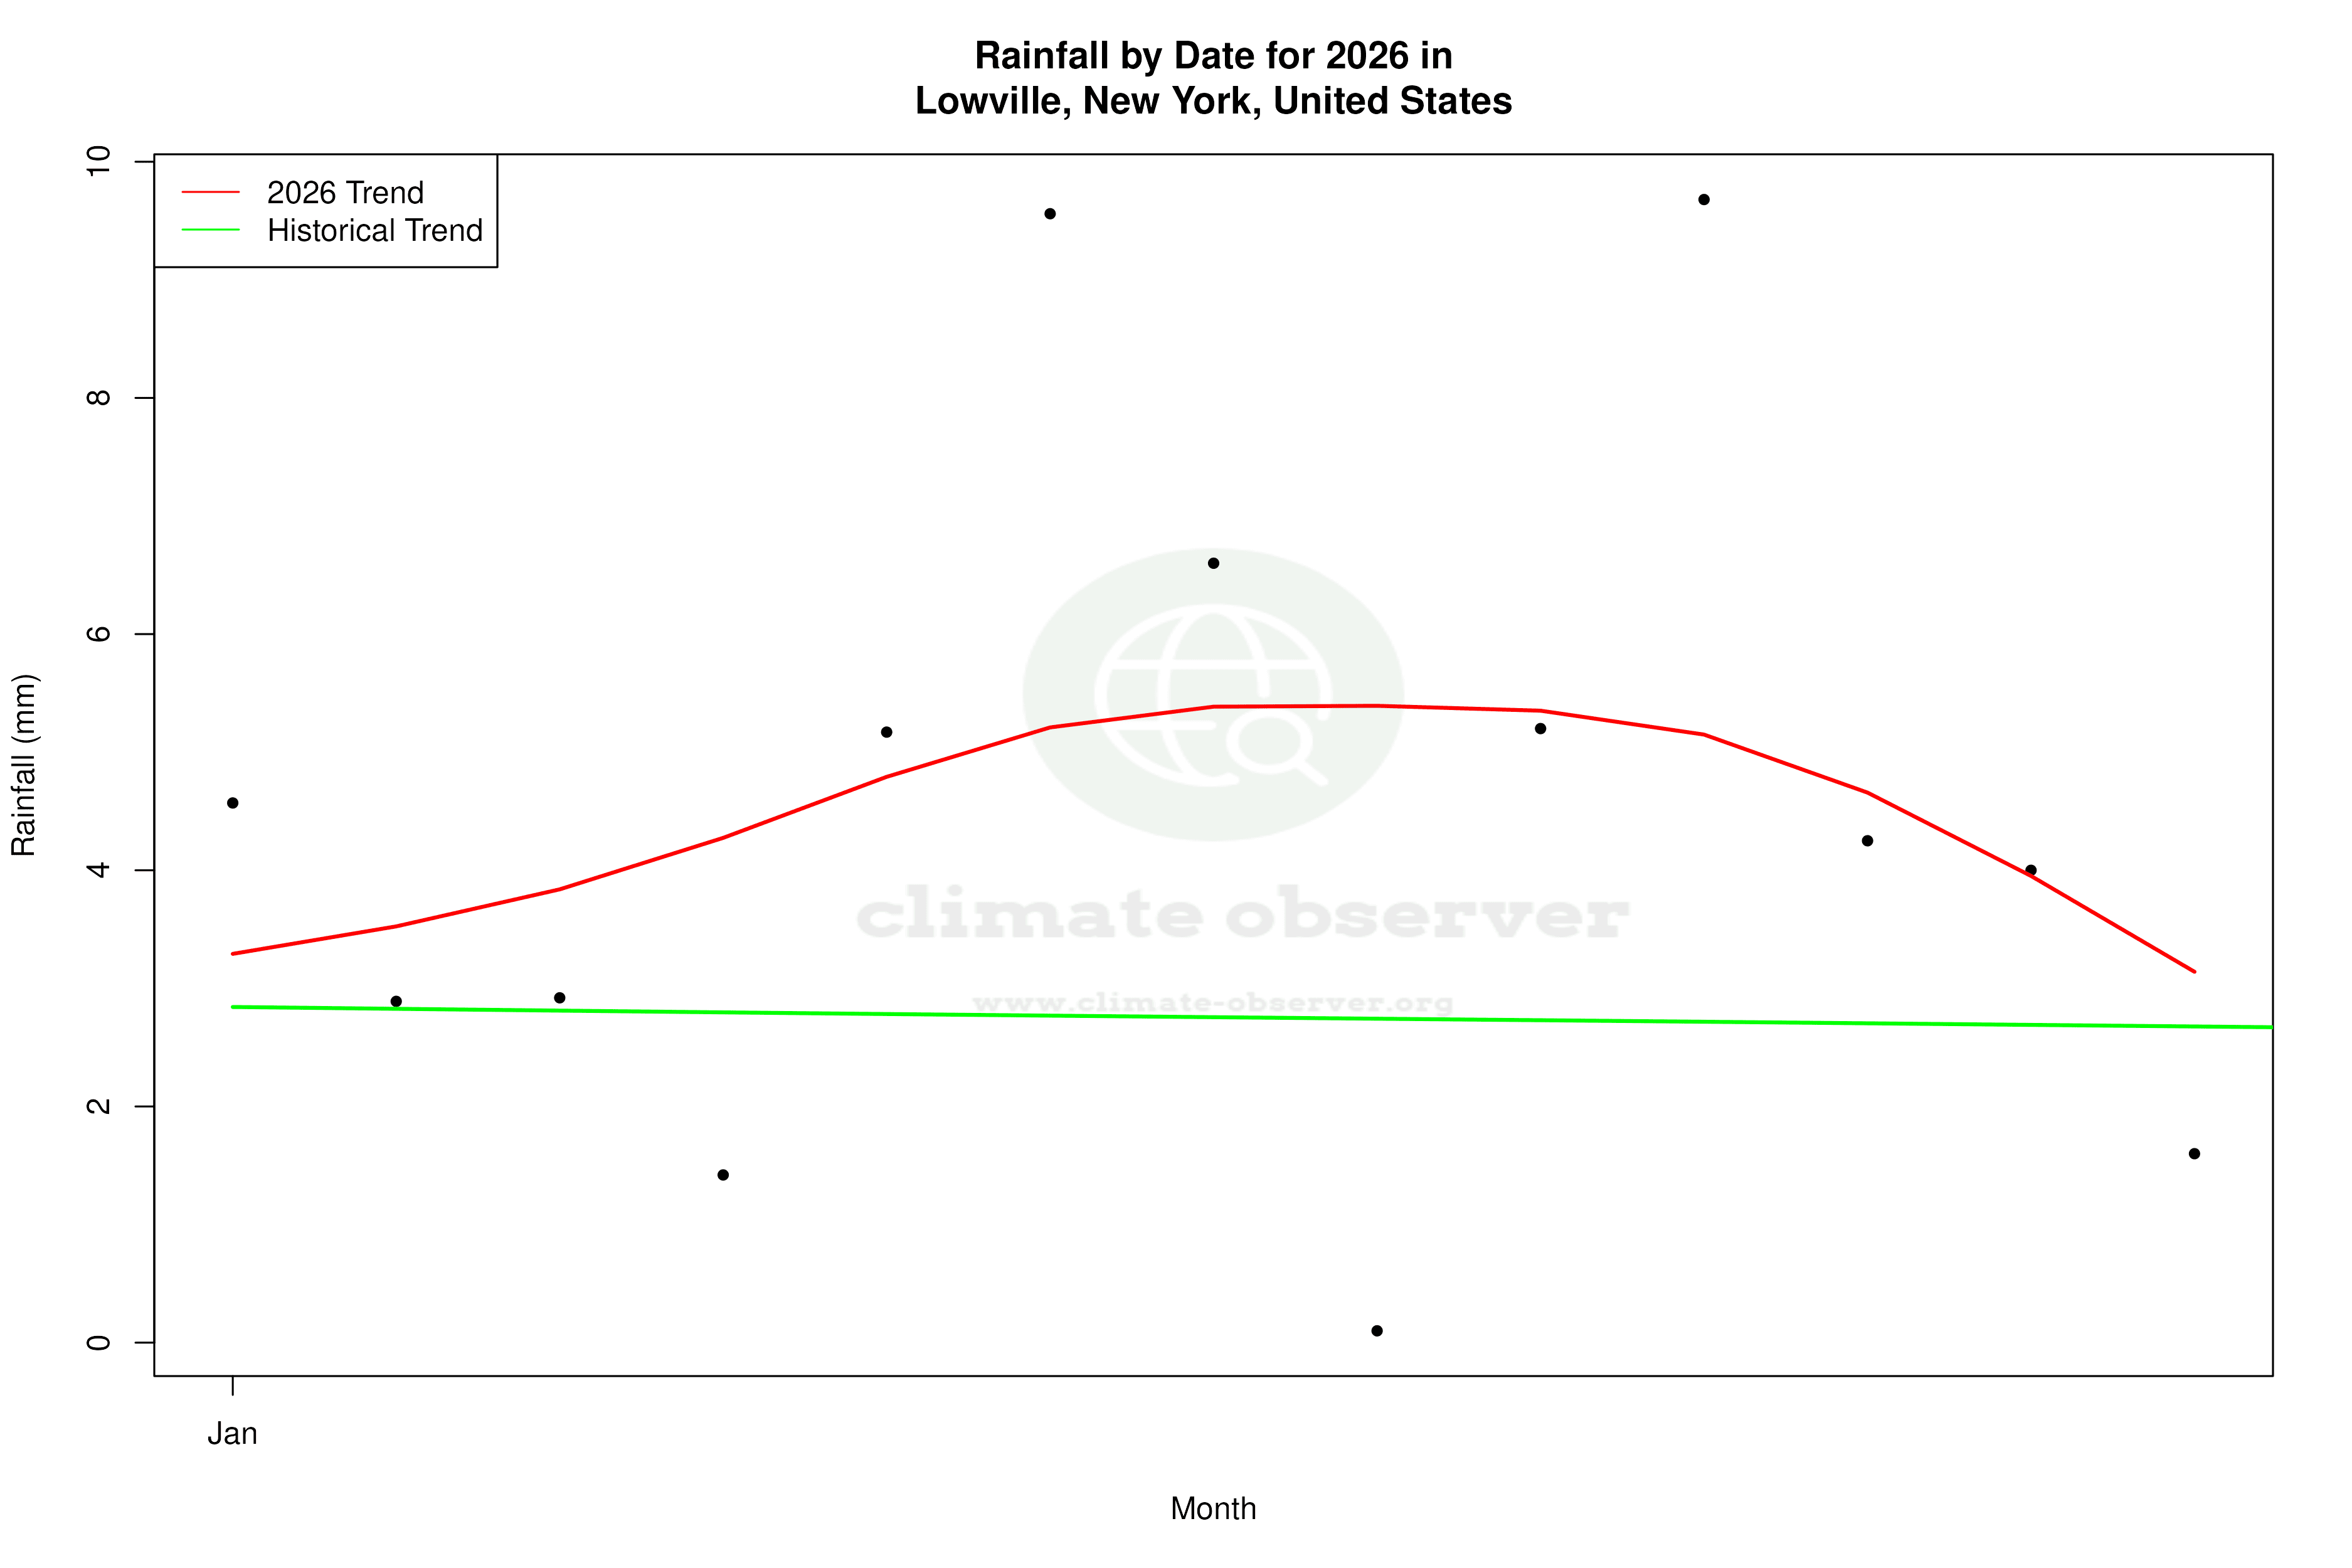
Precipitation Patterns: A More Even Distribution
The Precipitation Concentration Index (PCI) for Lowville has decreased from a baseline of 10.82 to a current value of 8.93. This indicates a more even distribution of precipitation events, meaning that rainfall is spread more uniformly throughout the year rather than being concentrated in fewer, more intense events. This change can be beneficial for agriculture and water management, as it reduces the risk of flooding and supports more consistent water availability.
Record Extremes: A Land of Contrasts
Lowville's climate is characterised by extreme temperature records, with a maximum of 37.8°C (100.0°F) and a minimum of -40.0°C (-40.0°F). These extremes underscore the region's susceptibility to significant temperature swings, a common feature of continental climates. Such records are crucial for understanding the potential impacts of climate variability and preparing for future weather extremes.
Regional Context: Aligning with Climate Goals
The observed trends in Lowville are consistent with broader efforts across the United States to address climate change impacts. The warming trend and changes in precipitation distribution align with national goals to mitigate climate change effects and adapt to evolving weather patterns. As Lowville continues to experience these shifts, understanding and integrating these changes into local planning and policy will be essential for resilience and sustainability.
Station Statistics
10-Year Trend
High: +0.91 °C/decade
Low: +1.14 °C/decade
Rain: +1.75 mm/decade
25-Year Trend
High: +0.63 °C/decade
Low: +0.61 °C/decade
Rain: +0.33 mm/decade
50-Year Trend
High: +0.24 °C/decade
Low: +0.32 °C/decade
Rain: +0.08 mm/decade
All-Time Trend
High: +0.01 °C/decade
Low: +0.08 °C/decade
Rain: +0.06 mm/decade
Percentage Above-Average Days
Last 12 Months: 52.3%
This Year: 65.0%
Precipitation Concentration Index (PCI) ℹ️
Last 12 Months: 9.3
Historical Average: 11.1
Percentile Rank of Last 12 Months ℹ️
High: 84th percentile
Low: 91st percentile
Rain: 96th percentile
Change in Variance ℹ️
High: -3.6%
Low: -7.7%
Intraday: -16.7%
Data Coverage
82.4%
First Year of Data
1910
Station Location
Historical Weather Records
| Max High | Avg High | Min High | Max Avg | Avg Avg | Min Avg | Max Low | Avg Low | Min Low | Max Precipitation | Avg Precipitation | Max Snow | Avg Snow | |
|---|---|---|---|---|---|---|---|---|---|---|---|---|---|
| Record | 37.8 °C | — | -26.7 °C | 29.3 °C | — | -30.2 °C | 25.6 °C | — | -40.0 °C | 111.3 mm | — | 775.0 mm | — |
| January | 17.8 °C | -2.7 °C | -23.9 °C | 16.2 °C | -7.3 °C | -30.2 °C | 11.1 °C | -13.4 °C | -38.3 °C | 46.0 mm | 2.7 mm | 610.0 mm | 24.9 mm |
| February | 18.9 °C | -1.8 °C | -24.4 °C | 10.6 °C | -6.1 °C | -26.1 °C | 6.1 °C | -13.1 °C | -37.8 °C | 46.5 mm | 2.4 mm | 610.0 mm | 22.4 mm |
| March | 27.2 °C | 3.5 °C | -18.3 °C | 18.2 °C | -1.1 °C | -20.6 °C | 14.4 °C | -7.1 °C | -32.8 °C | 68.6 mm | 2.4 mm | 686.0 mm | 13.5 mm |
| April | 31.7 °C | 11.5 °C | -7.8 °C | 21.4 °C | 6.0 °C | -10.3 °C | 16.1 °C | -0.0 °C | -20.0 °C | 57.7 mm | 2.7 mm | 254.0 mm | 3.6 mm |
| May | 35.6 °C | 19.0 °C | 1.7 °C | 25.8 °C | 12.8 °C | 0.0 °C | 21.1 °C | 6.1 °C | -6.7 °C | 76.7 mm | 2.8 mm | 64.0 mm | 0.2 mm |
| June | 37.2 °C | 23.9 °C | 8.9 °C | 28.0 °C | 17.6 °C | 7.5 °C | 24.4 °C | 11.1 °C | -2.2 °C | 88.1 mm | 3.0 mm | 0.0 mm | 0.0 mm |
| July | 37.8 °C | 26.5 °C | 10.6 °C | 29.3 °C | 20.4 °C | 12.1 °C | 24.4 °C | 13.6 °C | 1.7 °C | 73.9 mm | 2.9 mm | 0.0 mm | 0.0 mm |
| August | 36.7 °C | 25.4 °C | 11.7 °C | 29.1 °C | 19.6 °C | 9.7 °C | 25.6 °C | 12.5 °C | -1.7 °C | 111.3 mm | 2.9 mm | 0.0 mm | 0.0 mm |
| September | 35.0 °C | 21.2 °C | 5.6 °C | 28.1 °C | 15.5 °C | 3.1 °C | 22.2 °C | 8.4 °C | -5.6 °C | 96.8 mm | 2.9 mm | 0.0 mm | 0.0 mm |
| October | 30.6 °C | 14.5 °C | -0.6 °C | 23.3 °C | 9.0 °C | -1.1 °C | 19.4 °C | 3.0 °C | -12.8 °C | 75.2 mm | 3.1 mm | 203.0 mm | 0.7 mm |
| November | 25.0 °C | 6.6 °C | -12.2 °C | 20.1 °C | 2.6 °C | -14.7 °C | 15.6 °C | -2.4 °C | -26.1 °C | 53.1 mm | 3.2 mm | 483.0 mm | 9.4 mm |
| December | 19.4 °C | -0.2 °C | -26.7 °C | 13.3 °C | -3.4 °C | -24.3 °C | 11.7 °C | -9.7 °C | -40.0 °C | 67.1 mm | 3.0 mm | 775.0 mm | 22.4 mm |
Data Visualisations
Remove WatermarksCurrent Year Climate Trends vs Historical


Max Temperature this Year | 1 of 6
Climate 12-Month Moving Averages


Max Temperature 12-Month MA | 1 of 6
Daily Data Points and Averages Throughout the Year


Average Max Temperature Throughout Year | 1 of 5
