Climate for Station: Napoleon, North Dakota, United States
Loading live weather...
Climate Analysis & Overview
Napoleon, North Dakota, finds itself in a unique climatic position, balancing slight all-time warming with recent cooling trends. The area is experiencing more evenly distributed precipitation, marking a shift in local weather patterns that could align with broader regional climate goals.
Continental Climate Dynamics
Napoleon, located in Logan County, North Dakota, is classified under the Köppen climate system as having a humid continental climate. This classification is characterised by large seasonal temperature differences, with warm to hot summers and cold winters. The flat plains of the region, devoid of significant geographical barriers like mountains or large bodies of water, allow for the free movement of air masses, contributing to its distinct climatic traits.
Temperature Trends: A Tale of Two Intervals
Over the last decade, Napoleon has experienced a cooling trend, with high temperatures decreasing by 0.86°C (1.55°F) and lows by 1.51°C (2.71°F). This recent cooling contrasts with the all-time temperature trends, where highs have shown a slight warming of 0.05°C (0.09°F) and lows have increased by 0.24°C (0.43°F). This divergence suggests a short-term variation that could be influenced by natural climatic cycles or recent weather events, while the long-term data indicates a gradual warming consistent with global trends.
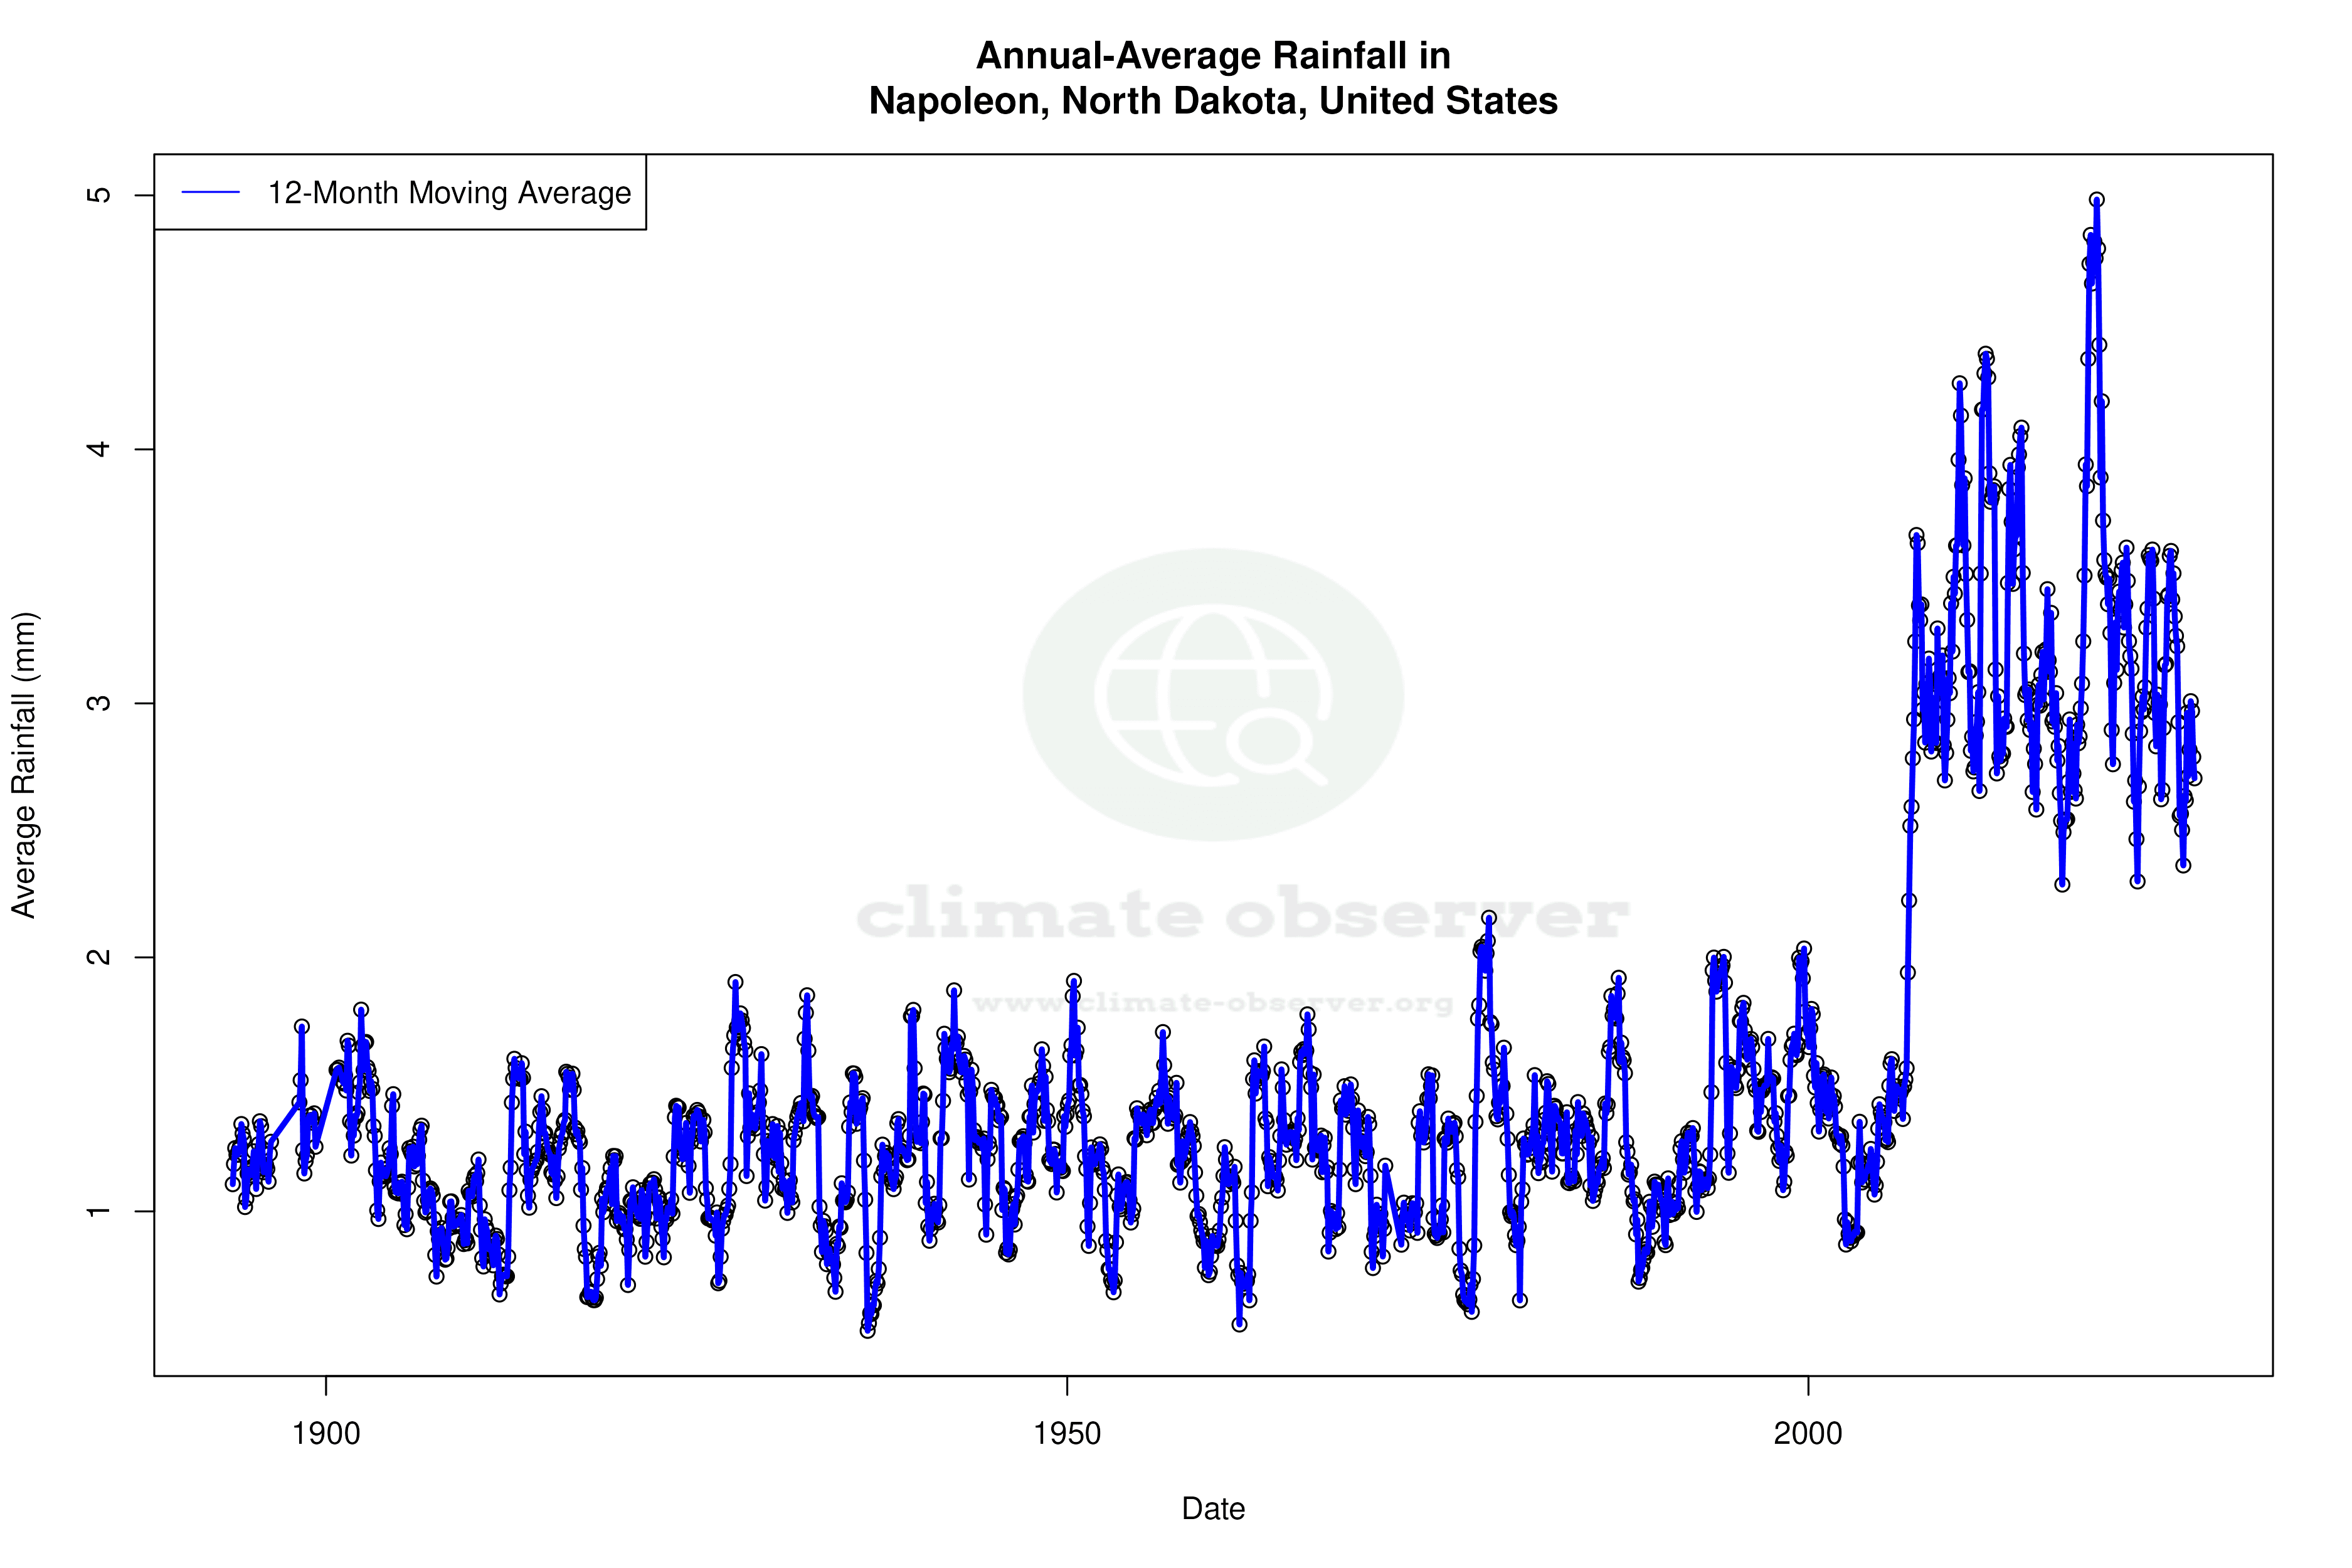
Precipitation Patterns: A Move Towards Evenness
The Precipitation Concentration Index (PCI) for Napoleon has decreased from a baseline of 15.08 to a current value of 12.14. This indicates a shift towards more evenly distributed rainfall events, as opposed to concentrated bursts. Such a change can have significant implications for agriculture and water management in the region, potentially aligning with the United States' goals for sustainable land use and climate adaptation.
Record Extremes: A Climate of Contrasts
Napoleon's climate is marked by extreme temperature records, with a maximum of 47.8°C (118.0°F) and a minimum of -44.4°C (-47.9°F). These records highlight the vast temperature range experienced in the region, a hallmark of its continental climate. Such extremes pose challenges for local infrastructure and agriculture, necessitating robust adaptation strategies.
Regional Implications and Climate Goals
The observed climatic changes in Napoleon are part of a broader narrative of climate variability in the United States. The recent cooling trend, coupled with more evenly distributed precipitation, may offer temporary relief from some climate-related stresses. However, the all-time warming trend underscores the importance of continued efforts towards achieving regional climate goals, such as reducing greenhouse gas emissions and enhancing resilience to climate impacts.
Station Statistics
10-Year Trend
High: -0.85 °C/decade
Low: -1.49 °C/decade
Rain: -0.27 mm/decade
25-Year Trend
High: +0.15 °C/decade
Low: +0.27 °C/decade
Rain: +0.80 mm/decade
50-Year Trend
High: +0.11 °C/decade
Low: +0.24 °C/decade
Rain: +0.56 mm/decade
All-Time Trend
High: +0.04 °C/decade
Low: +0.22 °C/decade
Rain: +0.13 mm/decade
Percentage Above-Average Days
Last 12 Months: 57.3%
This Year: 30.0%
Precipitation Concentration Index (PCI) ℹ️
Last 12 Months: 11.9
Historical Average: 13.9
Percentile Rank of Last 12 Months ℹ️
High: 48th percentile
Low: 66th percentile
Rain: 87th percentile
Change in Variance ℹ️
High: -12.6%
Low: -5.4%
Intraday: -22.7%
Data Coverage
83.3%
First Year of Data
1909
Station Location
Historical Weather Records
| Max High | Avg High | Min High | Max Avg | Avg Avg | Min Avg | Max Low | Avg Low | Min Low | Max Precipitation | Avg Precipitation | Max Snow | Avg Snow | |
|---|---|---|---|---|---|---|---|---|---|---|---|---|---|
| Record | 47.8 °C | — | -35.0 °C | 33.9 °C | — | -33.1 °C | 30.6 °C | — | -44.4 °C | 116.2 mm | — | 2591.0 mm | — |
| January | 18.9 °C | -7.4 °C | -35.0 °C | 4.1 °C | -10.3 °C | -32.2 °C | 7.8 °C | -18.7 °C | -43.3 °C | 74.9 mm | 0.7 mm | 267.0 mm | 5.4 mm |
| February | 33.3 °C | -5.2 °C | -32.2 °C | 6.8 °C | -7.8 °C | -33.1 °C | 21.1 °C | -16.8 °C | -43.9 °C | 64.7 mm | 0.7 mm | 2565.0 mm | 5.7 mm |
| March | 30.6 °C | 2.1 °C | -23.9 °C | 15.9 °C | -0.9 °C | -24.2 °C | 11.1 °C | -9.7 °C | -36.7 °C | 69.0 mm | 1.1 mm | 348.0 mm | 6.4 mm |
| April | 34.4 °C | 12.2 °C | -10.6 °C | 21.6 °C | 5.8 °C | -14.0 °C | 16.7 °C | -1.6 °C | -23.9 °C | 106.7 mm | 1.6 mm | 381.0 mm | 3.9 mm |
| May | 41.7 °C | 19.5 °C | -2.8 °C | 25.4 °C | 13.3 °C | 0.0 °C | 23.3 °C | 4.9 °C | -13.3 °C | 59.7 mm | 2.2 mm | 203.0 mm | 0.7 mm |
| June | 42.2 °C | 24.5 °C | 5.6 °C | 33.9 °C | 19.1 °C | 5.1 °C | 26.1 °C | 10.7 °C | -3.9 °C | 91.9 mm | 3.1 mm | 0.0 mm | 0.0 mm |
| July | 47.8 °C | 28.6 °C | 11.7 °C | 33.2 °C | 22.7 °C | 12.6 °C | 30.6 °C | 13.4 °C | -3.9 °C | 104.1 mm | 2.5 mm | 0.0 mm | 0.0 mm |
| August | 43.9 °C | 27.9 °C | 10.0 °C | 30.5 °C | 21.4 °C | 11.1 °C | 25.0 °C | 12.1 °C | -3.9 °C | 116.2 mm | 2.0 mm | 0.0 mm | 0.0 mm |
| September | 41.7 °C | 22.0 °C | 1.7 °C | 30.2 °C | 15.5 °C | 0.9 °C | 22.2 °C | 6.8 °C | -12.2 °C | 81.3 mm | 1.6 mm | 203.0 mm | 0.2 mm |
| October | 35.0 °C | 14.3 °C | -10.6 °C | 22.4 °C | 6.9 °C | -15.1 °C | 21.7 °C | 0.1 °C | -22.2 °C | 104.8 mm | 1.3 mm | 356.0 mm | 1.4 mm |
| November | 24.4 °C | 3.6 °C | -24.4 °C | 15.7 °C | -1.6 °C | -21.8 °C | 11.9 °C | -8.0 °C | -32.8 °C | 55.3 mm | 0.8 mm | 2591.0 mm | 5.3 mm |
| December | 21.1 °C | -4.3 °C | -30.0 °C | 5.2 °C | -8.3 °C | -32.0 °C | 6.1 °C | -15.1 °C | -44.4 °C | 54.8 mm | 0.8 mm | 2553.0 mm | 6.3 mm |
Data Visualisations
Remove WatermarksCurrent Year Climate Trends vs Historical


Max Temperature this Year | 1 of 6
Climate 12-Month Moving Averages


Max Temperature 12-Month MA | 1 of 6
Daily Data Points and Averages Throughout the Year


Average Max Temperature Throughout Year | 1 of 5
