Climate for Station: Oelrichs, South Dakota, United States
Loading live weather...
Climate Analysis & Overview
Oelrichs, South Dakota, is experiencing a warming trend, with significant increases in low temperatures over the past decade. The region's precipitation patterns are becoming slightly more concentrated, indicating potential shifts in weather events.
Climate Classification and Geographic Influence
Oelrichs is situated in a region classified under the Köppen climate system as a semi-arid (BSk) climate. This classification is characterised by hot summers and cold winters, with limited precipitation. The town's location in Fall River County, South Dakota, places it in the Great Plains, a region influenced by continental climate dynamics. The absence of significant mountain ranges or large bodies of water results in temperature extremes, as evidenced by historical records, with a maximum of 45.6°C (114.1°F) and a minimum of -40.6°C (-41.1°F).
Temperature Trends: A Decade of Change
Over the past decade, Oelrichs has experienced a noticeable increase in temperatures, particularly in the lows. The low temperatures have risen by 0.91°C (1.64°F), while the highs have increased by 0.12°C (0.22°F). This suggests a trend towards milder nights, which could have implications for local agriculture and energy consumption. The all-time temperature trends show a more modest warming, with highs increasing by 0.04°C (0.07°F) and lows by 0.09°C (0.16°F). This long-term data highlights a gradual warming pattern, consistent with broader regional and global climate trends.
Precipitation Patterns: Concentration and Implications
The Precipitation Concentration Index (PCI) for Oelrichs has shown a slight increase from a baseline of 15.88 to 16.04. The PCI is a measure of how precipitation is distributed over time, with higher values indicating more concentrated rainfall events. This marginal increase suggests that precipitation in Oelrichs is becoming slightly more concentrated in fewer events, which could lead to more intense storms and potential challenges for water management.
Regional Climate Context and Future Considerations
The observed trends in Oelrichs align with broader regional climate patterns across the United States, where efforts are underway to mitigate the impacts of climate change. The increase in low temperatures and the slight shift in precipitation concentration could influence local ecosystems and agricultural practices. These changes must be considered within the context of national climate goals, which aim to reduce greenhouse gas emissions and enhance resilience to climate variability.
Station Statistics
10-Year Trend
High: +0.15 °C/decade
Low: +1.33 °C/decade
Rain: -0.08 mm/decade
25-Year Trend
High: -0.47 °C/decade
Low: -0.31 °C/decade
Rain: +0.16 mm/decade
50-Year Trend
High: -0.01 °C/decade
Low: -0.08 °C/decade
Rain: +0.02 mm/decade
All-Time Trend
High: +0.03 °C/decade
Low: +0.08 °C/decade
Rain: -0.01 mm/decade
Percentage Above-Average Days
Last 12 Months: 59.2%
This Year: 52.7%
Precipitation Concentration Index (PCI) ℹ️
Last 12 Months: 16.0
Historical Average: 15.9
Percentile Rank of Last 12 Months ℹ️
High: N/A
Low: N/A
Rain: N/A
Change in Variance ℹ️
High: -2.7%
Low: -4.9%
Intraday: -13.2%
Data Coverage
73.3%
First Year of Data
1911
Station Location
Historical Weather Records
| Max High | Avg High | Min High | Max Avg | Avg Avg | Min Avg | Max Low | Avg Low | Min Low | Max Precipitation | Avg Precipitation | Max Snow | Avg Snow | |
|---|---|---|---|---|---|---|---|---|---|---|---|---|---|
| Record | 45.6 °C | — | -28.3 °C | — | — | — | 31.1 °C | — | -40.6 °C | 124.0 mm | — | 711.0 mm | — |
| January | 20.6 °C | 1.5 °C | -27.2 °C | — | — | — | 6.1 °C | -11.7 °C | -37.8 °C | 31.8 mm | 0.4 mm | 305.0 mm | 5.1 mm |
| February | 25.6 °C | 3.7 °C | -28.3 °C | — | — | — | 6.1 °C | -10.3 °C | -40.6 °C | 40.6 mm | 0.5 mm | 406.0 mm | 6.0 mm |
| March | 29.4 °C | 9.3 °C | -17.2 °C | — | — | — | 12.2 °C | -6.0 °C | -31.1 °C | 76.2 mm | 0.9 mm | 381.0 mm | 7.8 mm |
| April | 36.7 °C | 15.9 °C | -8.3 °C | — | — | — | 21.1 °C | -0.2 °C | -21.7 °C | 69.9 mm | 1.7 mm | 533.0 mm | 5.2 mm |
| May | 39.4 °C | 21.4 °C | 0.6 °C | — | — | — | 19.4 °C | 5.3 °C | -12.8 °C | 110.7 mm | 2.7 mm | 229.0 mm | 0.4 mm |
| June | 43.3 °C | 27.3 °C | 5.6 °C | — | — | — | 23.9 °C | 10.7 °C | -2.8 °C | 114.3 mm | 2.6 mm | 64.0 mm | 0.0 mm |
| July | 45.6 °C | 32.4 °C | 13.3 °C | — | — | — | 28.9 °C | 14.2 °C | 1.1 °C | 86.4 mm | 1.8 mm | 0.0 mm | 0.0 mm |
| August | 43.3 °C | 31.7 °C | 8.3 °C | — | — | — | 31.1 °C | 13.0 °C | -3.3 °C | 104.1 mm | 1.2 mm | 0.0 mm | 0.0 mm |
| September | 42.8 °C | 26.1 °C | 0.6 °C | — | — | — | 25.0 °C | 7.3 °C | -12.8 °C | 124.0 mm | 1.1 mm | 152.0 mm | 0.3 mm |
| October | 35.6 °C | 18.4 °C | -11.1 °C | — | — | — | 16.1 °C | 0.7 °C | -21.7 °C | 88.9 mm | 1.0 mm | 711.0 mm | 2.1 mm |
| November | 30.6 °C | 9.2 °C | -17.2 °C | — | — | — | 12.8 °C | -5.6 °C | -30.0 °C | 88.9 mm | 0.5 mm | 292.0 mm | 4.3 mm |
| December | 23.3 °C | 2.9 °C | -27.2 °C | — | — | — | 8.9 °C | -10.2 °C | -38.3 °C | 43.2 mm | 0.4 mm | 279.0 mm | 5.5 mm |
Data Visualisations
Remove WatermarksCurrent Year Climate Trends vs Historical


Max Temperature this Year | 1 of 6
Climate 12-Month Moving Averages
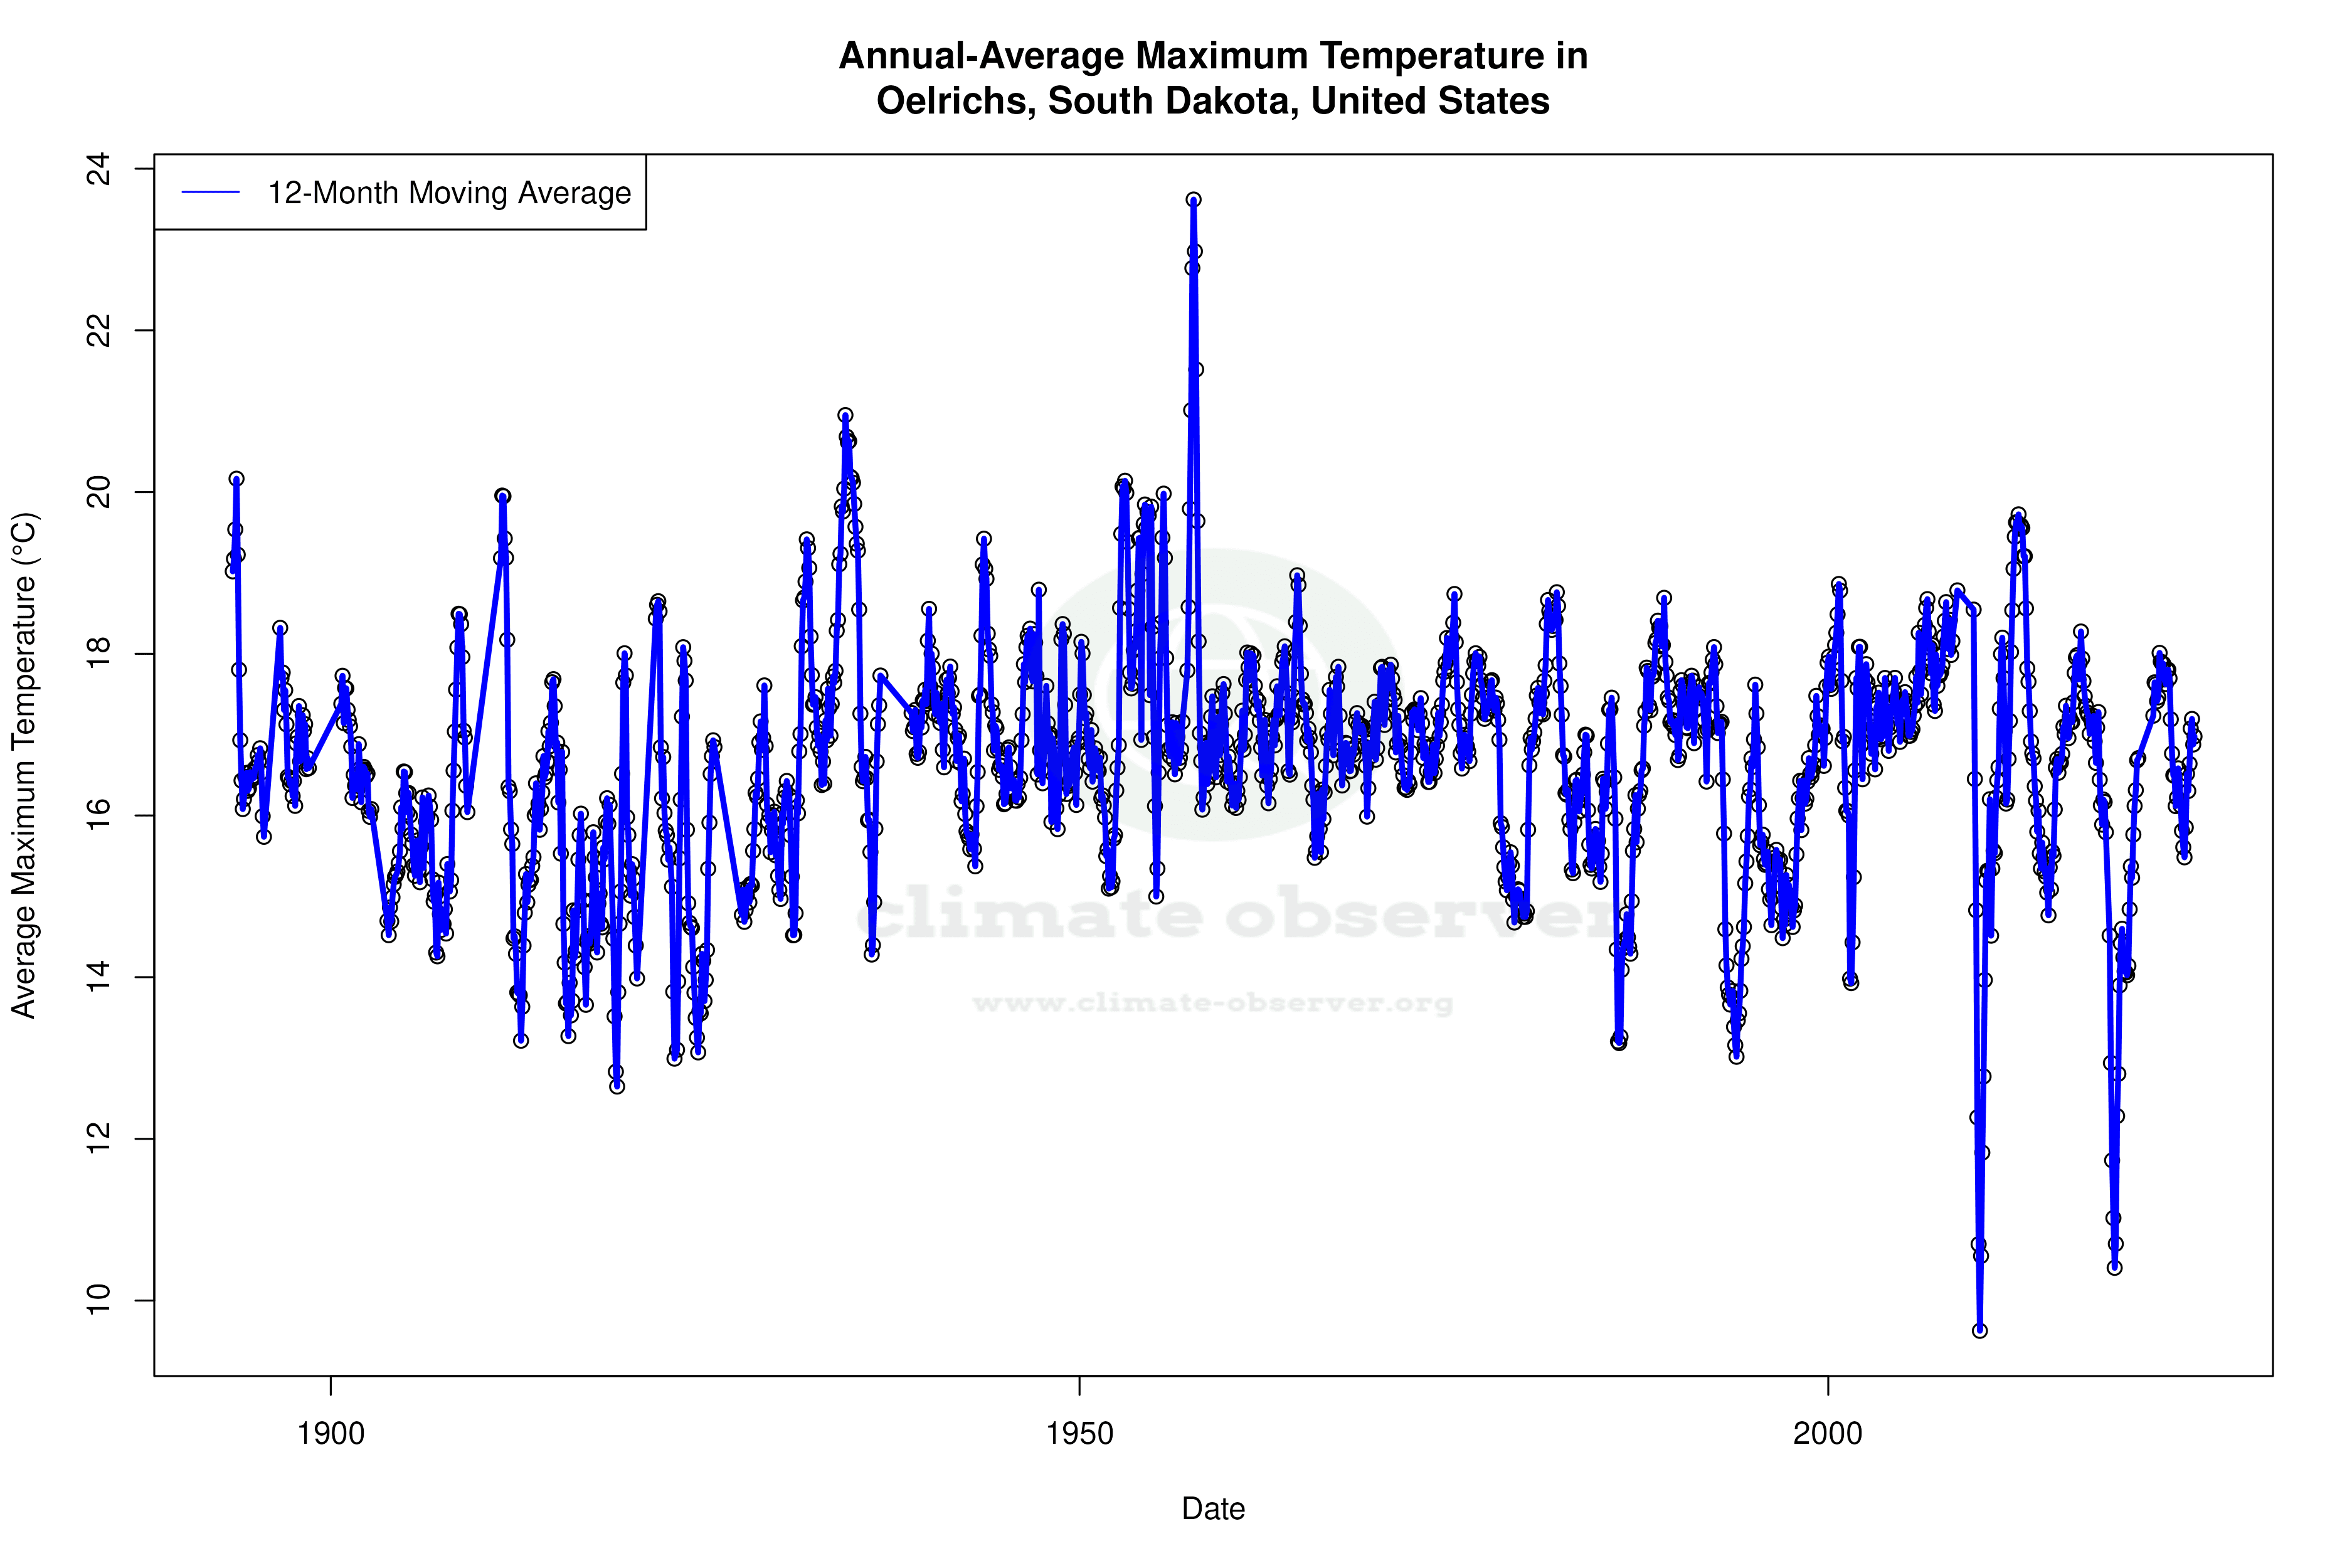


Max Temperature 12-Month MA | 1 of 6
Daily Data Points and Averages Throughout the Year


Average Max Temperature Throughout Year | 1 of 5
