Climate for Station: Jackson Exp Stn, Tennessee, United States
Loading live weather...
Climate Analysis & Overview
The Jackson Experiment Station in West Tennessee is experiencing a nuanced climate evolution, marked by a slight cooling in long-term high temperatures and a marginal increase in precipitation concentration. This station's climate story is set against the backdrop of regional efforts to manage climate variability.
Tennessee's Climate Context
Located in West Tennessee, the Jackson Experiment Station sits within a humid subtropical climate zone, characterised by hot summers and mild winters. The region's proximity to the Mississippi River influences its climate, providing moisture that contributes to its precipitation patterns. This geographical positioning plays a crucial role in the station's climate data, which reveals both subtle and significant shifts over time.
Temperature Trends: A Mixed Bag
Over the past decade, Jackson has experienced a warming trend in both high and low temperatures. Specifically, the 10-year trend shows a rise in high temperatures by 0.18°C (0.32°F) and a smaller increase in low temperatures by 0.05°C (0.10°F). However, when examining the all-time data, a different picture emerges. There is a slight cooling trend in high temperatures, with a fall of 0.05°C (0.09°F), while low temperatures have risen by 0.04°C (0.07°F). These contrasting trends highlight the complexity of climate dynamics at this station.
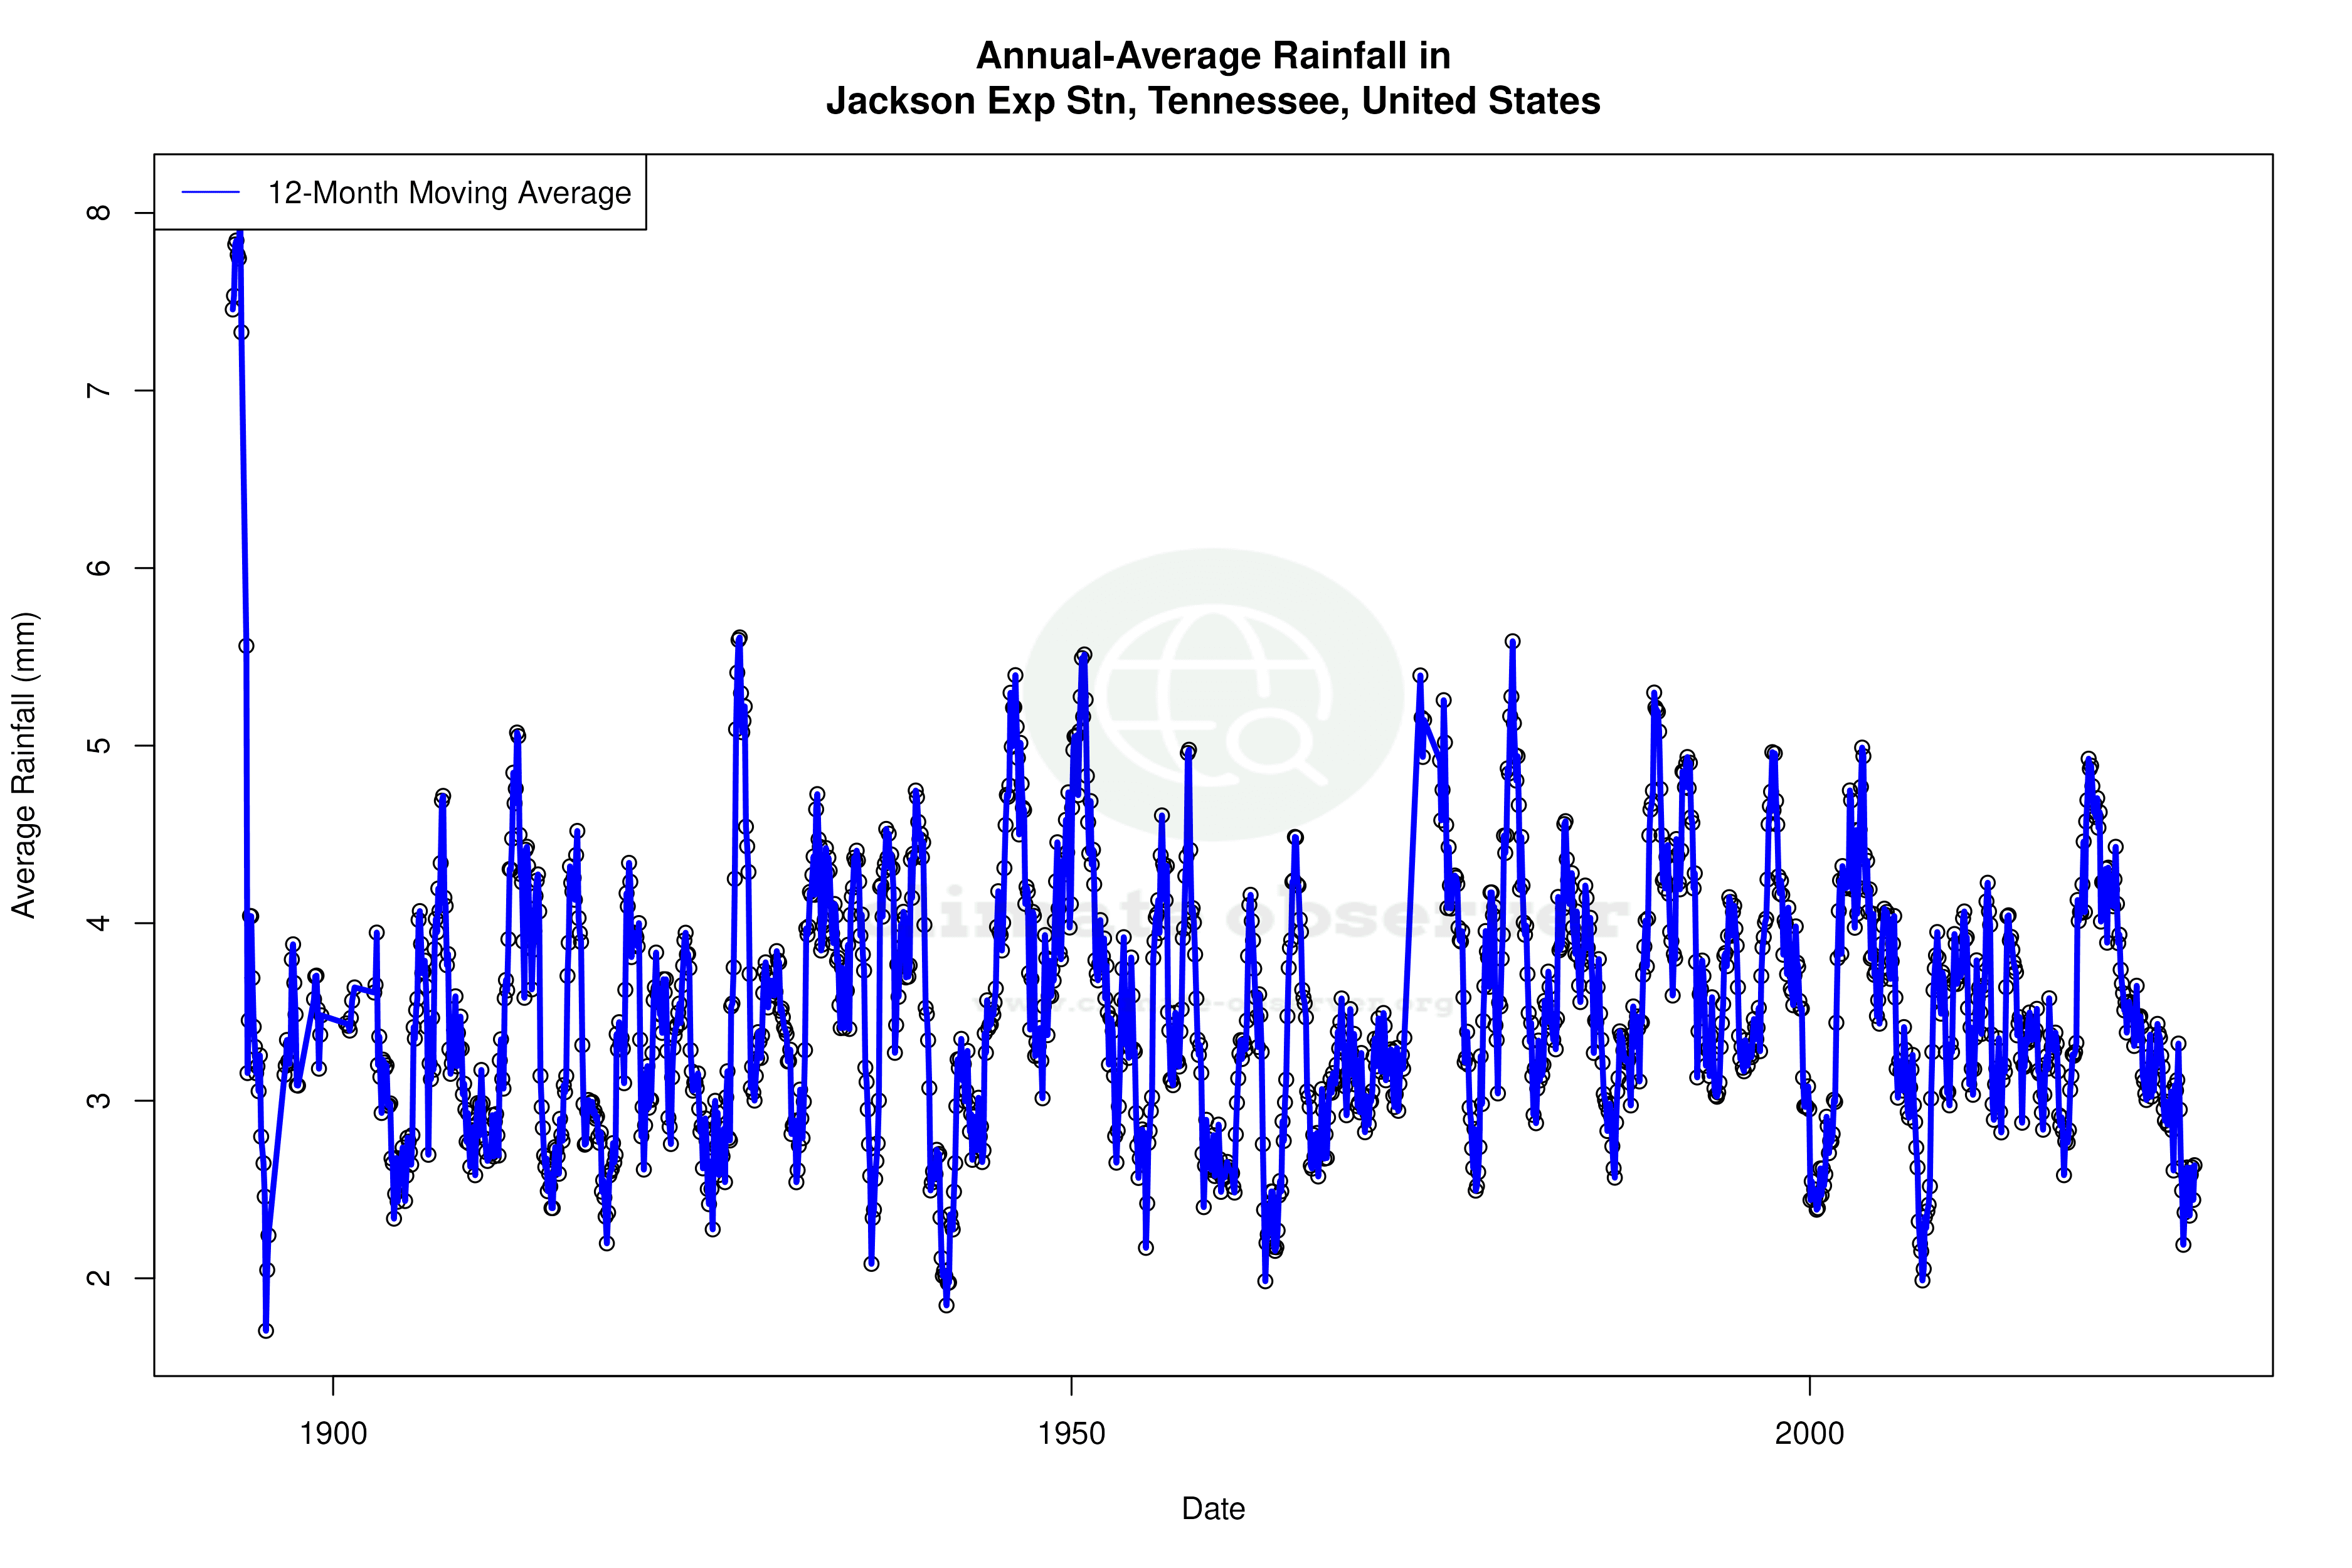
Precipitation Patterns: Concentration Shift
The Precipitation Concentration Index (PCI) at Jackson has seen a marginal increase from a baseline of 11.29 to a current value of 11.51. The PCI measures how precipitation is distributed over time, with higher values indicating more concentrated rainfall events. This slight increase suggests that precipitation is becoming marginally more concentrated, potentially leading to more intense but less frequent rainfall events. Although the change is not large, it is an important indicator of shifting precipitation dynamics.
Extreme Temperature Records
Jackson's temperature records underscore the region's climatic extremes, with a maximum recorded temperature of 43.3°C (109.9°F) and a minimum of -29.4°C (-20.9°F). These records reflect the station's capacity to experience significant thermal variability, a characteristic of its humid subtropical climate. Such extremes are essential considerations in regional climate planning and adaptation strategies.
Regional Climate Implications
The observed trends at the Jackson Experiment Station are relevant within the context of the United States' broader climate goals, which aim to mitigate the impacts of climate change through adaptation and resilience strategies. The slight cooling in long-term high temperatures and the marginal increase in precipitation concentration provide insights into the local manifestations of broader climatic shifts. These data points serve as a valuable resource for policymakers and scientists working to address the challenges posed by climate variability in the region.
Station Statistics
10-Year Trend
High: +0.11 °C/decade
Low: -0.03 °C/decade
Rain: -1.09 mm/decade
25-Year Trend
High: +0.65 °C/decade
Low: -0.04 °C/decade
Rain: -0.20 mm/decade
50-Year Trend
High: +0.51 °C/decade
Low: +0.18 °C/decade
Rain: -0.10 mm/decade
All-Time Trend
High: -0.04 °C/decade
Low: +0.04 °C/decade
Rain: +0.01 mm/decade
Percentage Above-Average Days
Last 12 Months: 63.0%
This Year: 59.6%
Precipitation Concentration Index (PCI) ℹ️
Last 12 Months: 9.8
Historical Average: 10.7
Percentile Rank of Last 12 Months ℹ️
High: 79th percentile
Low: 83rd percentile
Rain: 16th percentile
Change in Variance ℹ️
High: -9.3%
Low: +1.7%
Intraday: -8.4%
Data Coverage
83.9%
First Year of Data
1891
Station Location
Historical Weather Records
| Max High | Avg High | Min High | Max Avg | Avg Avg | Min Avg | Max Low | Avg Low | Min Low | Max Precipitation | Avg Precipitation | Max Snow | Avg Snow | |
|---|---|---|---|---|---|---|---|---|---|---|---|---|---|
| Record | 43.3 °C | — | -15.6 °C | 32.6 °C | — | -19.6 °C | 34.4 °C | — | -29.4 °C | 168.5 mm | — | 254.0 mm | — |
| January | 34.4 °C | 9.2 °C | -14.4 °C | 20.3 °C | 3.5 °C | -19.6 °C | 18.9 °C | -1.5 °C | -27.8 °C | 160.0 mm | 3.8 mm | 254.0 mm | 1.6 mm |
| February | 28.3 °C | 11.4 °C | -15.6 °C | 22.3 °C | 5.9 °C | -13.4 °C | 19.4 °C | 0.0 °C | -29.4 °C | 83.2 mm | 3.8 mm | 203.0 mm | 1.4 mm |
| March | 33.3 °C | 16.6 °C | -7.8 °C | 24.2 °C | 11.1 °C | -7.5 °C | 20.6 °C | 4.5 °C | -13.9 °C | 121.9 mm | 4.2 mm | 208.0 mm | 0.5 mm |
| April | 32.8 °C | 22.1 °C | 4.4 °C | 26.7 °C | 16.0 °C | 0.8 °C | 23.9 °C | 9.3 °C | -6.7 °C | 129.5 mm | 4.2 mm | 76.0 mm | 0.0 mm |
| May | 38.9 °C | 26.4 °C | 10.0 °C | 27.9 °C | 20.5 °C | 7.8 °C | 25.0 °C | 14.1 °C | -1.1 °C | 139.7 mm | 4.0 mm | 0.0 mm | 0.0 mm |
| June | 40.0 °C | 30.8 °C | 16.7 °C | 31.0 °C | 24.7 °C | 15.6 °C | 32.8 °C | 18.6 °C | 4.4 °C | 105.4 mm | 3.3 mm | 0.0 mm | 0.0 mm |
| July | 43.3 °C | 32.4 °C | 20.0 °C | 32.6 °C | 26.5 °C | 18.9 °C | 31.7 °C | 20.4 °C | 10.0 °C | 113.3 mm | 3.3 mm | 0.0 mm | 0.0 mm |
| August | 43.3 °C | 32.1 °C | 19.4 °C | 31.9 °C | 25.6 °C | 15.7 °C | 34.4 °C | 19.6 °C | 6.7 °C | 115.6 mm | 2.7 mm | 0.0 mm | 0.0 mm |
| September | 41.1 °C | 29.2 °C | 12.2 °C | 32.4 °C | 22.0 °C | 10.8 °C | 27.8 °C | 15.8 °C | -1.1 °C | 168.5 mm | 2.9 mm | 0.0 mm | 0.0 mm |
| October | 37.2 °C | 23.4 °C | 2.2 °C | 26.5 °C | 15.9 °C | 1.0 °C | 28.9 °C | 8.9 °C | -7.2 °C | 80.0 mm | 2.5 mm | 0.0 mm | 0.0 mm |
| November | 33.3 °C | 16.4 °C | -5.6 °C | 22.7 °C | 10.1 °C | -5.8 °C | 20.0 °C | 3.6 °C | -17.8 °C | 156.2 mm | 3.5 mm | 89.0 mm | 0.1 mm |
| December | 26.7 °C | 10.7 °C | -15.6 °C | 22.4 °C | 5.5 °C | -18.2 °C | 20.0 °C | 0.1 °C | -29.4 °C | 158.5 mm | 3.9 mm | 254.0 mm | 0.6 mm |
Data Visualisations
Remove WatermarksCurrent Year Climate Trends vs Historical


Max Temperature this Year | 1 of 6
Climate 12-Month Moving Averages


Max Temperature 12-Month MA | 1 of 6
Daily Data Points and Averages Throughout the Year


Average Max Temperature Throughout Year | 1 of 5
