Climate for Station: Corsicana, Texas, United States
Loading live weather...
Climate Analysis & Overview
Corsicana, Texas, experiences a nuanced climate profile, with a slight cooling trend in historical highs but a warming trend in lows. The precipitation distribution has become more even over time, suggesting a shift in rainfall patterns. These changes align with regional climate goals aimed at understanding and adapting to evolving weather patterns.
Köppen Climate Classification and Local Geography
Corsicana, Texas, falls under the Cfa category of the Köppen climate classification, indicating a humid subtropical climate with hot summers and mild winters. Situated in Navarro County, the region's climate is influenced by its inland geography, lacking significant topographical features like mountains or coastlines that could moderate temperatures. The absence of such geographical barriers allows for the free flow of warm air masses, contributing to the area's characteristic hot summers.
Temperature Trends: A Tale of Two Metrics
Examining the temperature trends reveals a complex picture. Over the all-time period, Corsicana has experienced a slight cooling in high temperatures, with a decline of 0.03°C (0.05°F). In contrast, the low temperatures have shown a warming trend, with an increase of 0.06°C (0.11°F). This divergence suggests a narrowing of the diurnal temperature range over the long term. However, the last decade tells a different story, with high temperatures increasing by 0.49°C (0.88°F) and lows by 0.31°C (0.56°F), indicating a recent warming trend that could be linked to broader regional climate changes.
Precipitation Patterns: A More Even Distribution
The Precipitation Concentration Index (PCI) provides insight into rainfall distribution. Corsicana's PCI has decreased from a baseline of 12.22 to a current value of 11.18, indicating a more even distribution of precipitation events over time. This marginal change suggests that rainfall is becoming less concentrated in intense events and more evenly spread throughout the year. Such shifts could have implications for water resource management and agricultural planning in the region.
Extreme Temperature Records
Corsicana's temperature extremes underscore the variability inherent in its climate. The highest recorded temperature is a scorching 45.0°C (113.0°F), while the lowest plummets to a frigid -20.6°C (-5.1°F). These records highlight the potential for significant temperature swings, which are characteristic of the broader climatic patterns in the American South.
Regional Climate Context and Implications
Corsicana's climate trends are part of a larger narrative of climatic shifts across the United States. As the nation works towards regional climate goals, understanding localised changes like those in Corsicana becomes crucial. The warming trends in lows and the more even distribution of precipitation align with efforts to anticipate and mitigate the impacts of climate change. Such insights are vital for developing adaptive strategies to ensure resilience in the face of evolving weather patterns.
Station Statistics
10-Year Trend
High: +0.48 °C/decade
Low: +0.30 °C/decade
Rain: -0.83 mm/decade
25-Year Trend
High: +0.27 °C/decade
Low: +0.12 °C/decade
Rain: -0.18 mm/decade
50-Year Trend
High: +0.32 °C/decade
Low: +0.35 °C/decade
Rain: -0.09 mm/decade
All-Time Trend
High: -0.05 °C/decade
Low: +0.05 °C/decade
Rain: +0.01 mm/decade
Percentage Above-Average Days
Last 12 Months: 64.4%
This Year: 65.0%
Precipitation Concentration Index (PCI) ℹ️
Last 12 Months: 11.3
Historical Average: 13.3
Percentile Rank of Last 12 Months ℹ️
High: 75th percentile
Low: 93rd percentile
Rain: 40th percentile
Change in Variance ℹ️
High: -6.5%
Low: +4.8%
Intraday: -5.1%
Data Coverage
83.0%
First Year of Data
1893
Station Location
Historical Weather Records
| Max High | Avg High | Min High | Max Avg | Avg Avg | Min Avg | Max Low | Avg Low | Min Low | Max Precipitation | Avg Precipitation | Max Snow | Avg Snow | |
|---|---|---|---|---|---|---|---|---|---|---|---|---|---|
| Record | 45.0 °C | — | -10.0 °C | 36.1 °C | — | -11.6 °C | 28.3 °C | — | -20.6 °C | 253.0 mm | — | 254.0 mm | — |
| January | 31.7 °C | 14.0 °C | -9.4 °C | 22.6 °C | 7.9 °C | -7.7 °C | 20.6 °C | 1.8 °C | -20.6 °C | 69.1 mm | 2.2 mm | 180.0 mm | 0.6 mm |
| February | 35.6 °C | 16.0 °C | -10.0 °C | 23.1 °C | 10.2 °C | -11.6 °C | 21.1 °C | 3.5 °C | -20.0 °C | 69.3 mm | 2.6 mm | 165.0 mm | 0.3 mm |
| March | 35.0 °C | 20.5 °C | -3.3 °C | 25.3 °C | 14.6 °C | -4.1 °C | 21.7 °C | 7.5 °C | -11.1 °C | 82.6 mm | 2.6 mm | 254.0 mm | 0.1 mm |
| April | 37.2 °C | 24.9 °C | 3.3 °C | 27.9 °C | 18.7 °C | 3.6 °C | 23.9 °C | 12.2 °C | -1.7 °C | 145.5 mm | 3.5 mm | 0.0 mm | 0.0 mm |
| May | 40.0 °C | 28.6 °C | 10.0 °C | 32.5 °C | 23.2 °C | 10.0 °C | 26.1 °C | 16.9 °C | -0.6 °C | 253.0 mm | 4.0 mm | 0.0 mm | 0.0 mm |
| June | 42.2 °C | 33.0 °C | 18.3 °C | 33.8 °C | 27.3 °C | 18.8 °C | 27.8 °C | 21.2 °C | 9.4 °C | 109.2 mm | 2.7 mm | 0.0 mm | 0.0 mm |
| July | 45.0 °C | 35.4 °C | 22.8 °C | 35.5 °C | 29.4 °C | 21.6 °C | 27.8 °C | 23.0 °C | 13.9 °C | 165.1 mm | 1.8 mm | 0.0 mm | 0.0 mm |
| August | 44.4 °C | 35.8 °C | 20.6 °C | 36.0 °C | 29.9 °C | 21.4 °C | 28.3 °C | 22.8 °C | 12.8 °C | 151.1 mm | 1.8 mm | 0.0 mm | 0.0 mm |
| September | 44.4 °C | 32.2 °C | 15.6 °C | 36.1 °C | 26.1 °C | 11.8 °C | 27.2 °C | 19.3 °C | 5.0 °C | 120.7 mm | 2.4 mm | 0.0 mm | 0.0 mm |
| October | 38.3 °C | 26.7 °C | 6.7 °C | 28.8 °C | 20.2 °C | 2.8 °C | 25.0 °C | 13.1 °C | -2.8 °C | 171.2 mm | 3.0 mm | 0.0 mm | 0.0 mm |
| November | 32.8 °C | 20.2 °C | 0.6 °C | 25.6 °C | 13.9 °C | -0.6 °C | 24.4 °C | 7.2 °C | -7.2 °C | 97.8 mm | 2.6 mm | 89.0 mm | 0.1 mm |
| December | 32.2 °C | 15.3 °C | -9.4 °C | 24.0 °C | 9.2 °C | -11.5 °C | 21.1 °C | 3.1 °C | -18.3 °C | 95.8 mm | 2.7 mm | 203.0 mm | 0.2 mm |
Data Visualisations
Remove WatermarksCurrent Year Climate Trends vs Historical


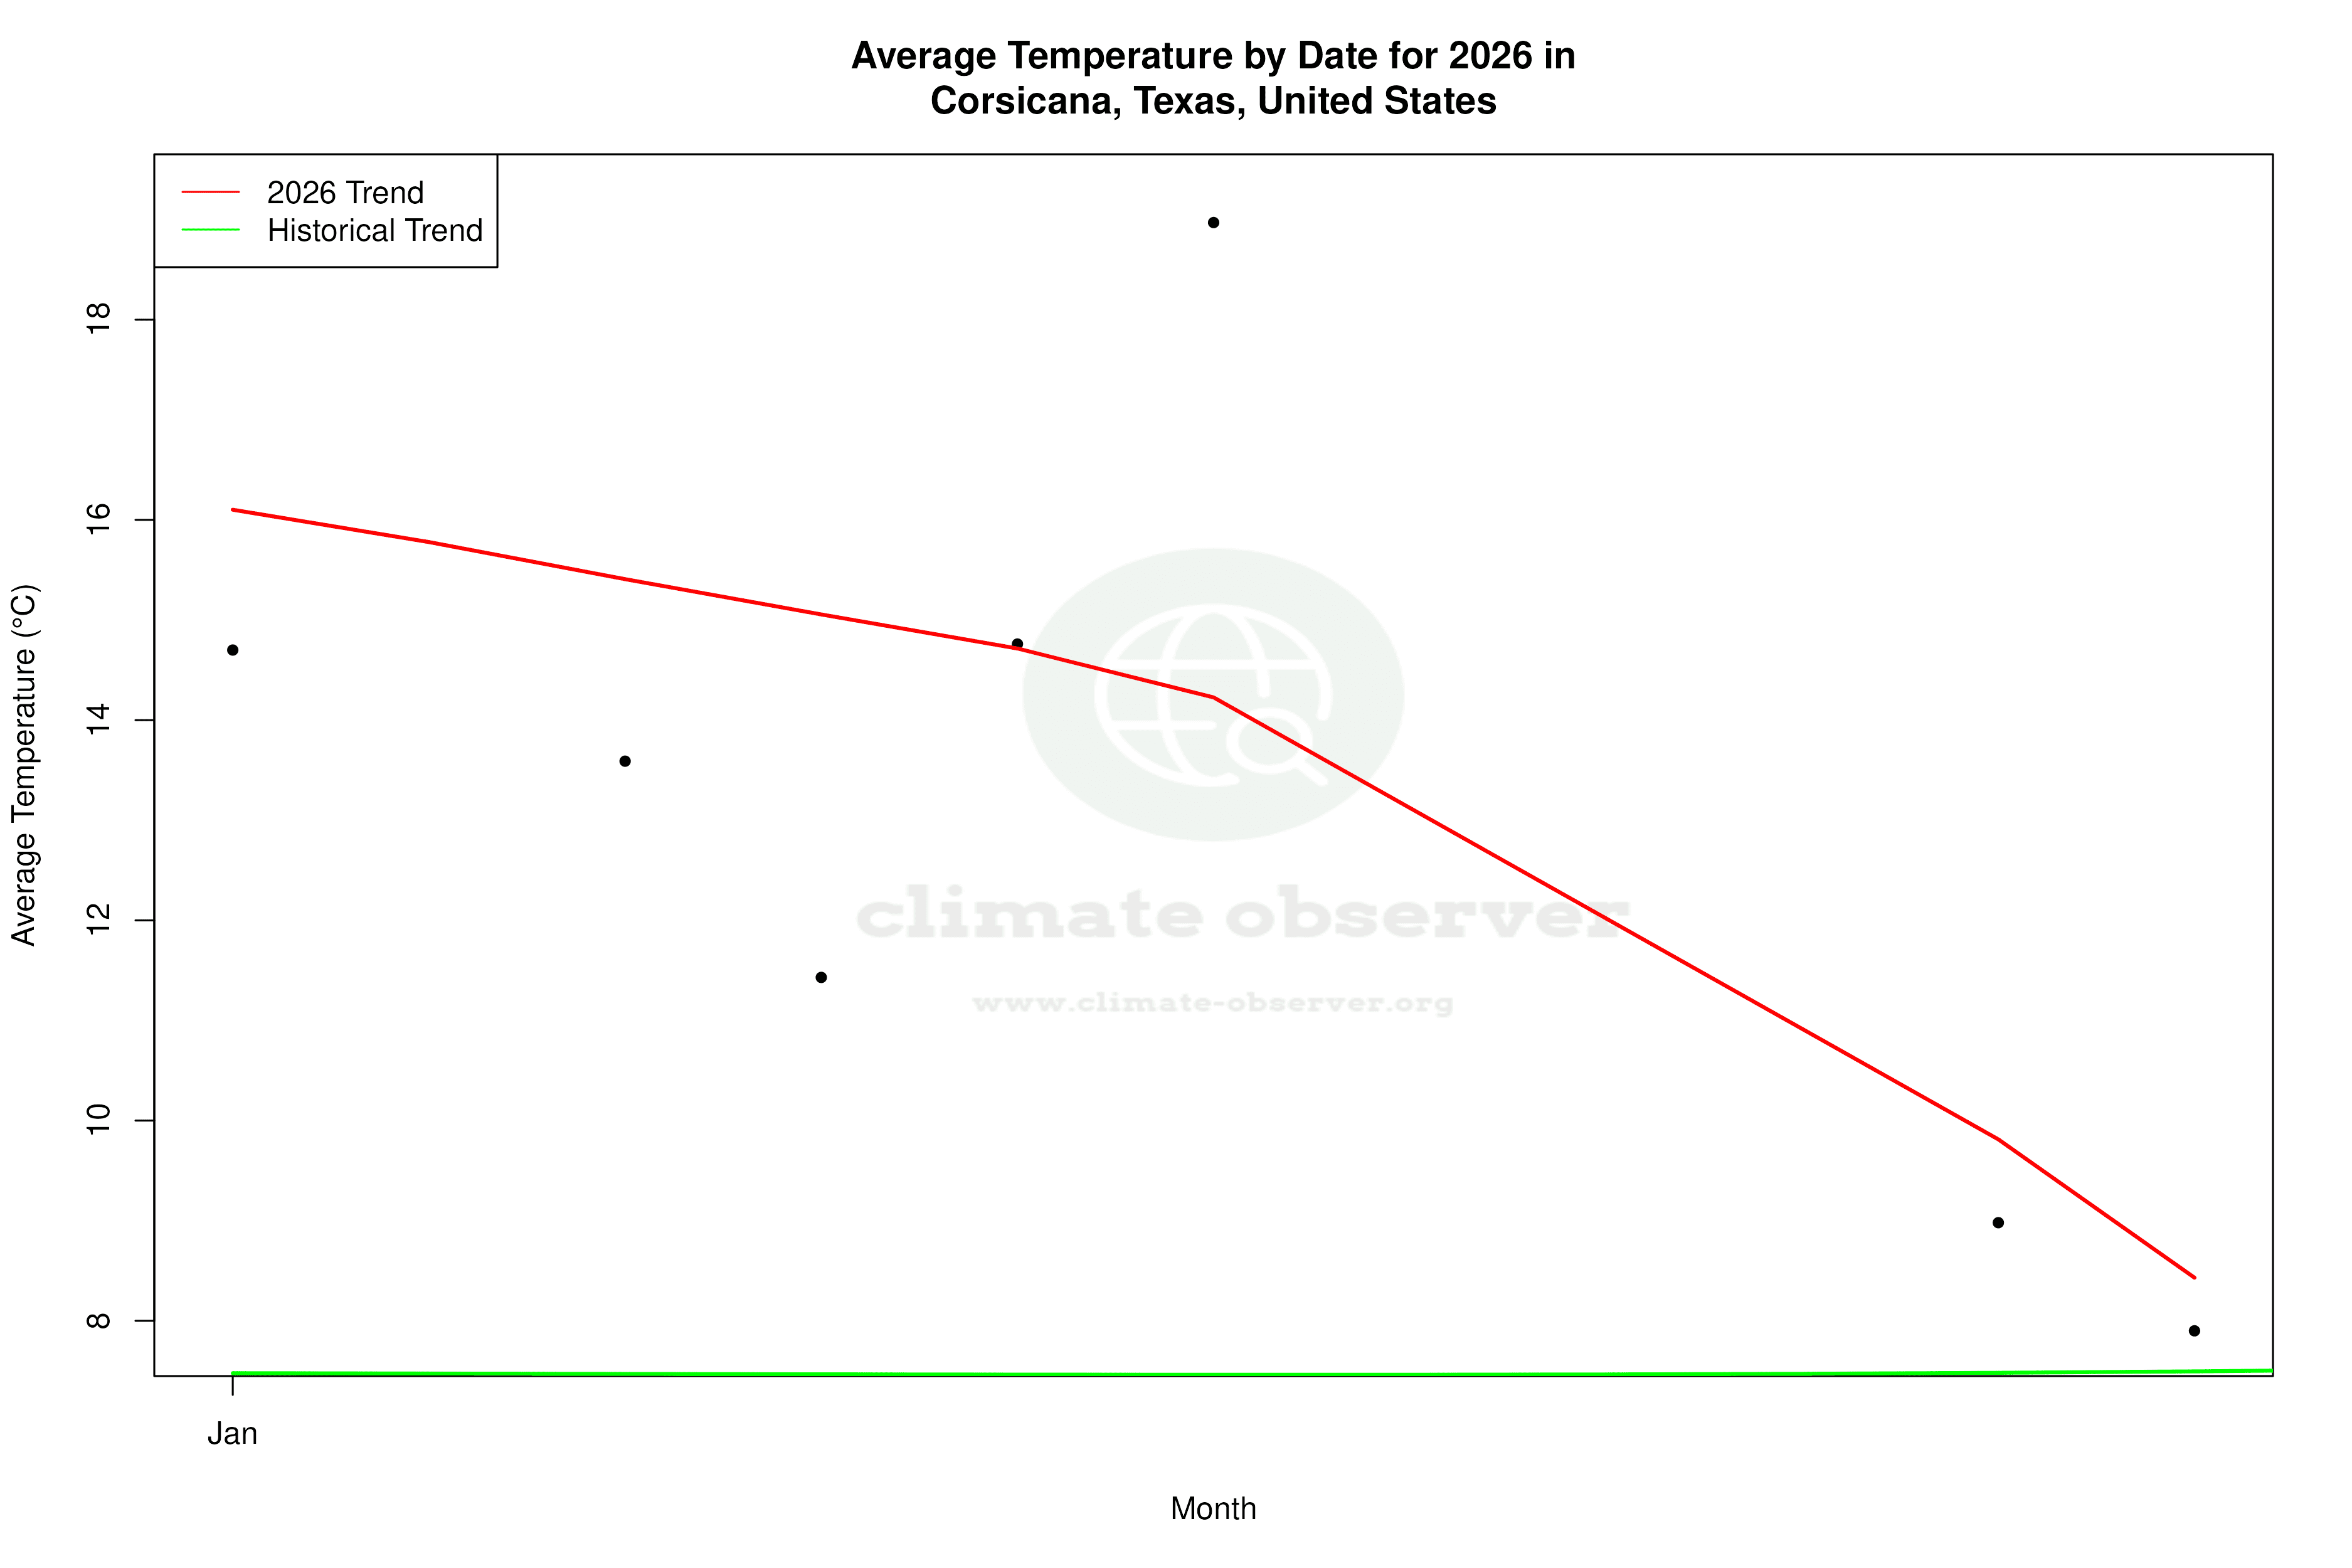

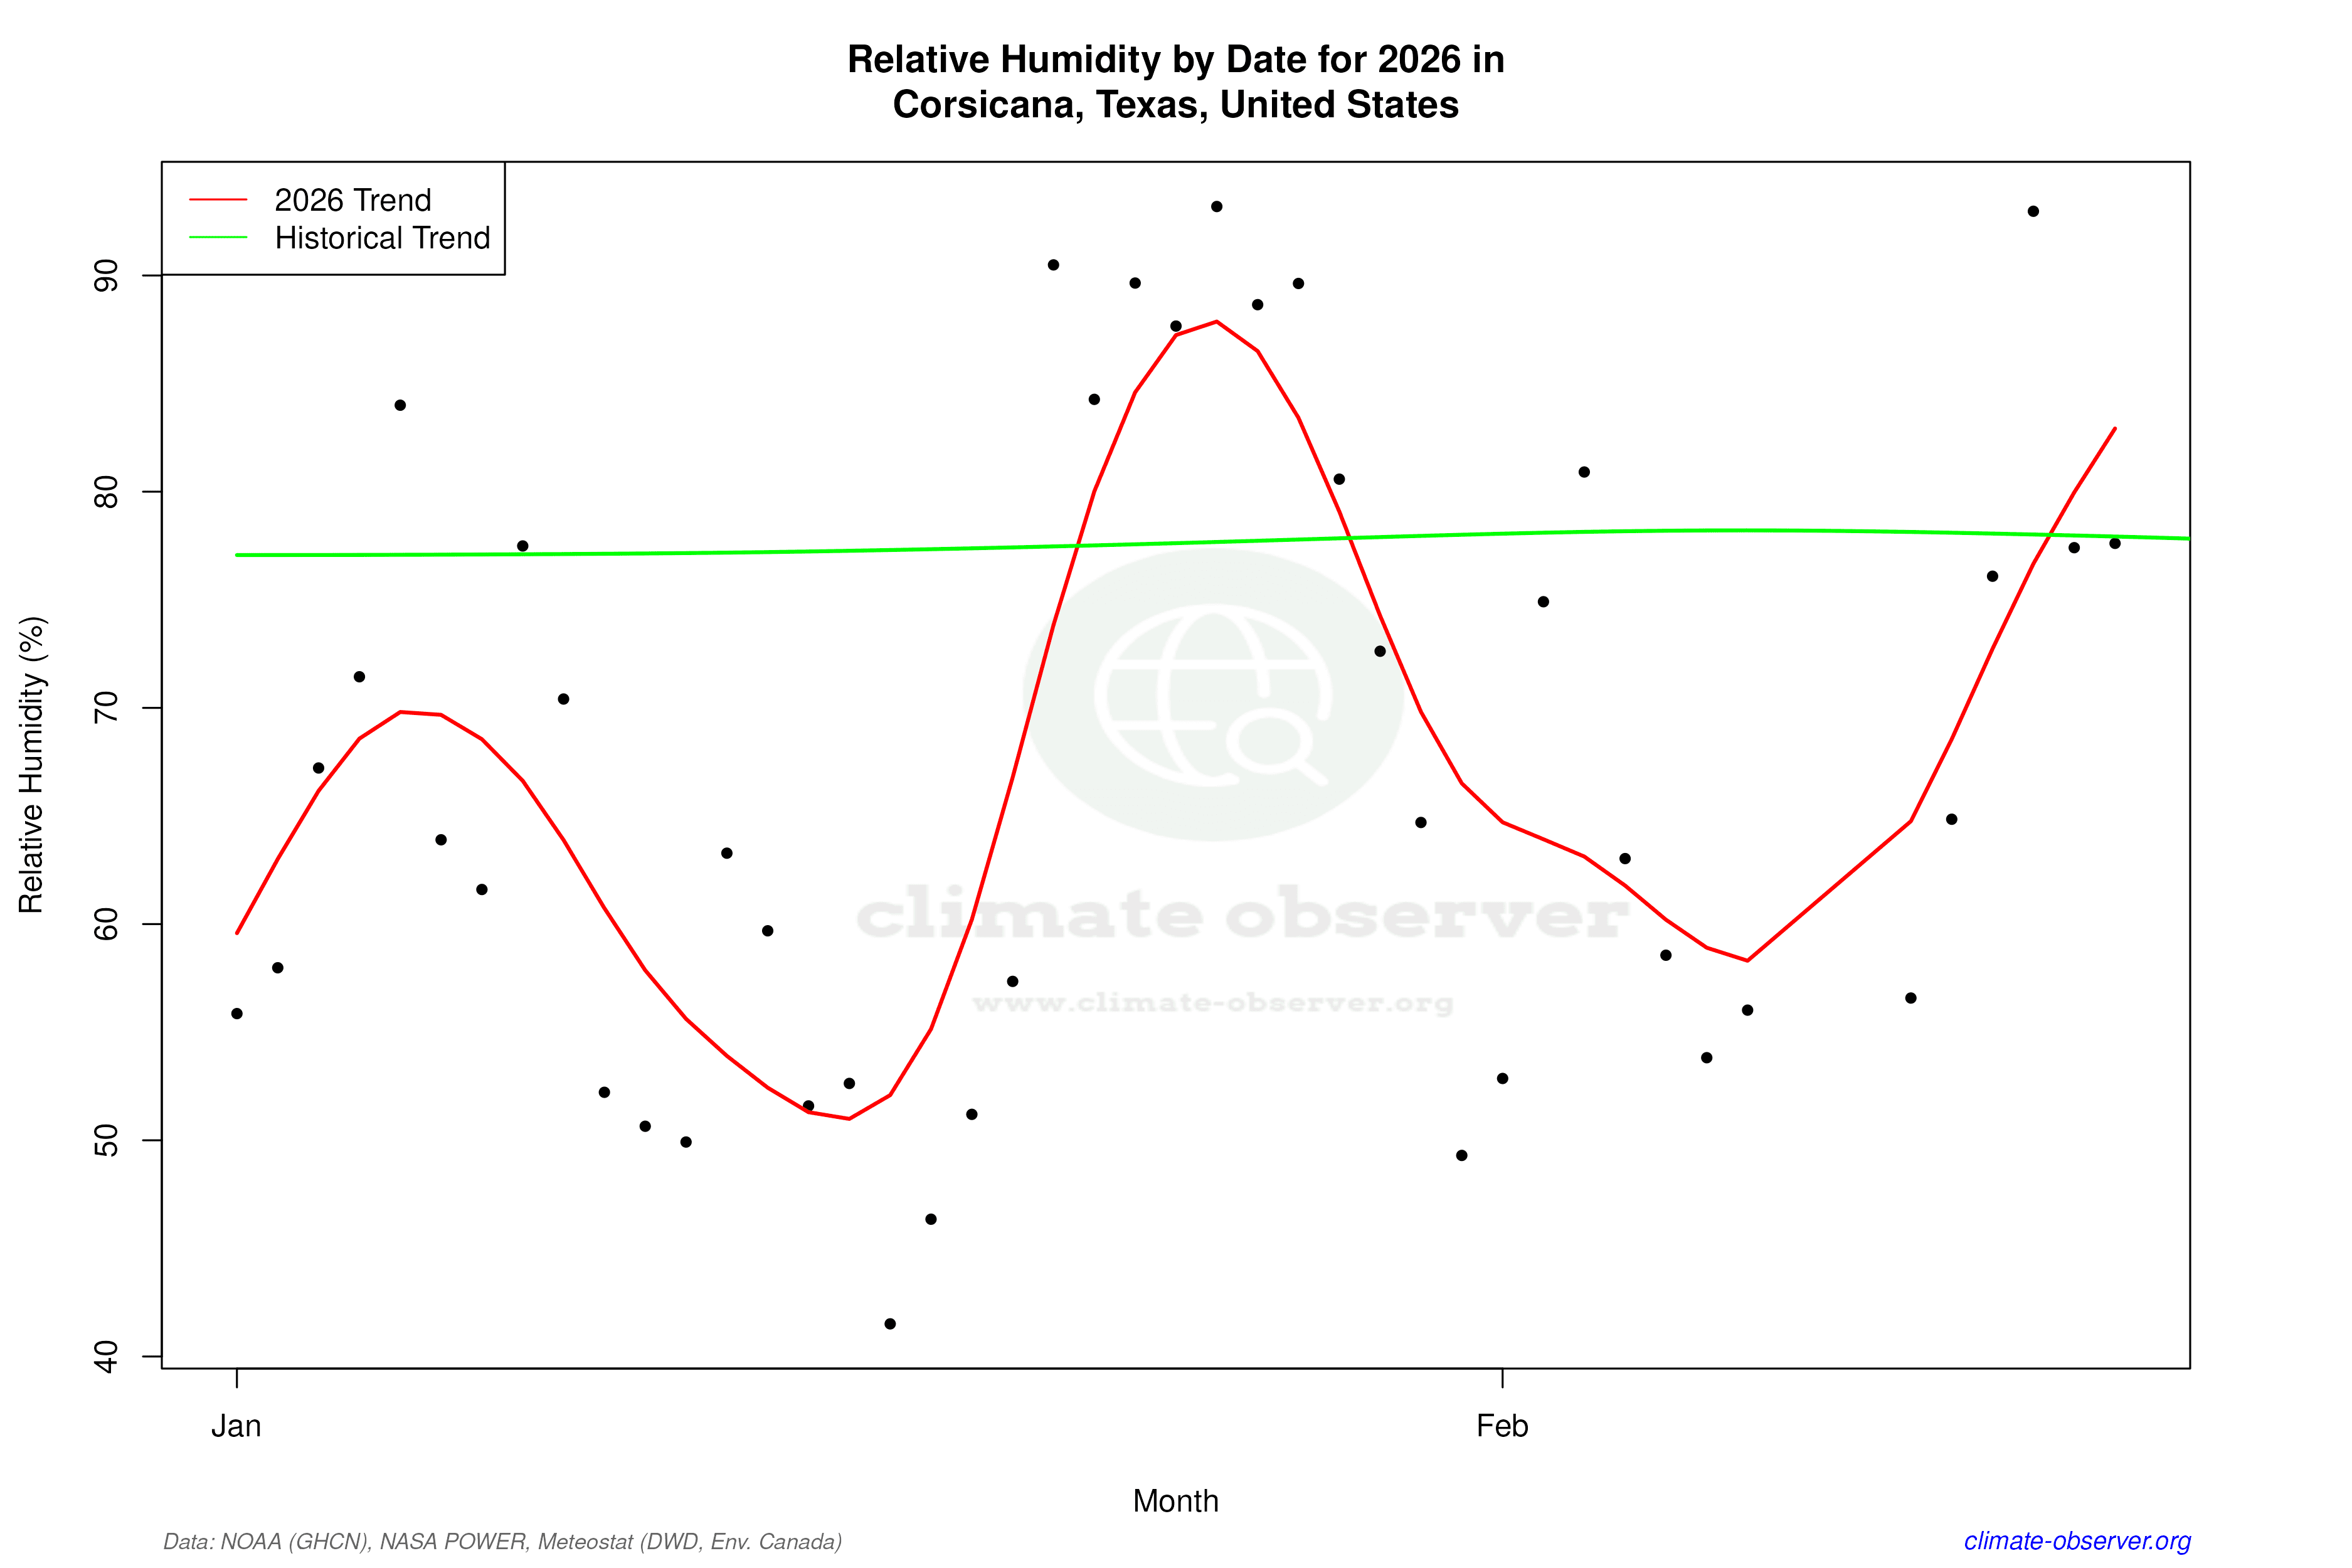

Max Temperature this Year | 1 of 6
Climate 12-Month Moving Averages


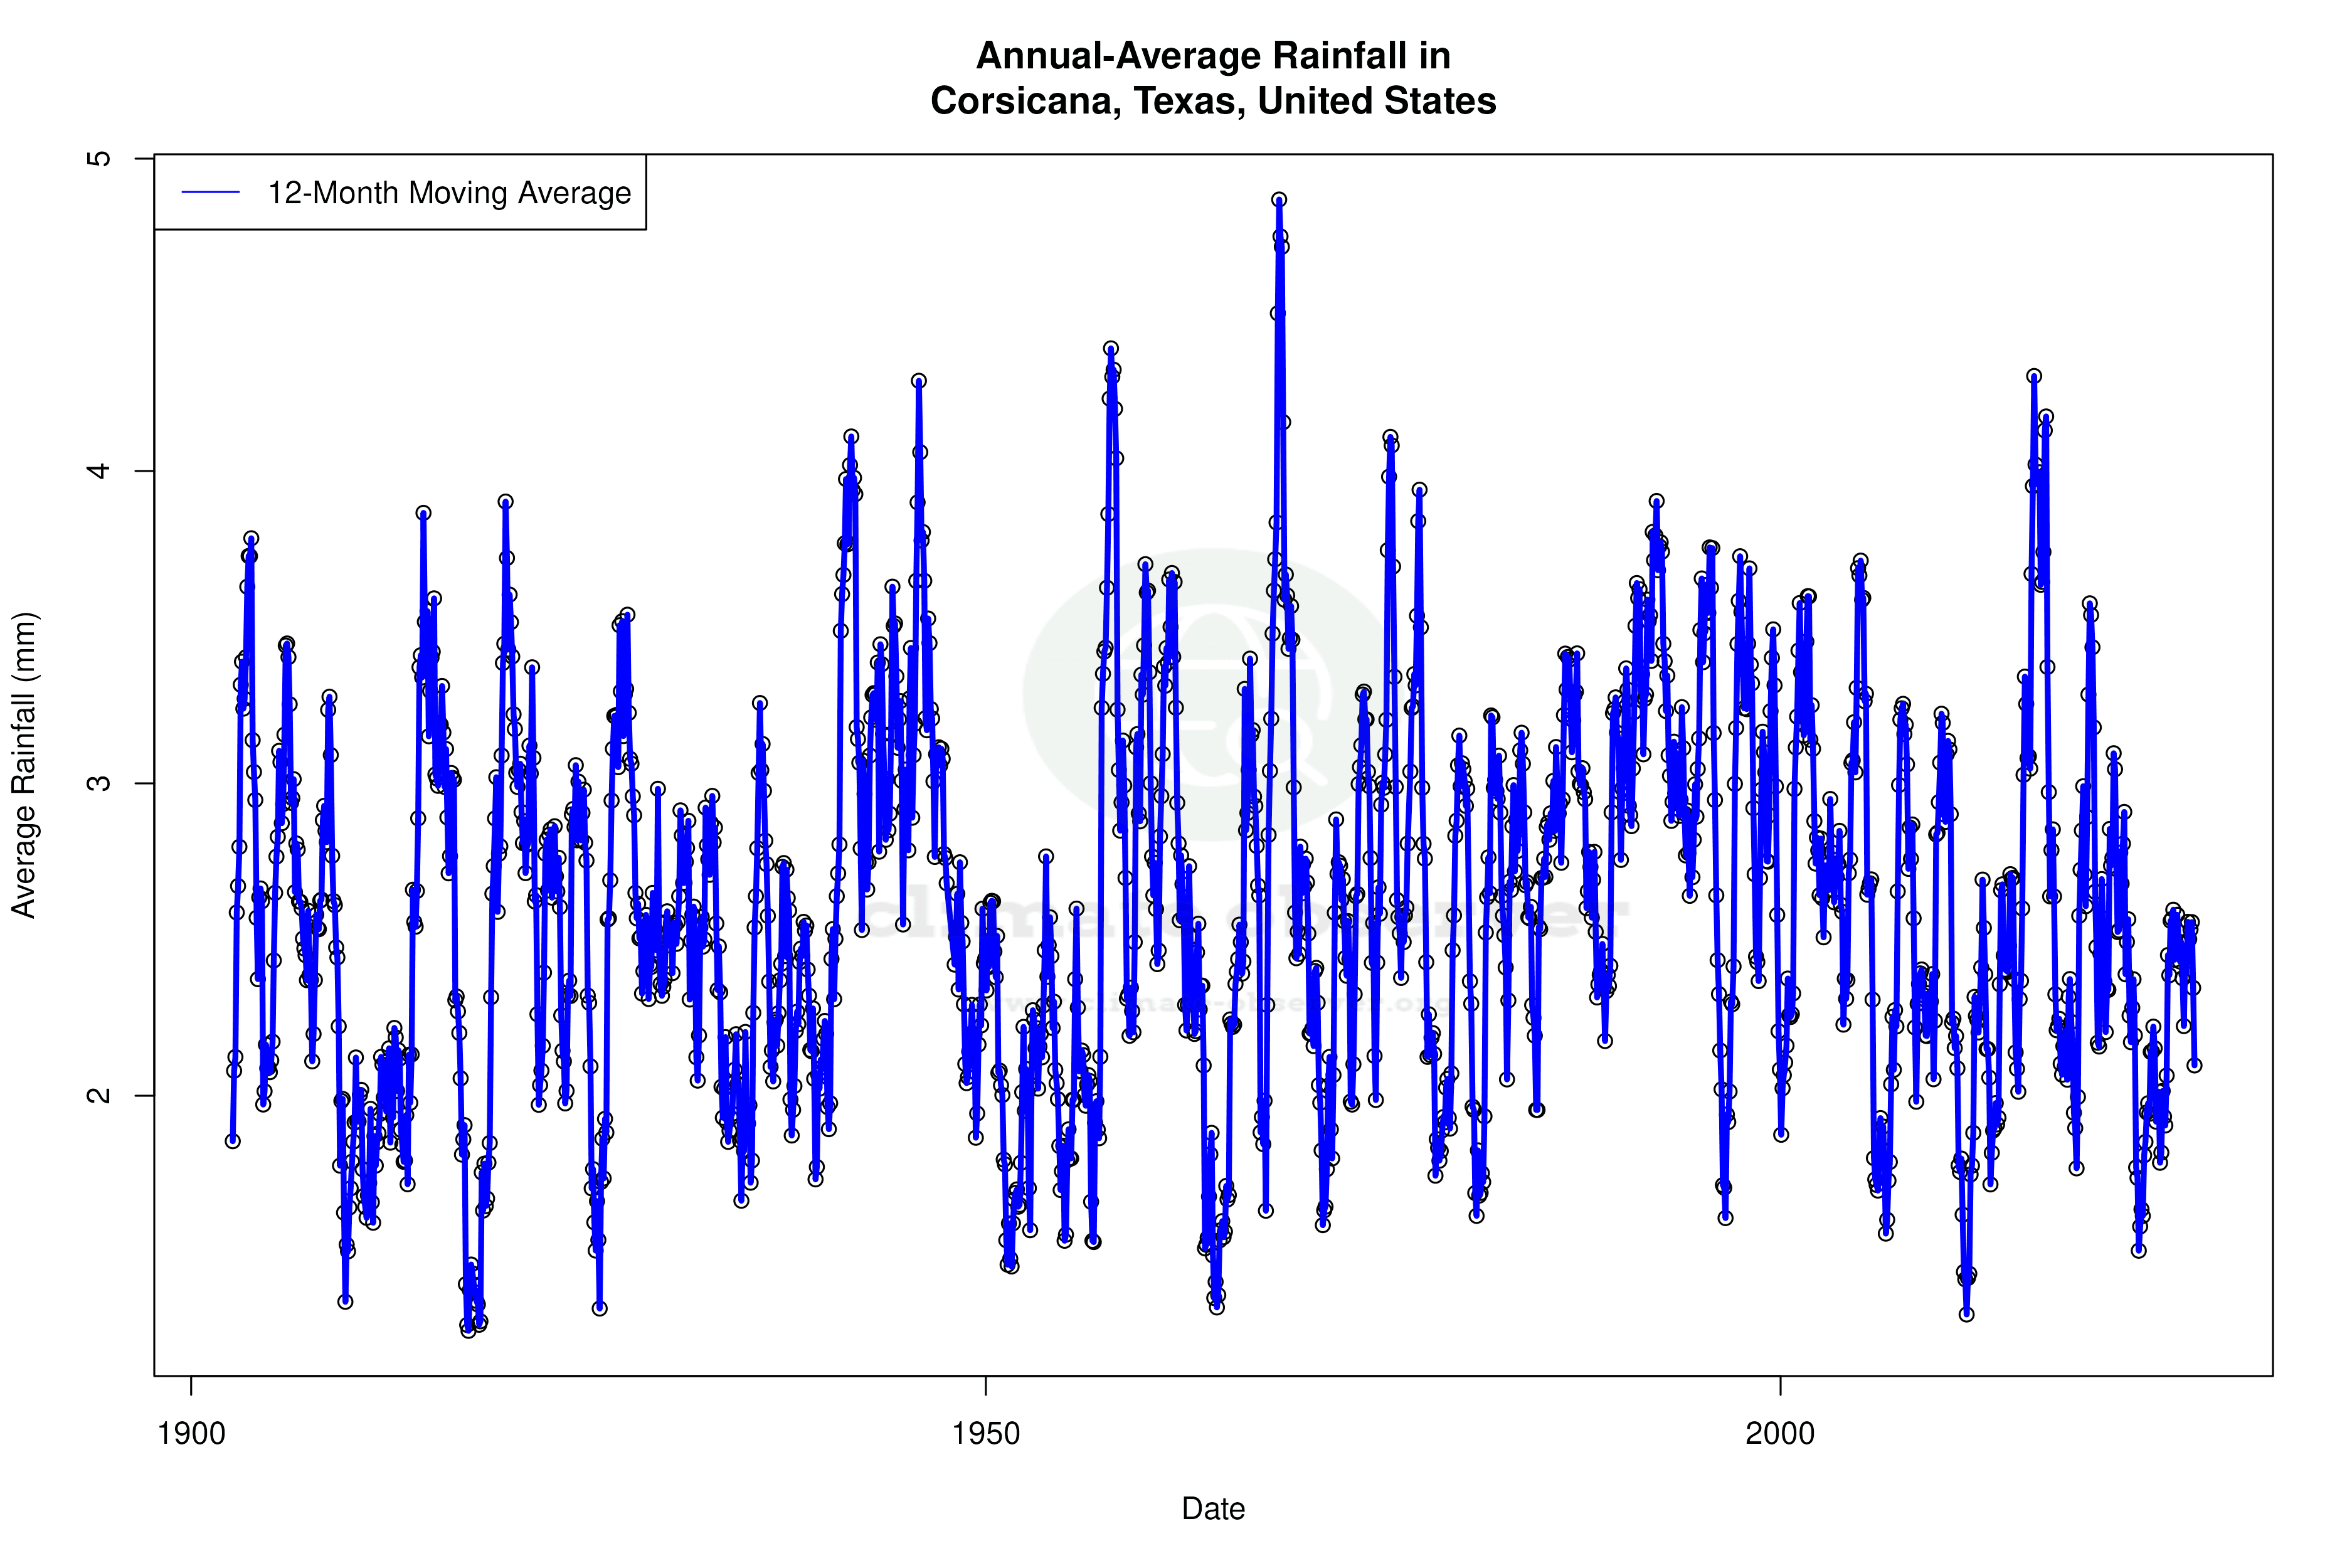


Max Temperature 12-Month MA | 1 of 6
Daily Data Points and Averages Throughout the Year
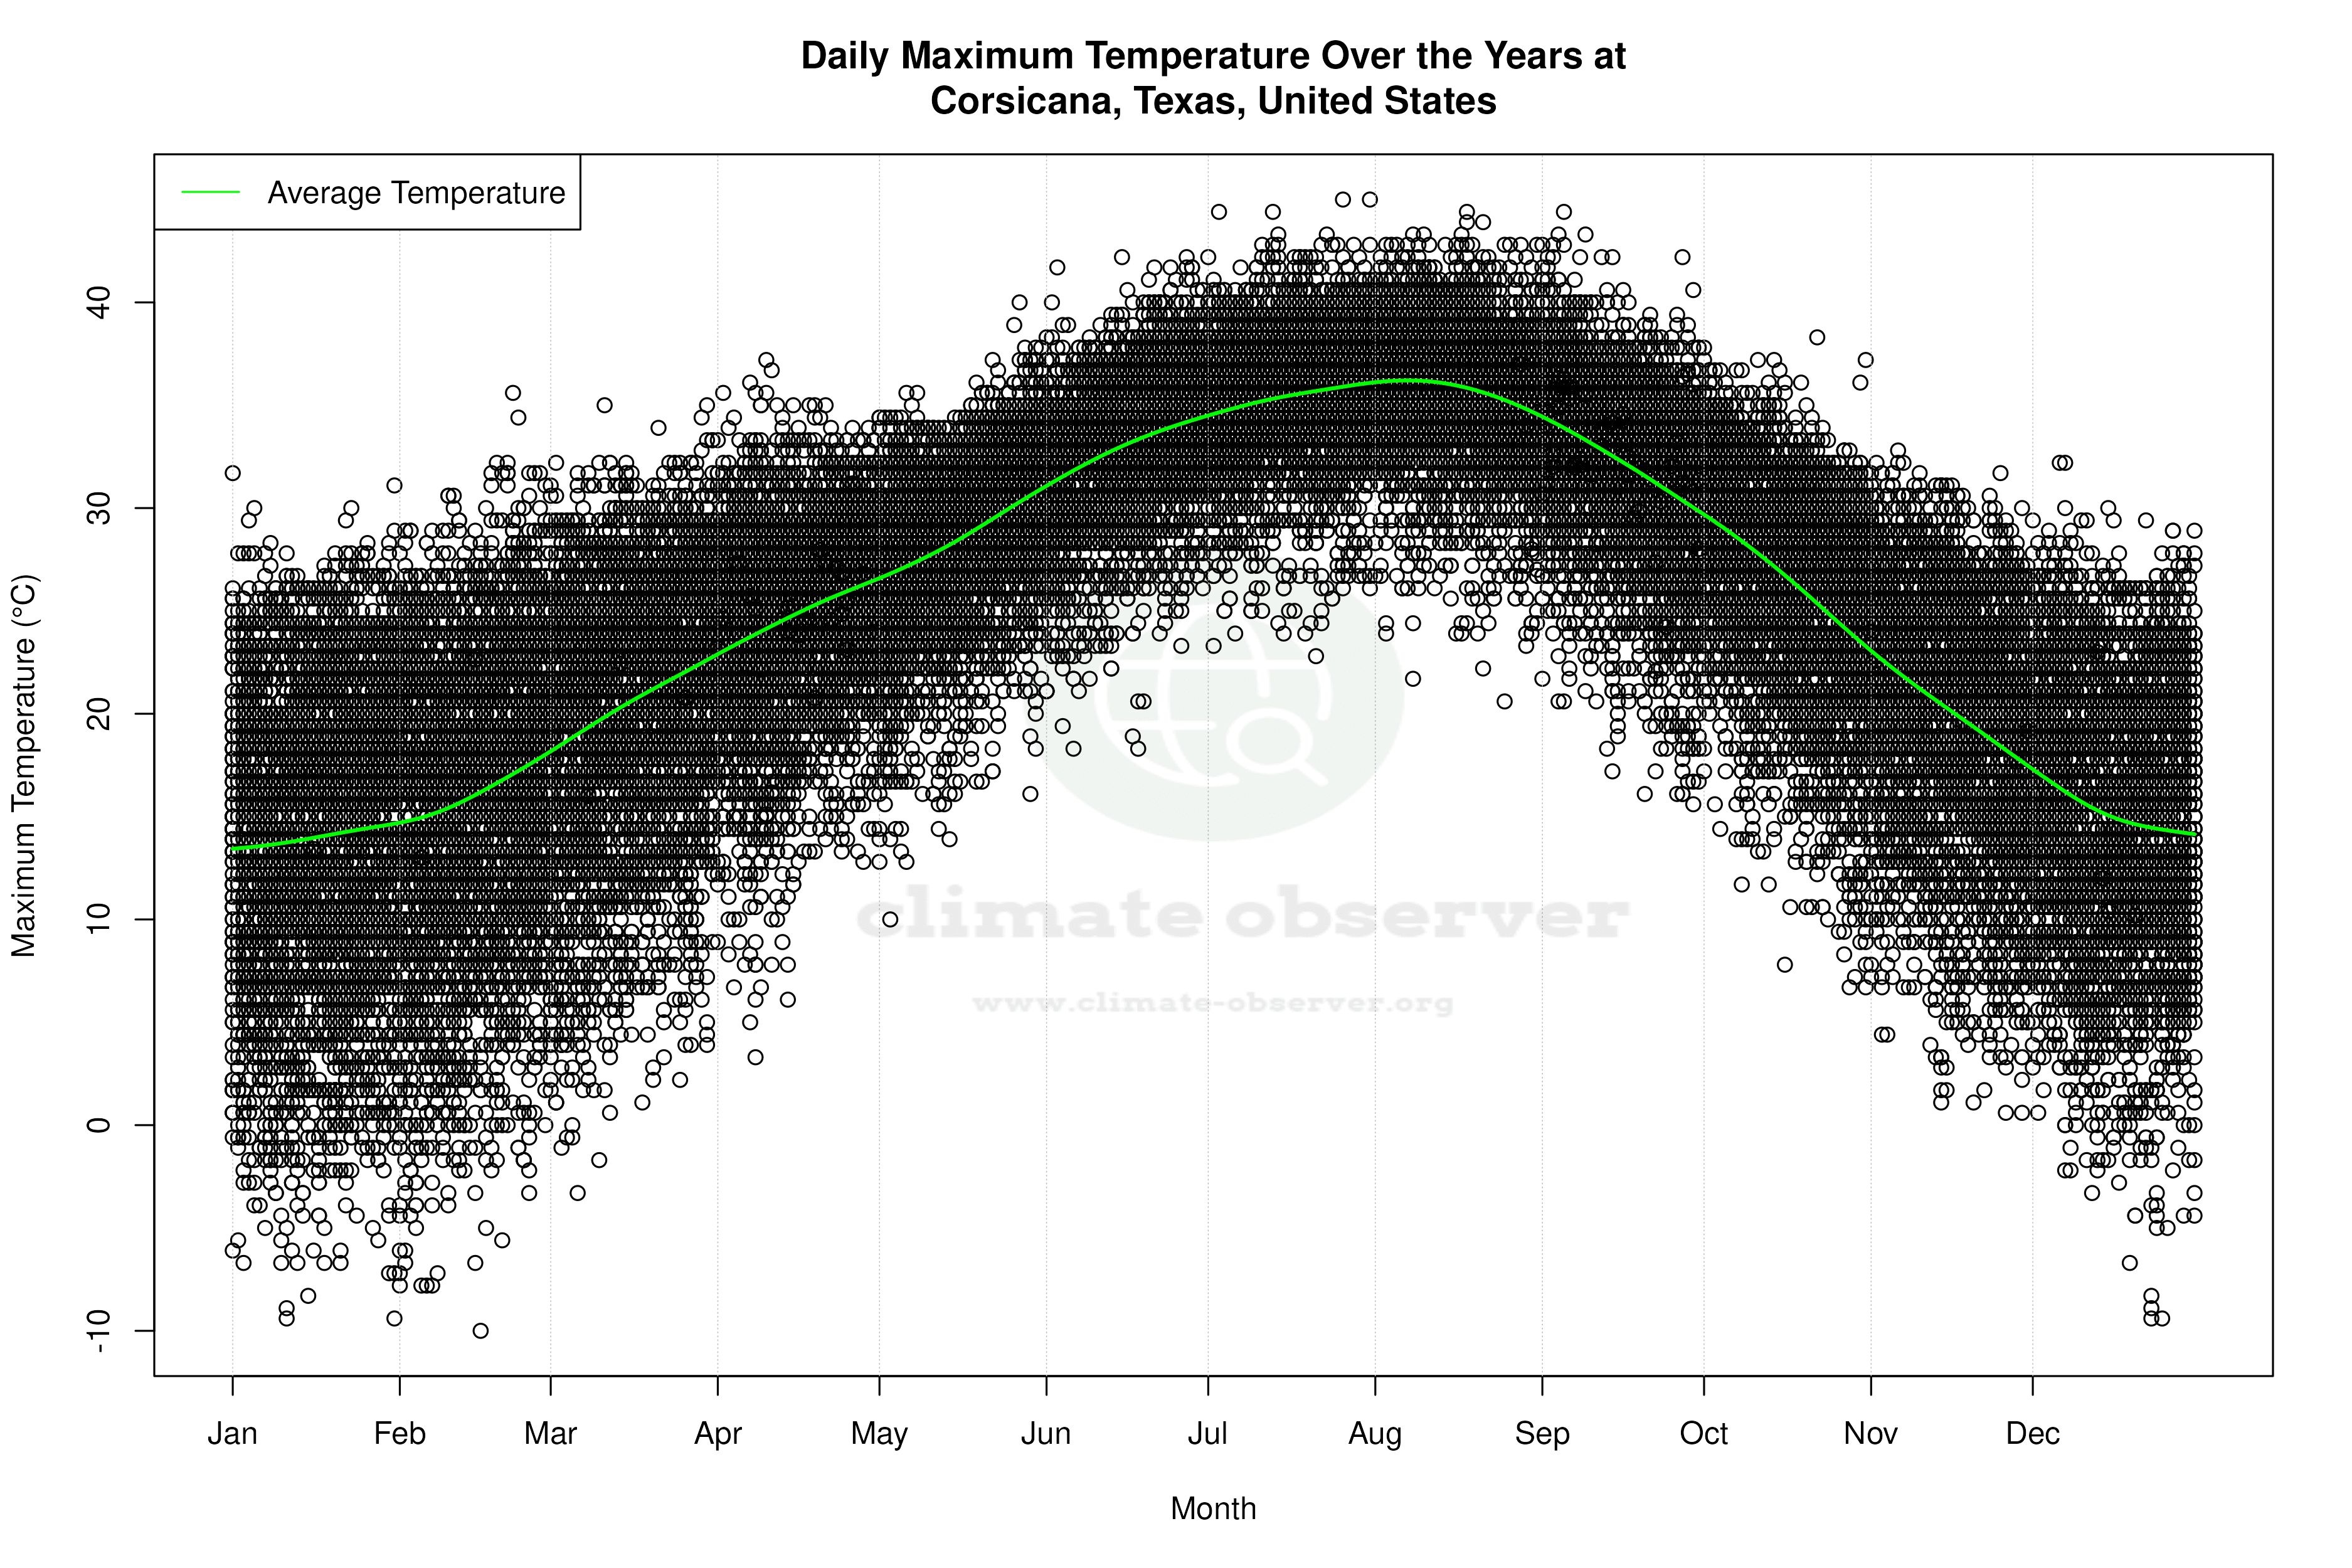


Average Max Temperature Throughout Year | 1 of 5
